Submitted on: 2024, 17th October; revised on: 2024, 21th October; accepted on: 2025, 3rd May
Home range analysis of Teratoscincus roborowskii in the Turpan Basin, Northwestern China: insights from VHF tagging technology
1 Key Laboratory of Special Environment Biodiversity Application and Regulation in Xinjiang, Xinjiang Key Laboratory of Special Species Conservation and Regulatory Biology, International Center for the Collaborative Management of Cross-border Pest in Central Asia, School of Life Sciences, Xinjiang Normal University, Urumqi 830054, China
2 State Key Laboratory of Ecological Safety and Sustainable Development in Arid Lands, China-Tajikistan Belt and Road Joint Laboratory on Biodiversity Conservation and Sustainable Use, Xinjiang Key Laboratory of Biodiversity Conservation and Application in Arid Lands, Xinjiang Institute of Ecology and Geography, Chinese Academy of Sciences, Urumqi 830011, China
3 Xinjiang Key Laboratory for Ecological Adaptation and Evolution of Extreme Environment Biology, College of Life Sciences, Xinjiang Agricultural University, Urumqi, Xinjiang 830052, China
4 These authors contributed equally and should be treated as the co-first authors
* Corresponding author. Email: xufeng@ms.xjb.ac.cn
Abstract. The home range (HR) of an animal encompasses the area utilized during activities such as foraging, mating, and other routine behaviors, with its size reflecting behavioral patterns and ecological niche. Factors influencing HR size include sex, body size, and diet, with sex and body size being the most significant determinants. The Teratoscincus roborowskii, or Turpan Wonder Gecko, is endemic to the Turpan Basin of Xinjiang, northwestern China, yet its HR during the breeding period remains understudied. This research employed radio-tracking methods to evaluate the HR of T. roborowskii during the breeding season, focusing on influences from sex and body size. Our study involved radio telemetry of 11 individuals from June to July in 2020 and 2021. We quantified total and core HR sizes using the Minimum Convex Polygon (MCP) and Kernel Density Estimation (KDE) methods. Results via MCP revealed total and core HR sizes of 7894.06 ± 2672.87 m2 and 4852.41 ± 2045.55 m2, respectively. Males exhibited larger HRs than females; however, the difference was not statistically significant (df = 3, p = 0.196, n = 11). A significant correlation was found between Snout-vent Length (SVL) and HR size (r = 55, p = 0.002, n = 11), indicating that lizards with larger SVLs occupied larger HRs, regardless of sex. Comparison with mark-recapture methods showed that HR sizes were 4-5 times larger when measured via radio-tracking. This study provides critical insights into the activity range and influencing factors of T. roborowskii during the breeding period, contributing essential data for its conservation efforts.
Keywords. Kernel density estimation method, Minimum Convex Polygon, radio-tracking, movement ecology, reproduction period.
Home range refers to the area traversed by an animal during natural activities such as foraging, mating, nurturing young, and other routine behaviors (Burt, 1943; Powell and Mitchell, 2012). It constitutes a critical habitat that offers essential shelter and food resources, with environmental conditions and potential mates being the primary resources of interest in most ecological studies (Kearney et al., 2018; Ryberg et al., 2019; Ariano-Sánchez et al., 2020; Balouch et al., 2022; Clement et al., 2022; Renet et al., 2022; Ventura et al., 2022). The size of the HR is often viewed as an indicator of the energetic and physiological needs or ecological niche of a species (Huey et al., 1989; Warner and Shine, 2008; Verwaijen and Van Darnme, 2008; Kusaka and Valdivia, 2021; Sillero et al., 2021; Zhong et al., 2021). Consequently, researchers have extensively investigated the relationships between various ecological factors and HR area across different lizard species (Huey et al., 1989; Perry and Garland, 2002; Salido and Vicente, 2019).
Several factors may influence the size of a lizard’s HR. Larger-bodied lizards typically require greater distances to satisfy their energetic needs, thereby necessitating larger HRs for effective foraging (Armstrong, 1965; Schoener, 1968; Turner et al., 1969; Perry and Garland, 2002; Garcia-Rosales et al., 2021; Zhao et al., 2022). Additionally, HR size can be influenced by foraging strategies and the specific types of prey available within the ecological hierarchy (Nunn and Barton, 2000; Mysterud et al., 2001). Furthermore, studies indicate that male lizards often exhibit larger HRs than females during the breeding season, a phenomenon attributed to differences in mating behaviors (Aragon et al., 2001; Mysterud et al., 2001; Li et al., 2013; Ventura et al., 2022).
Two primary methods are employed to calculate HR: the Minimum Convex Polygon (MCP) method and Kernel Density Estimation (KDE). The MCP method is widely recognized for its ease of use and comparability across studies (Anderson, 1982; Laver and Kelly, 2008). While it does not appropriately account for the unique distribution patterns of observations, it provides a straightforward description of the HR (Seaman and Powell, 1996). Conversely, the KDE method has gained favor for its ability to generate utilization distributions (UD) and assess the degree of HR overlap among individuals (Worton, 1995; Mitchell and Powell, 2004; Gitzen et al., 2006). This technique requires the careful selection of an appropriate bandwidth for calculating UD, with least squares cross-validation (hLSCV) and reference bandwidth (href) methods being common choices. The hLSCV method is often recommended due to its capacity for smoothness and fit, rendering it more suitable than the href approach (Powell, 2000; Gitzen et al., 2006).
Over the years, methodologies for recording animal occurrence locations have transitioned from labor-intensive techniques to automated systems (Harris et al., 1990; Cagnacci et al., 2010; Kie et al., 2010). Very High-Frequency (VHF) radio telemetry devices enable the real-time monitoring and recording of an animal’s sequential locations (Harris et al., 1990; Marzluff et al., 2004; Mitchell and Powell, 2004; Moorcroft and Barnett, 2008; Williams et al., 2020). These devices incorporate transmitters that emit signals at specific radio frequencies, allowing tracking by nearby radio receivers. However, the use of VHF technology necessitates close proximity to the studied animals, which can interfere with their natural behavior and habitat use.
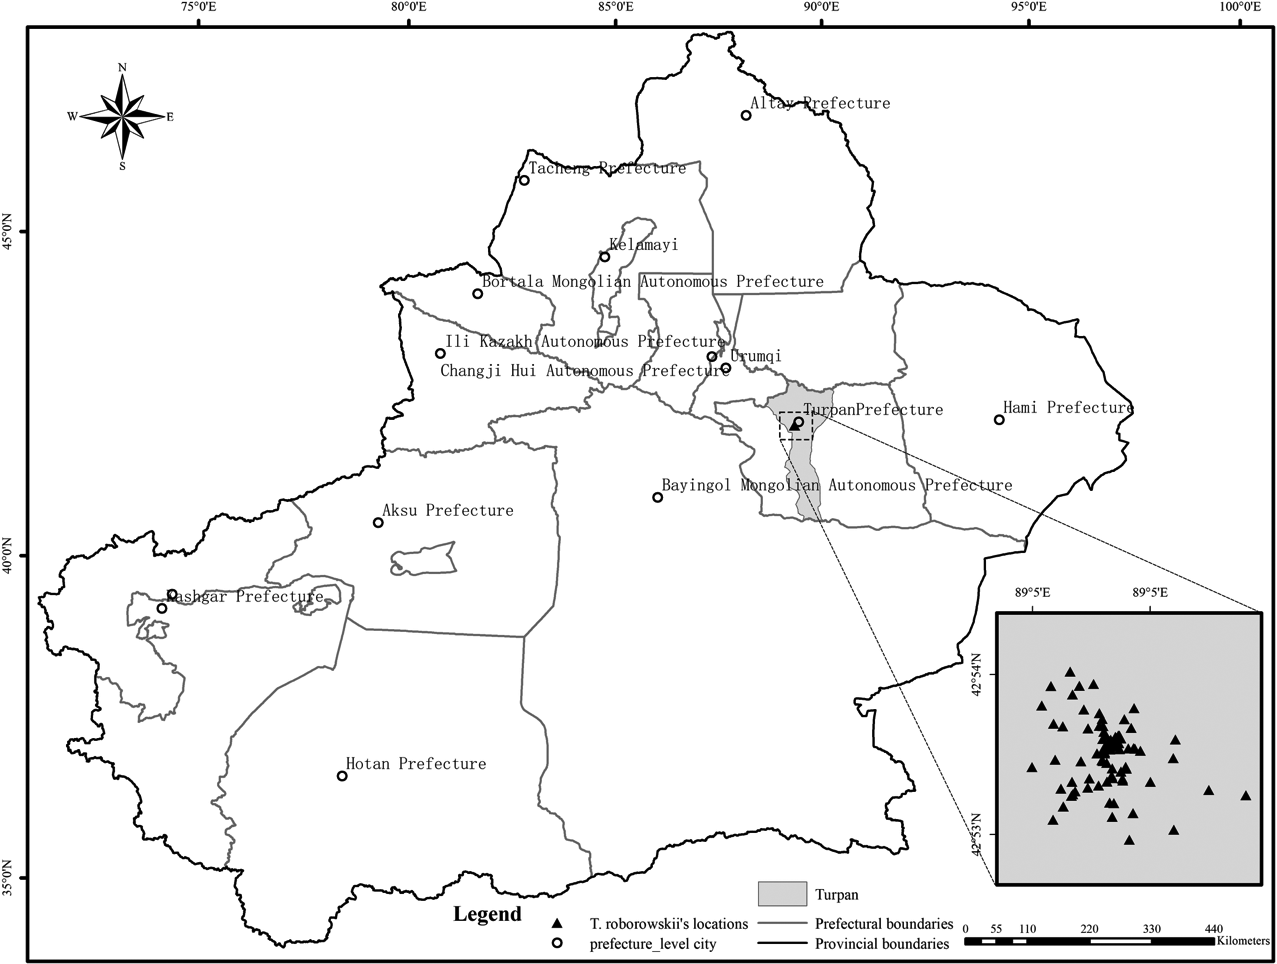
The Turpan Eremophyte Botanical Garden (TEBG) is located in the southeastern part of the Turpan Basin in Xinjiang, China (89°11’E, 42°51’N). This garden is unique as the only botanical garden globally dedicated to the Asian desert plant subregion, situated at altitudes ranging from -105 to -76 meters. The TEBG experiences an arid continental climate, characterized by an annual minimum temperature of -9.5 °C and a maximum temperature of 49.6 °C. The annual effective accumulated temperature is 5454.5 °C, with approximately 3000 hours of sunshine per year. Annually, the area receives an average precipitation of 16.4 mm and maintains an average humidity of 41.0% (Yin, 2004). The garden is home to a diverse array of flora, encompassing over 200 plant genera and 60 families, including species such as Tamarix spp., Calligonum spp., Capparis spinosa L., Ammopiptanthus spp., and various insect families, including Formicidae, Carabidae, and Tenebrionidae. Additionally, notable populations of reptiles and birds inhabit the garden, such as Vulpes corsac, Lepus spp., Eremias velox, Cyrtopodion spp., Phrynocephalus grumgrzimailoi, and Eryx tataricus.
2.2 Data collection using radio telemetry
During the breeding periods of June to July in 2020 and 2021, a radio-telemetry survey was conducted to track a total of 13 individuals of the target lizard species, comprising 5 females, 7 males, and 1 juvenile. In 2020, 7 lizards (3 females and 4 males) were monitored, while 6 lizards (2 females, 3 males, and 1 juvenile) were observed in 2021. The lizards were manually captured and equipped with VHF transmitters (model: Lotek’s CTx Connectivity VHF tags) weighing 0.9 g, representing less than 1% of the minimum body mass of the lizards. The transmitters were affixed to the lizards’ dorsum using a back-loading method. The snout-to-vent length (SVL) of all captured individuals was measured using a vernier caliper, and sex was recorded.
Following their release, the lizards’ positions (longitude and latitude) were tracked using a Lotek VHF biotracker equipped with a three-element BNC antenna. To mitigate the effects of temporal autocorrelation on home range estimations, a tracking schedule was established to record one GPS location within a 60-minute interval each day from 00:00 to 05:00 h, aligning with the active foraging period of the species during the night. The lizards were recaptured to retrieve the transmitters, and positional data were subsequently downloaded for analysis. Telemetry individuals were designated as F1-F6 for females, M1-M6 for males, and J1 for the juvenile. During the study, 230 effective location points for the lizards were recorded; however, less than five location points for individuals M5 and M6 could not be included in the home range model analysis. Consequently, only 11 individuals were analyzed for home range results.
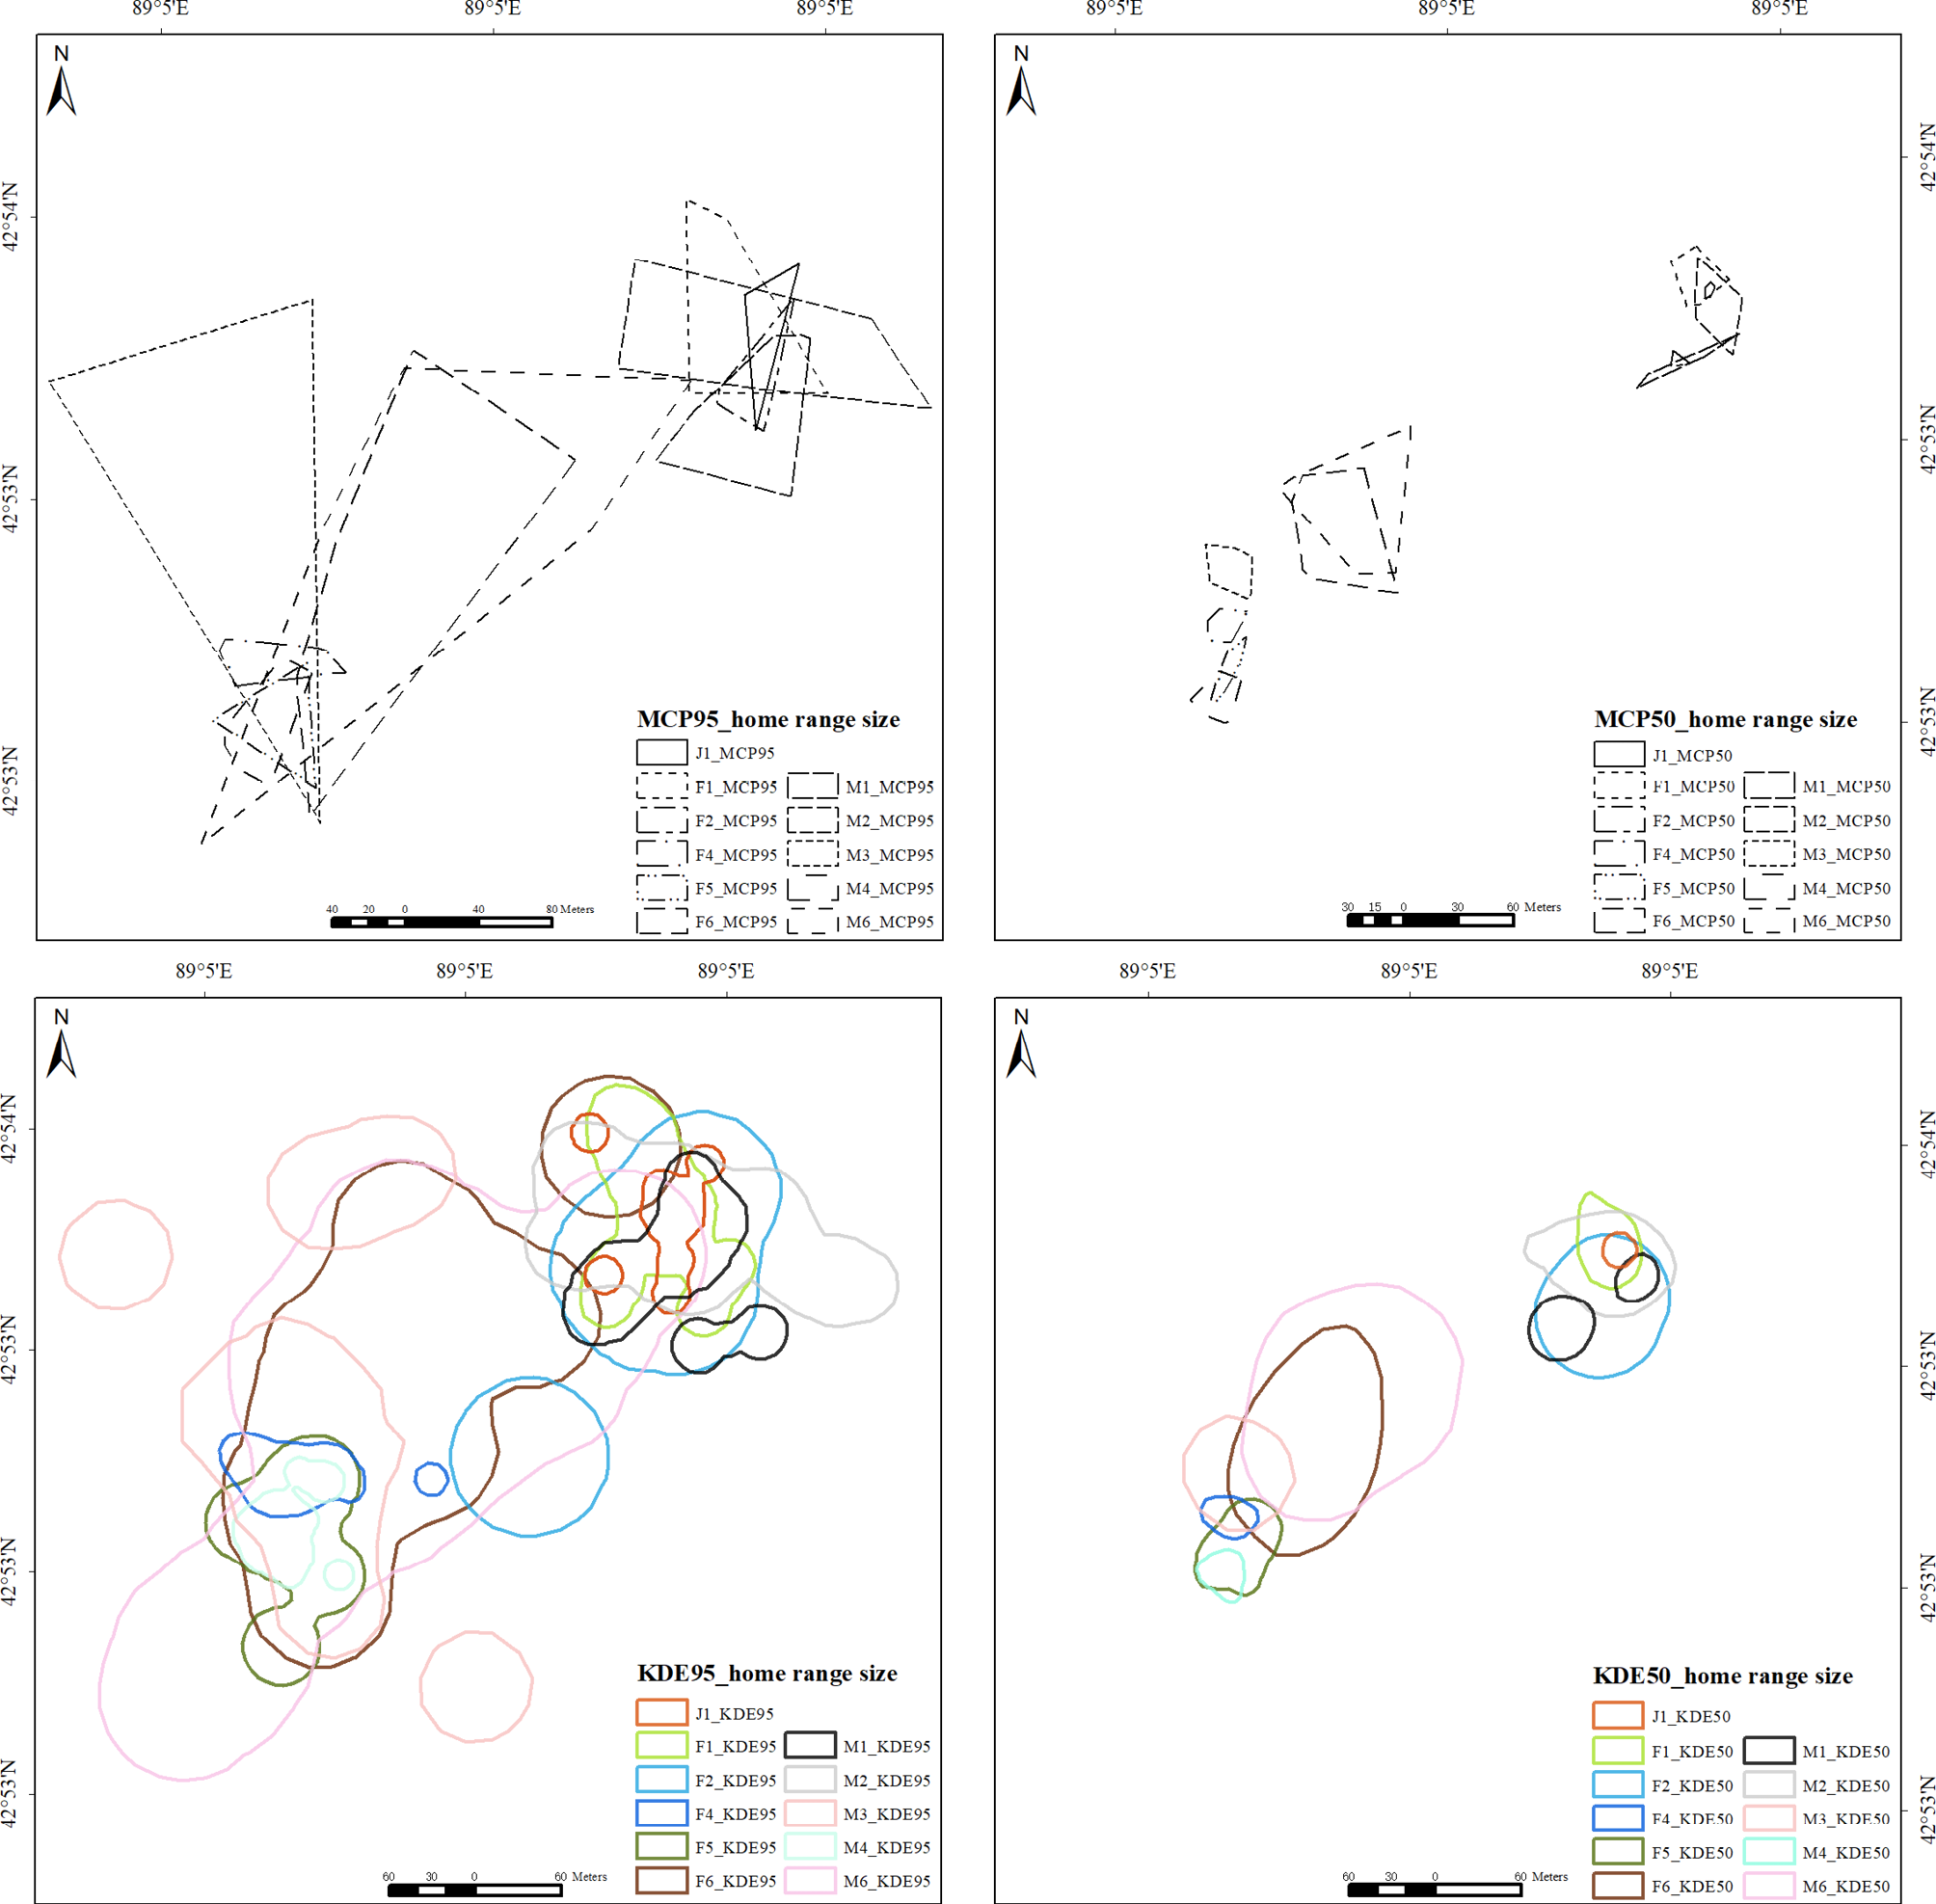
To determine the home ranges of the 11 individuals, we employed two methods: the Minimum Convex Polygon (MCP) and Kernel Density Estimation (KDE), utilizing the adehabitatHR package in R version 4.1.2 (R Core Team, 2019). The KDE method was selected due to its widespread application among researchers for home range estimation (Silverman,1986; Worton, 1995). The 95% home ranges of the lizards were calculated using both the MCP and KDE methods, while the 50% home ranges were specifically derived from the KDE method. The 95% MCP and KDE probability contours represent the overall home range of the lizards, whereas the 50% MCP and KDE probability contours delineate the core area within their home range (Powell, 2000).
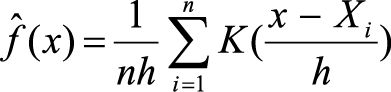
The KDE method for calculating the home ranges of the lizards relies on the bandwidth (h), the number of locations (n), and a unimodal bivariate probability density function (K) as described by Silverman (1986).
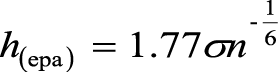
Seaman et al. (1999) recommended the least-squares cross-validation (LSCV) method for bandwidth selection in KDE. However, recent studies have indicated that the LSCV bandwidth may not be suitable for many lizard species. Consequently, we opted for the reference bandwidth (href), which offers improved fitting performance for small sample sizes. For the kernel function, we selected the Epanechnikov (epa) method, known for its ability to accurately fit multiple central areas and produce reliable results (Silverman, 1986). To facilitate comparisons with other studies, we also employed the MCP model. Additionally, we identified the activity centers for each individual using the KDE method (Bertrand et al., 1996).
Statistical analysis involved assessing the normality of the home range size and snout-vent length (SVL) variables using the Shapiro-Wilk normality test. The results indicated that home range size was not normally distributed (W = 0.808, p = 0.018). Consequently, we log-transformed the home range size and employed F test to evaluate variance homogeneity. After confirming the normality and homogeneity of variance of the data, we utilized the Student’s t-test to compare home range sizes and SVL between sexes. In cases where no significant difference in SVL was observed between the sexes, SVL data were combined to analyze the effect of gender on home range size. To assess the correlation between home range size and SVL, we calculated Pearson’s correlation coefficient. It is important to note that for juvenile individual J1, we performed home range calculations without conducting further statistical analyses. All statistical analyses were conducted using R (R Core Team, 2019), and data are presented as Mean ± standard error (Mean ± SE). The significance level was set at p ≤ 0.05.
During the survey period, we collected a total of 230 location points for the 11 lizards, yielding an average of 20.91 ± 2.36 points per individual. The 95% home range sizes for each lizard were calculated using both the Minimum Convex Polygon (MCP) and Kernel Density Estimation (KDE) methods. The areas ranged from a minimum of 1182.72 m² to a maximum of 25669.02 m² for the MCP method, and from 4120.18 m² to 85977.76 m² for the KDE method. The mean total home range size for the lizards was 8567.79 ± 2859.55 m² as determined by the 95% MCP method and 28006.87 ± 8455.75 m² as calculated using the 95% KDE method. Furthermore, we identified the core area within the home range for each individual, finding mean core sizes of 927.80 ± 366.68 m² (50% MCP) and 4970.70 ± 1856.47 m² (50% KDE).
| ID | 95%MCP/m2 | 95%KDE/m2 | 50%MCP/m2 | 50%KDE/m2 |
|---|---|---|---|---|
| M1 | 4175.48 | 10700.52 | 198.07 | 2393.54 |
| M2 | 7915.51 | 22711.50 | 781.09 | 5402.25 |
| M3 | 20717.65 | 40166.70 | 532.41 | 1673.61 |
| M4 | 1747.42 | 4120.18 | 458.73 | 682.32 |
| M6 | 25669.02 | 85977.76 | 3374.15 | 19050.47 |
| M1-M6 Mean±SE | 12045.02±4721.50 | 32735.33±14654.04 | 786.7±504.30 | 5840.44±3395.19 |
| F1 | 4778.08 | 11958.08 | 597.44 | 1839.71 |
| F2 | 1182.72 | 30242.78 | 45.08 | 3636.23 |
| F4 | 1194.22 | 4479.96 | 277.13 | 762.55 |
| F5 | 1879.77 | 11207.34 | 241.35 | 2819.91 |
| F6 | 16418.05 | 58503.87 | 2772.50 | 11446.41 |
| F1-F6 Mean±SE | 5090.57±2908.36 | 23278.41±9789.22 | 1068.89±583.76 | 4100.96±1898.30 |
| Mean±SE | 8567.79±2859.55 | 28006.87±8455.754 | 927.80±366.68 | 4970.7±1856.47 |
| J1 | 1156.75 | 4449.44 | 29.84 | 458.03 |
The results of the Student’s t-tests indicated that male lizards exhibited larger home range sizes compared to female lizards. However, there were no significant differences in snout-vent length (SVL) between adult male and female lizards (t = -0.858, df = 7.519, p = 0.418). When different SVL categories were combined and sex was the sole consideration, no significant differences were observed between male and female lizards regarding total home range size as assessed by both the 95% Minimum Convex Polygon (MCP) method (t = 1.410, df = 7.999, p = 0.196) and the 95% Kernel Density Estimation (KDE) method (t = 0.344, df = 7.778, p = 0.740). Similarly, for core home range size, no significant differences were found using the 50% MCP method (t = 0.795, df = 7.128, p = 0.452) or the 50% KDE method (t = 0.1495, df = 7.577, p = 0.885). Furthermore, all variables met the assumptions of normality and homogeneity of variance.
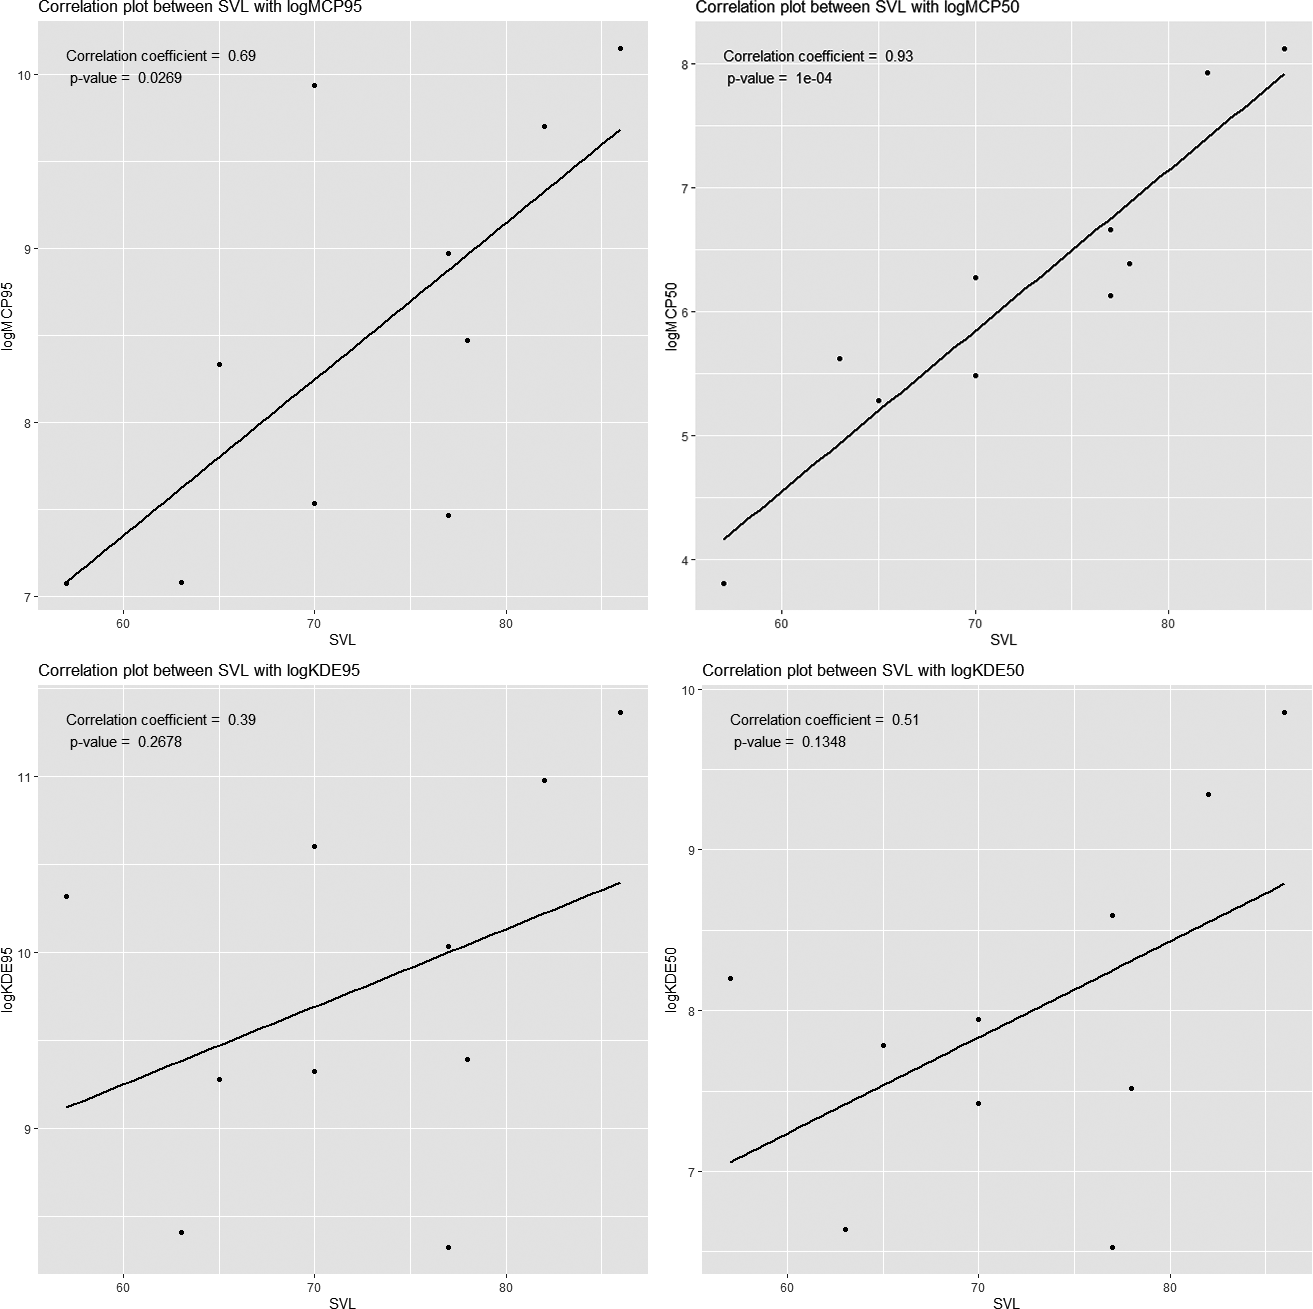
A correlation analysis was performed to investigate the relationship between snout-vent length (SVL) and home range size among individuals. The analysis revealed a significant positive correlation between the 50% Minimum Convex Polygon (MCP) core areas and SVL, suggesting that individuals with greater SVL tend to occupy larger home ranges. In contrast, the results obtained from the Kernel Density Estimation (KDE) method did not demonstrate a strong correlation trend. This discrepancy may be attributed to the inherent variability associated with the KDE method, which can lead to fluctuations in the estimated home range sizes.
4.1 Comparison between mark-recapture and radio telemetry methods
The mark-recapture method can be significantly influenced by the configuration of the capture grid and the distance from the capture point. Continuous tagging may also interfere with the behavior of the animals involved (Lira and dos Santos Fernandez, 2009). Consequently, this method has faced scrutiny owing to its propensity to underestimate home range sizes (Gurnell et al., 1989). Previous research consistently indicates that radio tracking methods yield larger home range estimates compared to the mark-recapture technique. For instance, both Sunquist (1987) and Bradshaw (2002) reported that the radio telemetry method produced significantly larger home ranges for Didelphis marsupialis and Tarsipes rostratus, respectively. Bergstrom et al. (1988) documented that radio telemetry estimates for chipmunks’ home ranges were six times greater than those derived from the mark-recapture method. Similar findings have been observed in studies concerning lizards, where the radio tracking method generated home range sizes between four and five times larger than those obtained through mark-recapture (Tisell et al., 2019). Specifically, Li et al. (2013) reported home range sizes for T. roborowskii calculated via the mark-recapture method as 337.37 ± 185.95 m² for males, 187.80 ± 90.09 m² for females, and 191.57 ± 52.4 m² for juveniles, confirming that males possessed larger home ranges than females and juveniles during the breeding season.
4.2 Effects of sex on home range
Adult sexual dimorphism in lizards is categorized into three types: (1) males larger than females, (2) females larger than males, and (3) no significant size difference between sexes (Powell and Russell, 1985). Generally, larger lizards require more extensive home ranges to meet their energy demands, thereby securing food resources and obtaining a competitive edge in mating scenarios. T. roborowskii falls into the third category, exhibiting no substantial size disparity between sexes, aside from males having a significantly broader head width than females (Harestad and Bunnell, 1979; Liu et al., 2010). The absence of a significant difference in home range size between sexes may stem from the negligible differences in body size and reproductive investment. Male lizards often overlap their home ranges with multiple females as a strategy to maximize reproductive success. During the breeding season, increased territoriality in males, coupled with the reproductive behaviors that elevate movement and survival costs for females, further complicates home range dynamics (Payne et al., 2022; Utsumi et al., 2022; Zhao et al., 2022). This study found that larger individuals of T. roborowskii tended to occupy more expansive home ranges, with males exhibiting larger HRs than females, likely attributable to the inconsequential differences in body size and reproductive effort between the sexes (Liu, 2010). Previous research corroborates these findings; for instance, male Leiolepis reevesii displayed significantly larger home ranges than females, and a positive correlation was noted between home range size and snout-vent length (SVL) (n=11, r=0.815, P=0.004). Although both males and females displayed intrasexual territoriality, females exhibited significantly higher territoriality than males (Yang et al., 2019). In another study, the home range of male Phrynocephalus vlangalii was reported to be 7.6 times larger than that of females, independent of SVL (Wang et al., 2004). Similarly, male S. crocodilurus demonstrated a significantly larger linear home range compared to females, with no apparent influence from body weight. Gender and age emerge as significant factors influencing home range dynamics, as both sexes display territorial behaviors (Qing, 2019). Furthermore, artificially elevated testosterone levels in Uta stansburiana have been shown to significantly increase home range size and territoriality (DeNardo et al., 1994).
Silverman (1986) assert that bandwidth selection considerably impacts the KDE method’s outcomes. Seaman and Powell (1996) recommend utilizing least squares cross-validation (hLSCV) as the bandwidth selection technique for KDE fitting. However, our findings indicated that employing hLSCV with small sample sizes resulted in excessive smoothness and overestimation of home range sizes, leading to fragmented home range representations, particularly in individuals with multiple activity centers and clustered distributions. For example, the smoothing value for individuals M1 (Loci=26) and A1 (Loci=27) was inadequate, making the hLSCV bandwidth non-nested and introducing considerable bias (Seaman et al., 1998). In contrast, the href method is generally viewed as appropriate for Gaussian-distributed sites and may offer advantages for estimating home range sizes (Bowman et al., 1999).
Our study demonstrates that male T. roborowskii have larger home range sizes than females during the breeding period, with larger individuals occupying more extensive home ranges. Additionally, we found that the radio tracking method produced larger home range estimates compared to the mark-recapture method, thereby providing a valuable reference for method selection in future research.
The authors are grateful to Yunyun Zhang, Liying Yin and Yixin Yu for participation in field research and two anonymous reviewers for their helpful comments on an earlier draft of this paper. This study is supported by the Third Xinjiang Scientific Expedition Program (grant number 2021xjkk0600) and the China Biodiversity Observation Network (Sino-BON).
Anderson, D.J. (1982): The Home Range - a new nonparametric-estimation technique. Ecology 63: 103-112.
Aragon, P., Lopez, P., Martin, J. (2001): Seasonal changes in activity and spatial and social relationships of the Iberian rock lizard, Lacerta Monticola. Can. J. Zool.-Rev. Can. Zool. 79: 1965-1971.
Arano-Sanchez, D., Mortensen, R.M., Reinhardt, S., Rosell, F. (2020): Escaping drought: Seasonality effects on home range, movement patterns and habitat selection of the Guatemalan beaded lizard. Glob. Ecol. Conserv. 23: E01178.
Armstrong, J.T. (1965): Breeding home range in the nighthawk and other birds - Its evolutionary and ecological significance. Ecology 46: 619-629.
Baird, T.A., Timanus, D.K., Sloan, C.L. (2003): Intra- and intersexual variation in social behavior: Effects of ontogeny, phenotype, resources, and season. In: Lizard Social Behavior, pp. 7-46. Fox, S.F, McCoy, J.J, Baird, T.A., Eds, Baltimore, John Hopkins Univerisity Press.
Balouch, D., Driscoll, D.A., Naseer, A. (2022): Impacts of land cover on reptile movement and habitat use in farming landscapes. Anim. Conserv. 25: 837-848.
Bergstrom, B.J. (1988): Home ranges of 3 species of chipmunks (Tamias) as assessed by radiotelemetry and grid trapping. J. Mammal. 69: 190-193.
Blundell, G.M., Maier, J.A.K., Debevec, E.M. (2001): Linear home ranges: effects of smoothing, sample size, and autocorrelation on Kernel estimates. Ecol. Monogr. 71: 469-489.
Boerger, L., Dalziel, B.D., Fryxell, J.M. (2008): Are there general mechanisms of animal home range behaviour? A review and prospects for future research. Ecol. Lett. 11: 637-650.
Burt, W.H. (1943): Territoriality and home range concepts as applied to mammals. J. Mammal. 24: 346-352.
Cagnacci, F., Boitani, L., Powell, R.A. (2010): Animal ecology meets Gps-based radiotelemetry: A perfect storm of opportunities and challenges. Philos. Trans. R. Soc. B-Biol. Sci. 365: 2157-2162.
Calenge, C. (2006): The package “Adehabitat” for the r software: A tool for the analysis of space and habitat use by animals. Ecol. Model. 197: 516-519.
Clement, V.E., Schluckebier, R., Rodder, D. (2022): About lizards and unmanned aerial vehicles: Assessing home range and habitat selection in Lacerta agilis. Salamandra 58: 24-42.
De Solla, S.R., Bonduriansky, R., Brooks, R.J. (1999): eliminating autocorrelation reduces biological relevance of home range estimates. J. Anim. Ecol. 68: 221-234.
DeNardo, D.F., Sinervo, B. (1994): Effects of corticosterone on activity and home-range size of free-ranging male lizards. Horm. Behav. 28: 53-65.
Fieberg, J., Kochanny, C.O. (2005): Quantifying home-range overlap: The importance of the utilization distribution. J. Wildl. Manage. 69: 1346-1359.
Garcia-Rosales, A., Ramirez-Bautista, A., Octavio-Aguilar, P. (2021): Aggressive sexual behaviour and spatial distribution of the polymorphic lizard Sceloporus minor (Squamata: Phrynosomatidae) from Central Mexico. Salamandra 57: 151-161.
Gitzen, R.A., Millspaugh, J.J., Kernohan, B.J. (2006): Bandwidth selection for fixed-kernel analysis of animal utilization distributions. J. Wildl. Manage. 70: 1334-1344.
Guerrero-Sanchez, S., Majewski, K., Orozco-Terwengel, P. (2022): The effect of oil palm-dominated landscapes on the home range and distribution of a generalist species, the Asian water monitor. Ecol. Evol. 12: e8531.
Harestad, A.S., Bunnell, F.L. (1979): Home range and body-weight - Re-evaluation. Ecology 60: 389-402.
Harris, S., Cresswell, W.J., Forde, P.G. (1990): Home-range analysis using radio-tracking data - a review of problems and techniques particularly as applied to the study of mammals. Mammal Rev. 20: 97-123.
Huey, R.B., Peterson, C.R., Arnold, S.J. (1989): Hot rocks and not-so-hot rocks - Retreat-site selection by garter snakes and its thermal consequences. Ecology 70: 931-944.
Kearney, M.R., Munns, S.L., Moore, D. (2018): Field tests of a general ectotherm niche model show how water can limit lizard activity and distribution. Ecol. Monogr. 88: 672-693.
Kie, J.G., Matthiopoulos, J., Fieberg, J. (2010): The home-range concept: Are traditional estimators still relevant with modern telemetry technology? Philosophical Transactions of The Royal Society b-Biological Science, 365: 2221-2231.
Knapp, C., Owens, A.K. (2005): An effective new radio transmitter attachment technique for lizards. Herpetol. Rev. 36: 264-266.
Kusaka, C., Valdivia, J. (2021): Methods of estimating lizard space use: A comparison of methods across species, sex, and age classes. Integr. Comp. Biol. 61: E486-e486.
Laver, P.N., Kelly, M.J. (2008): A critical review of home range studies. J. Wildl. Manage. 72: 290-298.
Li, W., Song, Y., Shi, L. (2013): Home Range of Teratoscincus Roborowskii (Gekkonidae): Influence of sex, season, and body size. Acta Ecol. Sin. 33: 395-401.
Lira, P.K., Dos Santos Fernandez, F.A. (2009): A comparison of trapping- and radiotelemetry-based estimates of home range of the Neotropical opossum Philander frenatus. Mamm. Biol. 74: 1-8.
Maher, C.R., Lott, D.F. (2000): A review of ecological determinants of territoriality within vertebrate species. Am. Midl. Nat. 143: 1-29.
Mitchell, M.S., Powell, R.A. (2004): A mechanistic home range model for optimal use of spatially distributed resources. Ecol. Model. 177: 209-232.
Morrison, S.F., Biciloa, P., Harlow, P.S. (2013): Spatial ecology of the critically endangered Fijian crested iguana, Brachylophus vitiensis, in an extremely dense population: Implications for conservation. PLOS One 8: e73127.
Mysterud, A., Perez-Barberia, F.J., Gordon, I.J. (2001): The effect of season, sex and feeding style on home range area versus body mass scaling in temperate ruminants. Oecologia 127: 30-39.
Noonan, M.J., Tucker, M.A., Fleming, C.H. (2019): A comprehensive analysis of autocorrelation and bias in home range estimation. Ecol. Monogr. 89: e01344.
Nunn, C.L., Barton, R.A. (2000): Allometric slopes and independent contrasts: A comparative test of Kleiber’s Law in primate ranging patterns. Am. J. Phys. Anthropol. 156: 519-533.
Payne, E., Spiegel, O., Sinn, D.L. (2022): Intrinsic traits, social context, and local environment shape home range size and fidelity of sleepy lizards. Ecol. Monogr. 92: e1519.
Perry, G., Garland, T. (2002): Lizard home ranges revisited: Effects of sex, body size, diet, habitat, and phylogeny. Ecology 83: 1870-1885.
Powell, G.L., Russell, A.P. (1985): Growth and sexual size dimorphism in Alberta populations of the eastern short-horned lizard, Phrynosoma-douglassi-brevirostre. Can. J. Zool. 63: 139-154.
Powell, R.A. (2000): Animal home ranges and territories and home range estimators. Res. Tech. Anim. Ecol. 442: 65-110.
Powell, R.A., Mitchell, M.S. (2012): What is a home range? J. Mammal. 93: 948-958.
Renet, J., Dokhelar, T., Thirion, F. (2022): Spatial pattern and shelter distribution of the ocellated lizard (Timon lepidus) in two distinct Mediterranean habitats. Amphib. Reptil. 43: 263-276.
Ryberg, W.A., Garrett, T.B., Adams, C.S. (2019): Life in the thornscrub: Movement, home range, and territorialityof the reticulate collared lizard (Crotaphytus reticulatus). J. Nat. Hist. 53: 1707-1719.
Salido, C.A., Vicente, N.S. (2019): Sex and refuge distance influence escape decision in a Liolaemus lizard when it is approached by a terrestrial predator. Behaviour 156: 909-925.
Schoener, T.W. (1968): Sizes of feeding territories among birds. Ecology 49: 123.
Seaman, D.E., Millspaugh, J.J., Kernohan, B.J. (1999): Effects of sample size on Kernel home range estimates. J. Wildl. Manage. 63: 739-747.
Seaman, D.E., Powell, R.A. (1996): An evaluation of the accuracy of Kernel density estimators for home range analysis. Ecology 77: 2075-2085.
Sillero, N., Dos Santos, T.A.C. (2021): Ecological niche models improve home range estimations. J. Zool. 313: 145-157.
Silverman, B.W. (1986): Density estimation for statistics and data analysis. Chapman & Hall, London.
Stamps, J.A., Krishnan, V.V. (1994): Territory acquisition in lizards. 1. First encounters. Anim. Behav. 47: 1375-1385.
Team, R.C. (2019): A language and environment for statistical computing. r foundation for statistical computing. Vienna, Austria.
Tisell, H.B., Degrassi, A.L., Stephens, R.B., (2019): Influence of field technique, density, and sex on home range and overlap of the Southern red-backed vole (Myodes Gapperi). Can. J. Zool. 97: 1101-1108.
Turner, F.B., Jennrich, R.I., Weintraub, J.D. (1969): Home ranges and body size of lizards. Ecology 50: 1076.
Utsumi, K., Staley, C., Nunez, H. (2022): The social system of the lava lizard, Microlophus atacamensis: The interplay between social structure and social organization. Rev. Chil. Hist. Nat. 95: 2-13.
Ventura, S., Vaclav, A., Pinheiro, L. (2022): Habitat suitability or female availability? What influences males’ home-range size in a Neotropical montane lizard? Can. J. Zool. 101: 57-64
Verwaijen, D., Van Darnme, R. (2008): Wide home ranges for widely foraging lizards. Zoology 111: 37-47.
Warner, D.A., Shine, R. (2008): Maternal nest-site choice in a lizard with temperature-dependent sex determination. Anim. Behav. 75: 861-870.
Williams, H.J., Taylor, L.A., Benhamou, S. (2020): Optimizing the use of biologgers for movement ecology Research. J. Anim. Ecol. 89: 186-206.
Worton, B.J. (1995): Using Monte-Carlo simulation to evaluate Kernel-based home-range estimators. J. Wildl. Manage. 59: 794-800.
Zhao, X.L., Yu, W., Zhu, Z.Y. (2022): Factors influencing home ranges of the Qinghai toad-headed lizard (Phrynocephalus vlangalii) on the Dangjin Mountain, Gansu. Asian Herpetol. Res. 13: 137-144.
Zhong, Y.X., Chen, C.W., Wang, Y.P. (2021): Biological and extrinsic correlates of extinction risk in Chinese lizards. Curr. Zool. 68: 285-293.