https://doi.org/10.36253/a_h-18890
Submitted on: 2025, 18th October; revised on: 2025, 12th December; accepted on: 2026, 12th January
Validation of the post-hoc method to estimate snout-vent length in the order Caudata
1 Dipartimento di Medicina clinica, Sanità pubblica, Scienze della Vita e dell’Ambiente (MeSVA), Università degli Studi dell’Aquila, L’Aquila, Italy
2 Graduate School of Human and Environmental Studies, Kyoto University, Yoshida Nihonmatsu-cho, Sakyo, Kyoto, Japan
*Corresponding author. Email: si.marzocca@gmail.com
Abstract. Amphibians are the most endangered class of vertebrates, with a high rate of decline recorded since the 20th century. Even activities related to the study of these animals, for instance, handling them to collect individual biometric parameters, can have negative effects on amphibian health. A post hoc method for estimating snout-vent length from dorsal photographs has been developed to reduce handling time and stress for individuals, thereby improving precision and repeatability of measurements. However, to date, this methodology has been tested on only approximately 1% of known salamanders, thereby limiting its broad applicability. Here, we tested this method on a diverse sample of Caudata comprising 25 species across 5 families, characterized by diverse morphologies. The correlation between predicted SVL (estimated from dorsal photographs) and observed SVL (measured directly from ventral photographs) values was assessed using Linear Mixed Models. The results showed a significant correlation between observed and predicted SVL, with an average and constant discrepancy of approximately 1.6 mm. When considering the increase of SVL, there was a slight tendency to underestimate SVLe in newts, plethodontids, and proteids. Estimation errors slightly increased with the SVL. The error increased in larger newts, while decreased in larger plethodontids. Our study highlighted the reliability and applicability of adopting this methodology for data collection in all Caudata species.
Keywords. SVL, measure, post-hoc method, salamander, Urodela, photograph, dorsal.
Contents
Amphibians are the most endangered class of vertebrates, with a dramatically increased rate of decline recorded over recent decades (Blaustein et al., 1994; Houlahan et al., 2000; Stuart et al., 2004). Due to their physical and physiological sensitivity, even a well-intentioned human activity like handling them for research purposes can have negative effects on amphibians’ health (Huber et al., 2019). Handling individuals is often essential in field data collection, allowing researchers to gather biometric parameters from captured individuals. However, if precautions are not taken, handling amphibians can facilitate the direct transfer of pathogens (Mendez et al., 2008; Phillott et al., 2010). A less appreciated, yet concerning effect of handling is the induction of high stress in wildlife (Huber et al., 2019). For example, individual handling can cause high stress that might contribute to altering their behaviour (Bliley and Woodley, 2012; Woodley and Porter, 2015) and physiology (Mostl and Palme, 2002; Caipang et al., 2014), having important cascading negative effects on their biology and consistently increasing their susceptibility to environmental threats (Bliley and Woodley, 2012; Woodley and Porter, 2015; Karaer et al., 2023). Even brief manipulations can significantly alter their internal temperature (Lunghi et al., 2016) and compromise their immune defences, which increases their exposure to highly virulent pathogens (Raffel et al., 2006, Gabor et al., 2015).
Measuring amphibians in the field is not always trivial: their wet, slippery skin significantly reduces grip during handling, and this effect is further enhanced when individuals struggle (Lunghi et al., 2022). This can prolong the handling time and reduce measurement precision. Some approaches have been developed to potentially address these issues (Barzaghi et al., 2025). Tools like the “Mander Masher”, the “Salamander stick” and the “Modified Salamander stick” helped researchers to increase the precision of recorded data (Wise and Buchanan, 1992; Walston and Mullin, 2005; Margenau et al., 2018); however, no concerns were raised about the possibility of also reducing individual stress. In recent years, the use of digital images has significantly improved data quality and animal safety (Mott et al., 2010; Speybroeck and Steenhoudt, 2017; Lunghi et al., 2020a). An example is the post-hoc estimation of the length, that involves using a digital camera to take photographs of individuals in the field, which are then processed in the lab to extrapolate multiple measurements using a standard reference (Lowe and McPeek, 2012; Lunghi et al., 2021; Cialente et al., 2025). With this technique, animal handling is limited to positioning the individual on a specific surface, with no further contact (Lunghi et al., 2021). This not only reduces handling time and the stress placed on individuals (Lunghi et al., 2016) but also lowers measurement error rate, enabling the collection of endless measurements for each individual (Lunghi et al., 2020a). The reduction of these issues is achieved because high-quality photos, even when taken dorsally, allow estimation of an important parameter hidden from view, for example the snout-vent length (SVL) (Mott et al., 2010; Lunghi et al., 2020a; Lunghi et al., 2022). The reliability of the post-hoc method to estimate SVL has been tested only on approximately 1% of the salamander species known to science (Mott et al., 2010; Lowe and McPeek, 2012; Lunghi et al., 2020a; Lunghi et al., 2022), and it requires further validation to be widely employed in studies on Caudata.
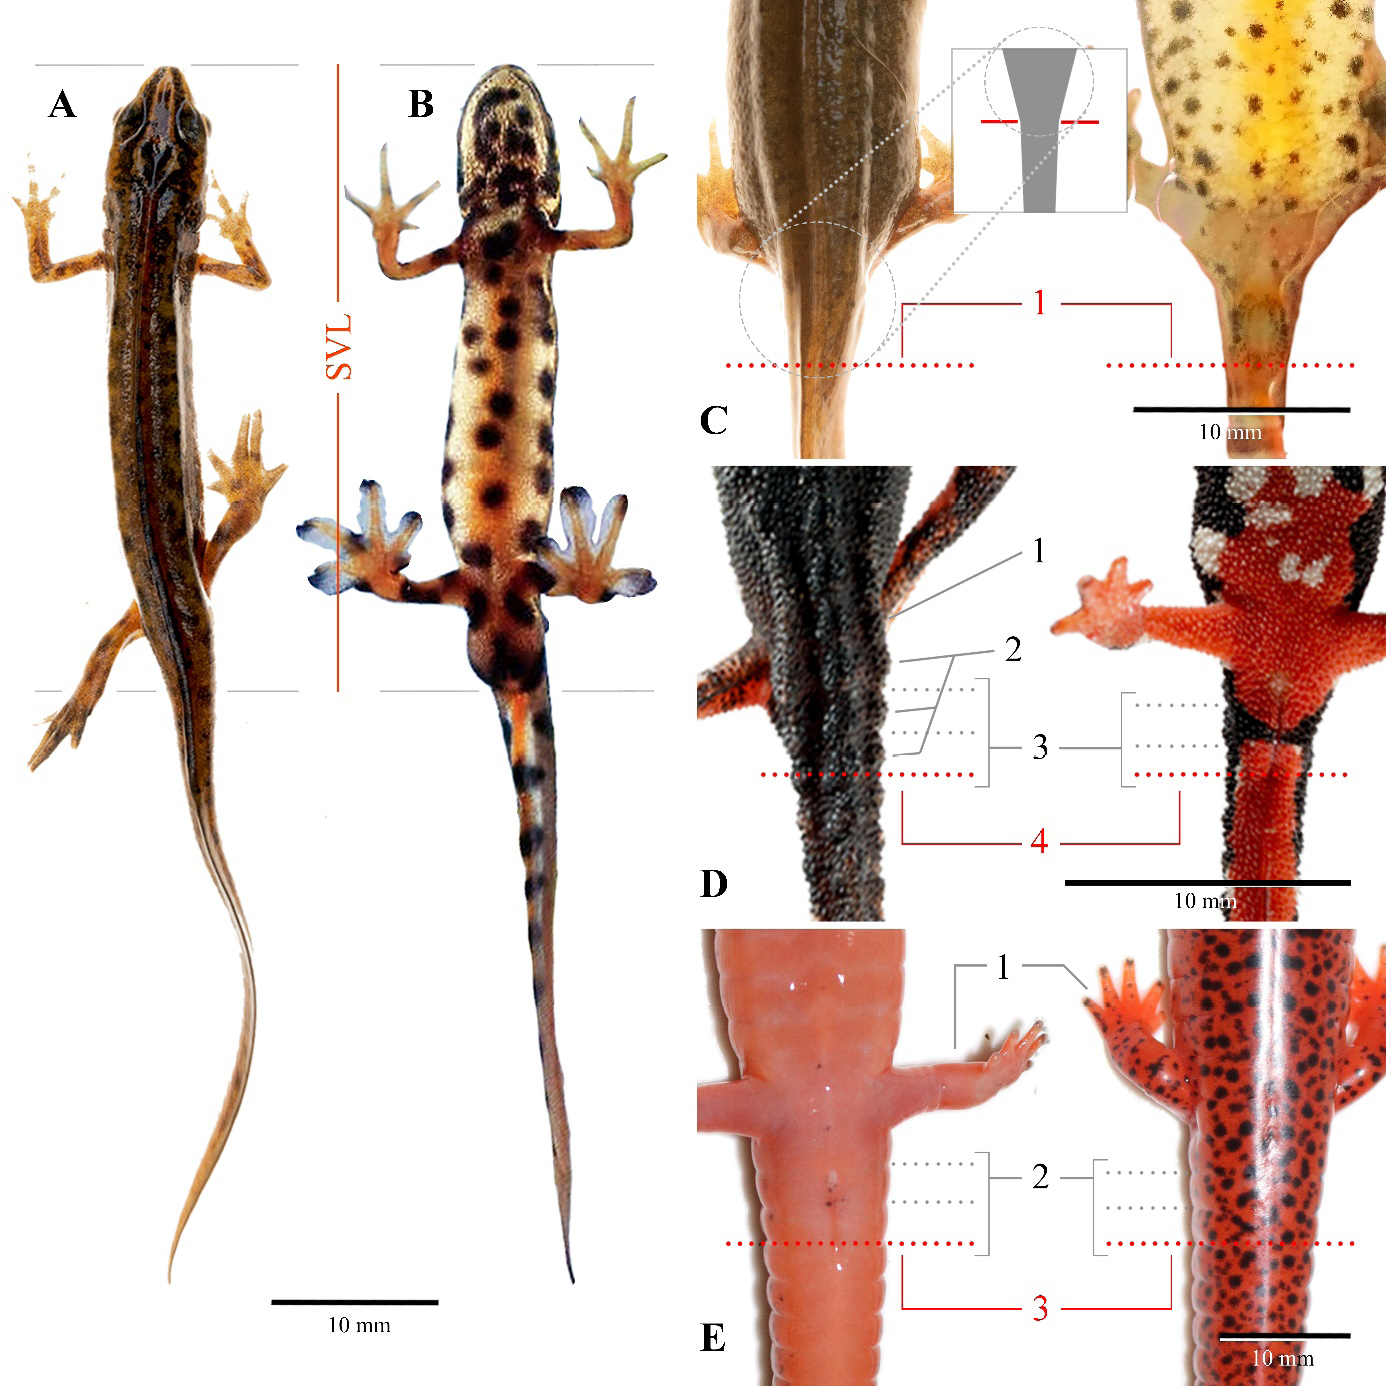
The aim of this study was to evaluate the reliability of the SVL post-hoc estimation on different species of Caudata, giving particular emphasis on testing the methodology on morphologically distinct groups of species. We constructed a dataset of high-quality photographs including 569 individuals belonging to 25 different species (on average, 22.76 ± 13.58 individuals per species). We identified five functional groups based on the general body shape of individuals: Amphiumids/Sirenids (including the genus Amphiuma and Siren), Newts (genus Ichthyosaura, Lissotriton, Notophthalmus, Triturus), Plethodontids (genus Aneides, Desmognathus, Eurycea, Gyrinophilus, Plethodon, Pseudotriton, Stereochilus), Salamanders (genus Ambystoma and Salamandrina), Proteids (genus Necturus). The photographs were obtained with the procedure described in (Lunghi et al., 2020b); captured individuals were placed next to a reference scale on a white flat horizontal surface and dorsal photographs were taken perpendicularly (Fig. 1A). Ventral photographs of the same individuals were also taken following the same procedure (Fig. 1B). Measurements were taken to the nearest mm using the program ImageJ (Troscianko and Stevens, 2015). First, SVL was measured by a single operator for each individual using a photograph of the ventral aspect. Then, for the same individuals, four operators estimated the SVL from the dorsal photographs (hereafter, SVLe), obtaining a repetition of four measurements for each individual. The landmark used to measure SVL is the cloaca, located between the hindlimbs and the tail. This area is demarcated in almost all salamander species by a conical frustum shape from a dorsal view, that narrows from the hind legs to the tail base (Fig. 1C). The posterior opening of the cloaca is placed among an imaginary line that delimits the end of the frustum from the base of the tail (Fig. 1C). In the genus Salamandrina additional landmarks can help to locate the cloaca. Vertebrae and ribs are well visible from the dorsal view, and the posterior opening of the cloaca corresponds perfectly to the intervertebral sulcus after the third caudosacral vertebra and ribs (Fig. 1D). In some species belonging to the Plethodontidae family (e.g., Pseudotriton spp., Gyrinophilus spp.) the shape of the frustum is not always visible, due to the width of their robust tail. In these cases, the third fold behind the hindlimbs can be used as landmark to establish the correct position of the posterior end of the cloaca (Lunghi et al., 2020a) (Fig. 1E). Dorsal photographs were provided to the operators without any additional information to ensure unbiased measurements (MacCoun and Perlmutter, 2015).
We used Linear Mixed Models (LMMs) (package nlme; Pinheiro et al., 2016; R Development Core Team, 2023) to assess the potential relationship between SVL and SVLe. The SVLe was used as the dependent variable, while the mean-centered SVL was used as an independent variable. We added the morpho-group of the analysed species (hereafter: group) as a further independent variable to evaluate whether this trait may affect the precision of SVL estimation. The interaction between SVL and groups was added as an additional factor. The identity of operators and the species were assigned as random variables. Considering the possibility of non-constant variance of the error associated with both predictors, we fitted an extended model using a combination of a power variance function (SVL, continuous variable) and a variance identity structure (group, categorical variable). The comparison between the four models was performed using a likelihood ratio test (Lewis et al., 2011) and the Akaike information criteria (AIC). Likelihood ratio tests were also used to evaluate the significance of the best model terms. Additionally, marginal (R²m) and conditional (R²c) coefficients of determination were calculated (Bartoń, 2016). We then calculated the standardized squared residuals to explore the potential effects of observed SVL and groups. We performed an additional LMM to assess the model’s goodness of fit and to examine the variability of squared residuals in relation to the fixed variables (SVL and groups). In this case, we used the squared residuals as the dependent variable, while the other fixed and random variables remained constant (see above: full model).
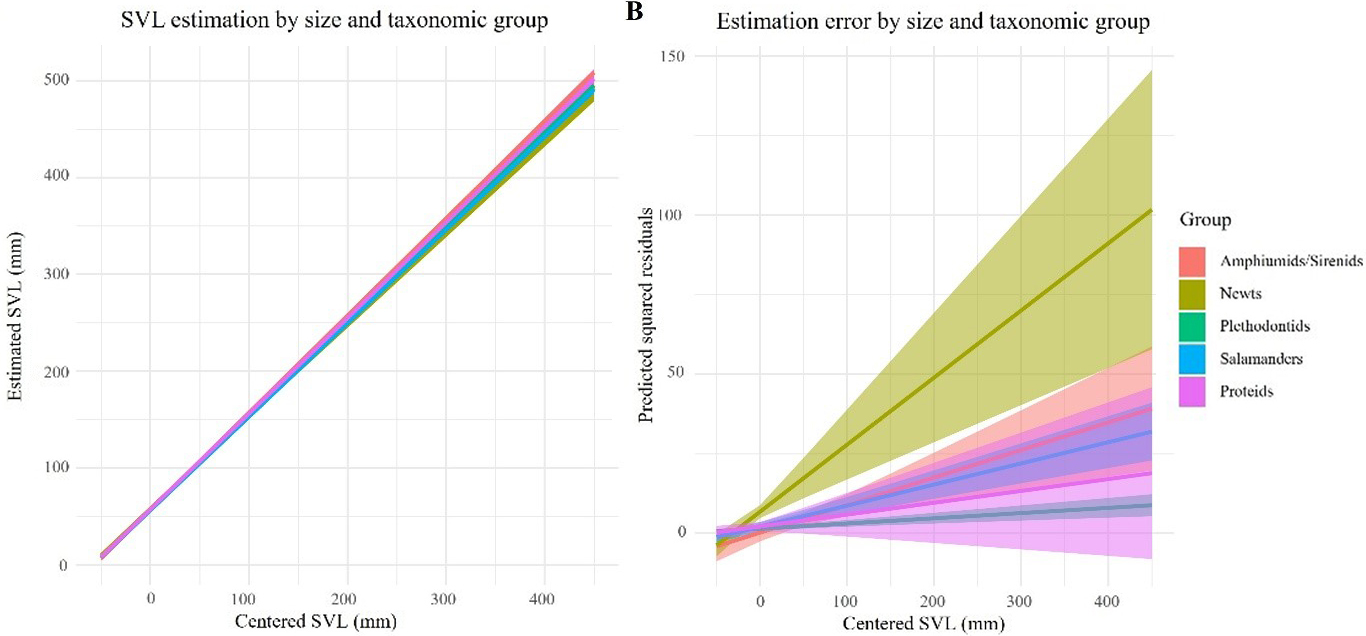
The results of the model comparison are shown in Table 1. The full model, including the power variance function and the variance identity structure, showed the lowest AIC (8144.837), suggesting that including heteroscedasticity significantly improved the model fit. We identified a significant correlation between the estimated (SVLe) and the centered SVL (F1, 2171 = 272520.50, P < 0.001), while no effect was observed for the group (F4, 20 = 1.76, P = 0.177) (Table 2). A significant effect was observed for the interaction between the SVL and the group (F4,2171 = 11.25, P < 0.001). The slope of the regression line was approximately 1.00 (β = 1.003, P < 0.001), indicating that operators’ estimates closely resembled the real SVL. However, we observed significant variability in the estimation accuracy between the studied groups of amphibians. In three of them, newts (β = –0.038, P = 0.018), plethodontids (β = –0.029, P < 0.001), and proteids (β = –0.038, P < 0.001), there was a slight tendency to underestimate body length in larger individuals (Fig. 2A). This pattern was not significant in Salamanders (β = –0.016, P = 0.171). Residual variability slightly increases with increasing body size (0.82). Considering the residual variability among groups, there was high heterogeneity in the estimation of SVL for newts (1.32), while for plethodontids the estimations were more consistent (0.68). The model explained the overall variance in the dependent variables accounting for 99.83% of the variance (R²m = 0.998). The inclusion of random effects further increased the overall model explanation to 99.99% (R²c = 0.999). The coefficient for SVL (0.978) indicates that the estimation of SVL was highly reliable, with a slight underestimation of the real values. The discrepancy between observed and predicted SVL (RMSE) was ~ 1.6 mm. The squared residuals were significantly correlated to SVL (F1, 2171 = 58.78, P < 0.001) and to the interaction between SVL and group (F4,21791 = 11.35, P < 0.001); no effect of the single variable group was observed (F4, 20 = 2.47, P = 0.078). The estimation error generally increased in larger individuals (β = 0.087, P < 0.001). However, we observed specific patterns in two groups: when SVL increased, the error increased more quickly in newts compared to other groups (β = 0.124, P = 0.021), while the opposite occurred in plethodontids (β = -0.07, P = 0.004) (Fig. 2B). Residual error increases markedly with body size (1.6) and, among groups, newts showed the highest estimation error heterogeneity (2.30). The model explained a large proportion of the overall variance in the dependent variables (88.96%, R²m = 0.889), and this explained variance increased to 99.99% (R²c = 0.999) after the inclusion of random effects.
| Model | df | AIC | BIC | logLik | Test | L.Ratio | p-value |
|---|---|---|---|---|---|---|---|
| basic | 13 | 8993.433 | 9067.869 | -4483.717 | |||
| full | 18 | 8144.837 | 8247.901 | -4054.418 | 1 vs 2 | 858.597 | <0.001 |
| var_SVL | 14 | 8456.582 | 8536.743 | -4214.291 | 2 vs 3 | 319.745 | <0.001 |
| var_Group | 17 | 8493.228 | 8590567 | -4229.614 | 3 vs 4 | 30.646 | <0.001 |
| Value | Std.Error | DF | t-value | p-value | |
|---|---|---|---|---|---|
| A) Model related to SVLe | |||||
| (Intercept) | 56.710 | 0.828 | 2171 | 68.510 | < 0.001 |
| centered_SVL | 1.003 | 0.004 | 2171 | 228.280 | < 0.001 |
| Group_Newts | 1.274 | 1.038 | 20 | 1.230 | 0.234 |
| Group_Plethodontids | -0.165 | 0.912 | 20 | -0.181 | 0.858 |
| Group_Proteids | -0.206 | 1.134 | 20 | -0.181 | 0.858 |
| Group_Salamanders | 0.642 | 1.006 | 20 | 0.638 | 0.530 |
| centered_SVL*Group_Newts | -0.038 | 0.016 | 2171 | -2.360 | 0.018 |
| centered_SVL*Group_Plethodontids | -0.029 | 0.005 | 2171 | -5.663 | < 0.001 |
| centered_SVL*Group_Proteids | -0.038 | 0.006 | 2171 | -6.188 | < 0.001 |
| centered_SVL*Group_Salamanders | -0.016 | 0.011 | 2171 | -1.367 | 0.171 |
| B) Model related to error estimations | |||||
| (Intercept) | 0.208 | 1.392 | 2171 | 0.149 | 0.881 |
| centered_SVL | 0.087 | 0.024 | 2171 | 3.592 | < 0.001 |
| Group_Newts | 6.581 | 1.738 | 20 | 3.787 | 0.001 |
| Group_Plethodontids | 1.295 | 1.432 | 20 | 0.904 | 0.377 |
| Group_Proteids | 1.869 | 1.591 | 20 | 1.174 | 0.254 |
| Group_Salamanders | 1.962 | 1.570 | 20 | 1.250 | 0.226 |
| centered_SVL*Group_Newts | 0.124 | 0.054 | 2171 | 2.310 | 0.021 |
| centered_SVL*Group_Plethodontids | -0.070 | 0.024 | 2171 | -2.880 | 0.004 |
| centered_SVL*Group_Proteids | -0.020 | 0.026 | 2171 | -0.778 | 0.437 |
| centered_SVL*Group_Salamanders | -0.049 | 0.038 | 2171 | -1.299 | 0.194 |
Our study demonstrated the high reliability of this method for measuring SVL from dorsal photographs in Caudata species. Ventral SVL values were generally well retrieved by our dorsal measurements, regardless of the species analysed or the operator performing the measurements. The inclusion of morphologically distinct amphibian groups allowed us to test the robustness of this method across species and families characterized by different body shapes and sizes. Notably, the average estimated error remained remarkably low (1.6 mm), indicating a high level of measurement precision of this method as previously reported (Lunghi et al., 2020a). Some differences in accuracy were detected between groups. A slight increase in error estimation was observed in large newts, whereas higher precision was observed in larger plethodontids. However, these variations were minor and did not compromise the overall reliability of the approach.
Our study demonstrates that this method can be widely adopted to estimate SVL across all Caudata species. This can be particularly important in long-term monitoring, where populations are sampled repeatedly over extended periods, and where excessive, repeated handling could impose significant stress and adverse effects on population health. Another important feature of this method is its ease of application, especially in field data collection. It enables enhancing the contribution of citizen science by providing useful data using only a camera and a scale reference (e.g., a ruler). However, photos must be taken using appropriate precautions and methods (e.g., perpendicular framing, sufficient lighting) to obtain material of sufficient quality. Furthermore, attention must be paid to photographing only animals that are still and relaxed to obtain the best subjects for post-hoc measurements. Data obtained from species not included in our dataset (e.g., Asiatic species) can be used to further test its reliability and broad applicability. By using this approach, we have not only provided researchers with a tool to enhance data collection quality but also identified a method that likely reduces stress on salamanders collected during field studies.
Acknowledgments
This project was funded by the Italian Ministry of University with the program European Union – Next Generation EU, PRIN2022 PNRR; project code P2022CYF9L, METALCAVE, CUP E53D23015380001, and by Biodiversa+, the European Biodiversity Partnership, in the context of the Sub-BioMon - Developing and testing approaches to monitor subterranean biodiversity in karst project under the 2022-2023 BiodivMon joint call. It was co-funded by the European Commission (GA N°101052342) and the following funding organisations: Ministry of Higher Education, Science and Innovation (Slovenia), The Belgian Science Policy (Belgium), Ministry of Universities and Research (Italy), National Research, Development and Innovation Office (Hungary), Executive Agency for Higher Education, Research, Development and Innovation Funding (Romania) and self-financing partner National Museum of Natural History Luxembourg (Luxembourg). The study was authorized by the Italian Ministry of Environment (PNM 24020, on 8th February 2024).
REFERENCES
Bartoń, K. (2016): MuMIn: Multi-Model Inference. R package version 1.15.6.
Barzaghi, B., Grassi, G., Creanza, T., Gajdošová, M., Zampieri, V., Lapadula, S., Galbiati, M., Balázs, G., Borgatti, D., Balestra, V., Messina, V., Mauri, E., FIcetola, G.F., Manenti, R. (2026): Understanding benefits and risks of exploiting spring habitats by subterranean animals: Insights from a mark-recapture study on the olm (Proteus anguinus). Hydrobiologia 853: 1273-1288.
Blaustein, A.R., Wake, D.B., Sousa, W.P. (1994): Amphibian declines: Judging stability, persistence, and susceptibility of populations to local and global extinctions. Conserv. Biol. 8: 60-71.
Bliley, J.M., Woodley, S.K. (2012): The effects of repeated handling and corticosterone treatment on behavior in an amphibian (Ocoee salamander: Desmognathus ocoee). Physiol. Behav. 105: 1132-1139.
Caipang, C.M.A., Fatira, E., Lazado, C.C., Pavlidis, M. (2014): Short-term handling stress affects the humoral immune responses of juvenile Atlantic cod, Gadus morhua. Aquac. Int. 22: 1283-1293.
Cialente, E., Oetken, B., Coppari, L., Lunghi, E. (2025): Estimation of the body condition of European cave salamanders (genus Speleomantes) from digital images. Acta Herpetol. 20: 69-74.
Gabor, C.R., Fisher, M.C., Bosch, J. (2015): Elevated corticosterone levels and changes in amphibian behavior are associated with Batrachochytrium dendrobatidis (bd) infection and bd lineage. PLOS One 10: e0122685.
Houlahan, J.E., Findlay, C.S., Schmidt, B.R., Meyer, A.H., Kuzmin, S.L. (2000): Quantitative evidence for global amphibian population declines. Nature 404: 752-755.
Huber, N., Marasco, V., Painer, J., Vetter, S.G., Göritz, F., Kaczensky, P., Walzer, C. (2019): Leukocyte coping capacity: An integrative parameter for wildlife welfare within conservation interventions. Front. Vet. Sci. 6: 105.
Karaer, M.C., Čebulj-Kadunc, N., Snoj, T. (2023): Stress in wildlife: Comparison of the stress response among domestic, captive, and free-ranging animals. Front. Vet. Sci. 10: 1167016.
Lewis, F., Butler, A., Gilbert, L. (2011): A unified approach to model selection using the likelihood ratio test. Methods Ecol. Evol. 2: 155-162.
Lowe, W.H., McPeek, M.A. (2012): Can natural selection maintain long-distance dispersal? Insight from a stream salamander system. Ecol. Evol. 26: 11-24.
Lunghi, E., Bacci, F., Zhao, Y. (2021): How can we record reliable information on animal colouration in the wild? Diversity 13: 356.
Lunghi, E., Biaggini, M., Corti, C. (2022): Reliability of the post-hoc measurement on Salamandra salamandra. Nat. Sicil. S. IV, XLVI: 223-228.
Lunghi, E., Giachello, S., Manenti, R., Zhao, Y., Corti, C., Ficetola, G.F., Bradley, J.G. (2020a): The post hoc measurement as a safe and reliable method to age and size plethodontid salamanders. Ecol. Evol. 10: 11111-11116.
Lunghi, E., Giachello, S., Zhao, Y., Corti, C., Ficetola, G.F., Manenti, R. (2020b): Photographic database of the European cave salamanders, genus Hydromantes. Sci. Data 7: 171.
Lunghi, E., Manenti, R., Canciani, G., Scarì, G., Pennati, R., Ficetola, G.F. (2016): Thermal equilibrium and temperature differences among body regions in European plethodontid salamanders. J. Therm. Biol. 60: 79-85.
MacCoun, R., Perlmutter, S. (2015): Blind analysis: Hide results to seek the truth. Nature 526: 187-189.
Margenau, E.I., Crayton, S.M., Rucker, I.E., Jacobsen, C.D., Brown, D.J. (2018): Modified salamander stick to facilitate accurate measurement of small individuals. Herpetol. Rev. 49: 243-246.
Mendez, D., Webb, R., Berger, L., Speare, R. (2008): Survival of the amphibian chytrid fungus Batrachochytrium dendrobatidis on bare hands and gloves: Hygiene implications for amphibian handling. Dis. Aquat. Organ. 82: 97-104.
Möstl, E., Palme, R. (2002): Hormones as indicators of stress. Domest. Anim. Endocrinol. 23: 67-74.
Mott, C.L., Albert, S.E., Steffen, M.A., Uzzardo, J.M. (2010): Assessment of digital image analyses for use in wildlife research. Wildl. Biol. 16: 93-100.
Phillott, A.D., Speare, R., Hines, H.B., Skerratt, L.F., Meyer, E., McDonald, K.R., Cashins, S.D., Mendez, D., Berger, L. (2010): Minimising exposure of amphibians to pathogens during field studies. Dis. Aquat. Organ. 92: 175-185.
Pinheiro, J., Bates, D., DebRoy, S., Sarkar, D., Team, R.C. (2016): nlme: Linear and Nonlinear Mixed Effects Models. R package version 3: 1-128.
R Development Core Team (2023). “R: A language and environment for statistical computing. R Foundation for Statistical Computing, Vienna, Austria. v. 4.3.2.”
Raffel, T.R., Rohr, J.R., Kiesecker, J.M., Hudson, P.J. (2006): Negative effects of changing temperature on amphibian immunity under field conditions. Funct. Ecol. 20: 819-828.
Speybroeck, J., Steenhoudt, K. (2017): A pattern-based tool for long-term, large-sample capture-markrecapture studies of fire salamanders Salamandra species (Amphibia: Urodela: Salamandridae). Acta Herpetol. 12: 55-63.
Stuart, S.N., Chanson, J.S., Cox, N.A., Young, B.E., Rodrigues, A.S.L., Fischman, D.L., Waller, R.W. (2004): Status and trends of amphibian declines and extinctions worldwide. Science 306: 1783-1786.
Troscianko, J., Stevens, M. (2015): Image calibration and analysis toolbox – a free software suite for objectivelymeasuring reflectance, colour and pattern. Methods ecol. evol. 6: 1320-1331.
Walston, L.J., Mullin, S.J. (2005): Evaluation of a new method for measuring salamanders. Herpetol. Rev. 36: 290-292.
Wise, S.E., Buchanan, S.W. (1992): An efficient method for measuring salamanders. Herpetol. Rev. 23: 56-57.
Woodley, S.K., Porter, B.A. (2015): Handling stress increases expression of male sexual behaviour in an amphibian with an explosive mating strategy. J. Zool. 298: 178-182.