Received: May 1, 2024; Accepted: June 9, 2025; Published: July 5, 2026
The importance of wooden biomass in the transition to a bioeconomy in Latvia
1 Wageningen University, the Netherlands
2 Latvia University of Life Sciences and Technologies, Latvia
*Corresponding author. Email: vineta.tetere@wur.nl
Abstract. The EU Green Deal advocates decarbonising the EU’s energy sector, largely by transitioning to renewable sources. Latvia aims to increase the share of renewable energy production in total energy production to 50% by 2030 (it was 39% in 2017), prioritising biomass from forests and wood for bioenergy. This paper evaluates increasing the tax on non-biobased energy use alongside implementing a subsidy for biobased energy use, particularly from wood biomass, to promote the substitution of the first by the latter as a step towards climate neutrality and energy self-sufficiency. Furthermore, it examines technological advancements in the bioenergy sector as an alternative instrument. Using an applied general equilibrium model and 2015 supply and use data, the study allows for substitution between domestic and imported inputs and between the non-biobased and biobased energy product. Given Latvia’s heavy reliance on imported fossil fuels, these measures could lead to a 58% increase in bioenergy production compared to 2015, reducing CO2 emissions by 0.3–1.7%, and reducing non-biobased energy imports by 2.5–4.2%.
Keywords: biobased energy, non-biobased energy, product tax, subsidy.
Index
2. Energy and forestry sectors, and policies
3.2. Taxes, subsidies, and technological change
The transition from a fossil-based economy to a biobased economy is considered a priority to mitigate the effects of climate change in the European Union (EU). The EU Green Deal states that the EU has to become climate neutral by 2050 (EC b, n.d.). This requires the EU to reduce net greenhouse gas (GHG) emissions to zero. Carbon dioxide (CO2) remains the main greenhouse gas emitted through human activities, and most CO2 emissions come from the energy sector: electricity, heating, and transport. Therefore, one of the main actions proposed in the Green Deal is to decarbonise the EU’s energy sector, largely through the transition of the generation of power from fossil-based to renewable sources. The Latvian government follows this action with the intention to increase the production of energy from renewable sources to 50% of the total energy production in 2030 (it was 39% in 2017). To achieve this goal, an emphasis will be placed on sourcing biomass from the forest and wood industry to be used for the production of biobased energy (EM, 2019). The reason for this focus is that the production and use of other renewable energy products are small. For example, in 2015 91.7% of the use of renewable energy was from biomass from forests and wood, for hydropower, this was 7.7% and for wind 0.6%.
As a reaction to the Russian invasion of Ukraine, the European Commission introduced the REPowerEU plan in March 2022 outlining measures to drastically reduce Russian gas imports and achieve independence from Russian fossil fuels before the end of the decade. The key elements in this plan are diversifying supplies, reducing demand, and increasing the production of green energy in the EU. This is expected to accelerate the green transition by reducing GHG emissions, reducing dependency on imported fossil fuels, and protecting the EU against price hikes on the energy market (EU Commission, 2022).
Economic instruments like taxes on fossil fuels and subsidies on biobased energy production or use can contribute to achieving the goals of the Green Deal and the REPowerEU plan. Since fossil fuels are non-renewable and GHG emissions are harmful to the environment, a product tax can help in reducing its demand and supply, as it increases the net price demanders pay and decreases the price suppliers receive. Product subsidies for biobased energy have the opposite effect. Moreover, product taxes and subsidies can stimulate the development and use of more sustainable technologies (Wolfson & Koopmans, 1996).
A tax on fossil energy can – in addition to the reduction in emissions – lead to an increase in welfare if it reduces the tax distortions caused by other taxes (“second best effect”). If this happens, then we speak of a ‘double dividend’ (see De Mooij, 2002 and Goulder, 1995). A potential double dividend can be an extra incentive to introduce a tax on fossil energy use.
In Latvia, the forest sector is one of the cornerstones of the economy. Forestry, wood processing and furniture manufacturing contributed 5.1% to GDP, 5.4% to total employment and 20.7% to exports in 2018 (AM - Ministry of Agriculture, 2022). Furthermore, the forest area covers 52% of the country’s territory and this is expanding. It has doubled since 1935 due to farm abandonment that resulted in the conversion of cropland fields into young forests (Fonji & Taff, 2014). The increase in forest area is expected to continue because of purposeful afforestation, as well as through the continued natural overgrowth of forest on non-agricultural lands. Moreover, wooden biomass is increasing annually due to more sustainable forest management in recent decades (Lazdiņš et al., 2019). This opens possibilities for further increase in the use of wooden biomass in the production of biobased energy.
The aim of this paper is to investigate the potential of taxes, subsidies, and technological change to increase the share of biobased energy production in Latvia. More specifically, it assesses the effect of an increase in the tax on non-biobased energy use and the implementation of a subsidy on biobased energy use, especially from wooden biomass, to facilitate the substitution of the first for the latter as a step in the transition of Latvia’s economy towards climate neutrality and self-sufficiency of energy. Moreover, the paper assesses the effects of technological change in the industry producing biobased energy. Such a technological change in the production of biobased energy is instrumental for a successful transition of the energy sector. To this end, the EU and the Latvian government will stimulate technological change as part of the Green Deal using € 4.4 billion from EU funds for Latvia between 2021 and 2027 (FM, n.d.).
The paper uses an applied general equilibrium (AGE) model based on the model developed by Komen and Peerlings (1999) to achieve the aim. Their model included greenhouse gas emissions and policy scenarios to reduce these emissions. However, it did not distinguish between non-biobased and biobased energy, nor did it include biomass. Especially in the 1980s and 1990s AGE models were used to assess different policy issues, e.g., agricultural policy reform, environmental taxation, etc. (for an overview, see Bergman, 1990; Gunning & Keyzer, 1995; Robinson, 1989). Policy issues simulated with AGE models reflect relatively large shocks to an economy, as AGE models explicitly model the economy as a whole. Calculating the effects of large shocks cannot be done using a partial equilibrium model given that these models assume too many variables (e.g. wages, interest, etc.) exogenous. The transition towards climate neutrality and energy self-sufficiency can be considered as a large shock to the Latvian economy. Data come from the supply and use tables for 2015 and national accounting data from the Latvian Central Statistics Bureau (CSB). It is assumed that a nested production structure allows for explicit imperfect substitution between domestic and imported inputs in energy production to account for Latvia’s current dependence on imported fossil fuels. By increasing the use of (domestically produced) wooden biomass in the energy sector through a tax on the use of non-biobased products and a subsidy on the use of the biobased products, the amount of CO2 emissions from fossil energy and the dependence on fossil energy imports are expected to reduce. The technological change is expected to lead to similar effects. To the best of our knowledge, this is the first application of an AGE model to Latvia and the first AGE analysis to investigate the effects of the Green Deal.
The remainder of the paper is structured as follows. Section 2 describes the energy and forestry sectors and policies of Latvia. Section 3 presents the AGE model. The data are described in Section 4. Section 5 presents and discusses the results of the model. Section 6 concludes and provides a general discussion.
2. Energy and forestry sectors, and policies
Latvia is highly dependent on imports of fossil fuels. Table 1 shows that oil products and natural gas are not produced in the country. Electricity is produced mostly domestically, partly from fossil fuels and partly from renewable energy sources.
| Product | Production | Imports | Exports | Domestic consumption | |||||||||||||||
|---|---|---|---|---|---|---|---|---|---|---|---|---|---|---|---|---|---|---|---|
| Oil products, thousand Euro1 | - | 726.56 | 145.64 | 542.4 | |||||||||||||||
| Natural gas, million Euro | - | 433.74 | 0.00 | 433.74 | |||||||||||||||
| Electricity, million Euro | 181.86 | 137.71 | 84.02 | 235.55 | |||||||||||||||
| 1 Production plus imports does not add up to domestic consumption and exports because of changes in stocks and statistical issues. | |||||||||||||||||||
| Source: CSB, 2021a, 2021b, 2021c. | |||||||||||||||||||
To meet the objectives set by the EU in the Green Deal and international commitments (see Table 2), the Latvian government drafted the National Energy and Climate Plan 2021–2030. The long-term goal of the plan is to promote the development of a climate-neutral economy in a sustainable, competitive, cost-effective, secure, and market-based way by improving energy security and public welfare. To achieve this goal, it is necessary: ‘1) To promote the efficient use of resources, as well as their self-sufficiency and diversity; 2) To ensure a significant reduction in the consumption of resources, in particular fossil and unsustainable resources, and a simultaneous transition to sustainable, renewable and innovative use of resources, ensuring equal access to energy for all sections of society; 3) To stimulate research and innovation that contributes to the development of a sustainable energy sector and the mitigation of climate change’ (EM - Ministry of Economics, 2019).
| Indicator/target | EU’s target, 2030 | Latvia’s actual value in 2017 | Latvia’s target, 2030 | Latvia’s target, 2050 | |||||||||||||||
|---|---|---|---|---|---|---|---|---|---|---|---|---|---|---|---|---|---|---|---|
| Reducing GHG emissions (% to 1990) (LULUCF* excluded) | -40 | -57 | -65 | Climate neutrality (irreducible GHG emissions are compensated by LULUCF sector) | |||||||||||||||
| Reducing GHG emissions (% to 1990) (LULUCF included) | - | - | -38 | ||||||||||||||||
| Energy produced from RES**, share of gross final consumption (%) | 32 | 39 | 50 | - | |||||||||||||||
| Share of imports in gross domestic energy consumption (%) | - | 44.1 | 30–40 | - | |||||||||||||||
| * Land Use, Land Use Change and Forestry. | |||||||||||||||||||
| ** Renewable energy sources. | |||||||||||||||||||
| Source: EM, 2019. | |||||||||||||||||||
One of the goals of the National Energy and Climate Plan is to increase the share of renewable energy sources in Latvia. The plan includes the so-called ‘tax greening’ (“polluter pays principle”), where the focus is on taxes such as excise, value added, vehicle, electricity, and natural resource taxes. However, to our knowledge, these have not been implemented by the beginning of 2025.
The transition from a fossil-based economy to a biobased economy is especially relevant for the forest sector in Latvia. The forest sector is expected to contribute to this transition through the replacement of fossil fuels and non-renewable products with forestry-based products (Kröger & Raitio, 2017). In addition to being used in the production of traditional wood-based products, such as furniture, wooden biomass is increasingly being used in energy generation and in the production of textiles, bioplastics, chemicals, and intelligent packaging, and is also contributing to the construction sector (Hetemäki et al., 2017; Hurmekoski et al., 2018).
One fifth of the forest stands in Latvia is in the age of mature and old-growth (CSB, 2021d). The CO2 sequestration capacity of old trees is relatively low, hindering the fulfilment of the Green Deal targets making them a potential feedstock to produce biobased energy.
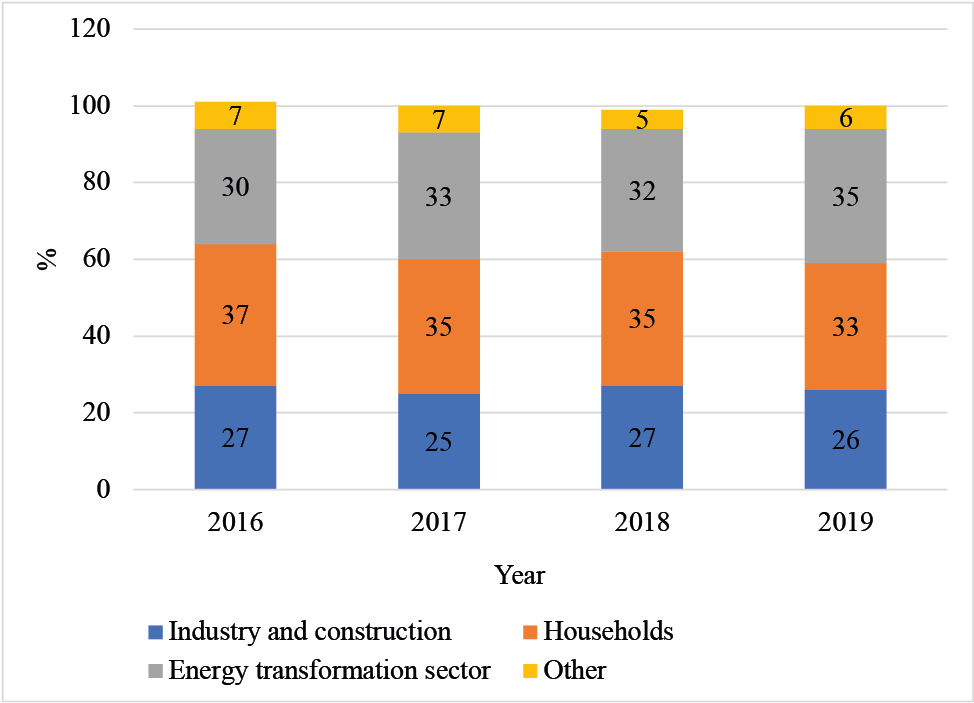
According to data from the EU Bioeconomy Monitoring System Dashboard (EC, n.d.), 58.5% of wooden biomass in Latvia is used in the production of bioenergy and 41.5% is used as materials in manufacturing in 2015. The largest share of wooden biomass in energy production was taken by firewood (30% of the total consumption of energy sources) in 2018, followed by briquettes, pellets, wood scraps, and wood chips. The largest consumers of wooden biomass are households followed by the energy transformation sector (Figure 1).
This section describes the AGE model developed and applied in this paper. The model is based on the model of Komen and Peerlings (1999). Their model included greenhouse gas emissions and policy scenarios to reduce these emissions. However, it did not distinguish between non-biobased and biobased energy. We present the model in Section 3.1 and discuss the modelling of taxes, subsidies, and technological change in section 3.2. A full description can be found in Appendix A.
An AGE model describes an economy as a whole and is therefore useful to analyse large shocks to the economy that affect, through market linkages, all the economy’s actors (i.e. industries, households, government). It mainly consists of demand and supply functions of commodities and factor inputs, and income formation and distribution equations (Dervis et al., 1982). The developed model contains 60 commodities and 60 industries including both a non-biobased and biobased energy commodity and industry. However, one industry can produce more than one commodity, and one commodity can be produced by more than one industry. Industries are assumed to minimise costs as they face a constant returns to scale nested Constant Elasticity of Substitution (CES) production function (see, e.g. Arrow et al., 1961; Sato, 1967).
Figure 2 shows that for industry b, the intermediate energy intermediate inputs ( ), material intermediate inputs ( ) and primary inputs ( ) are aggregated into 3 aggregate inputs respectively. This is done using 3 CES functions, each with their own substitution elasticity. The aggregate inputs are then aggregated into an aggregate output ( ) using a CES function with again its own substitution elasticity. The aggregated output is then divided into different outputs ( ) using a Leontief transformation function (i.e., using fixed ratios).
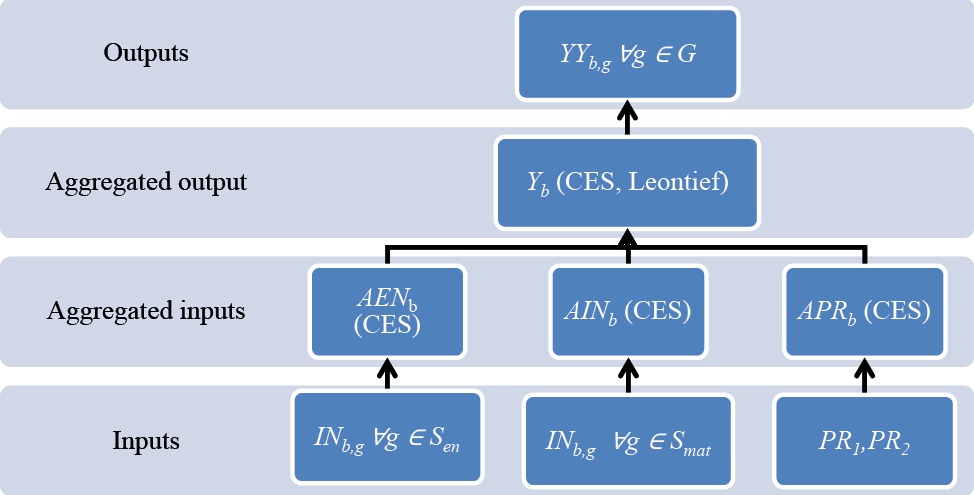
At the highest level, outputs are produced by an aggregate energy input, an aggregate intermediate input, and an aggregate factor input. At the lowest level, the aggregate energy input is composed of a biobased and a non-biobased energy input. The aggregate intermediate input is composed of 58 non-energy intermediate inputs. The aggregate factor input is composed of labour and capital. Cost minimisation leads to the demand for energy intermediate inputs, non-energy intermediate inputs, labour and capital.
Figure 3 shows that in the next step of the model, the outputs produced by different industries are aggregated commodity by commodity. Aggregation gives domestic production ( ) of a commodity g. Domestic production competes with imports of the same commodity ( ). This competition can be seen as an aggregation into total supply ( ) using a CES production function. The total supply is then disaggregated using a CET transformation function into domestic use ( ) and exports ( ). CES production and CET transformation functions imply that with profit maximisation relative prices determine demand and supply, respectively.
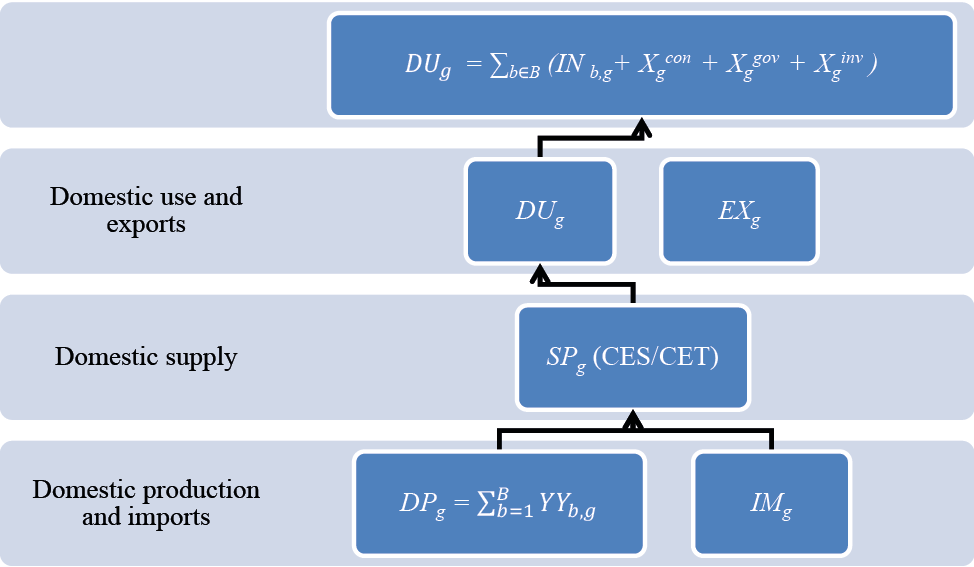
Domestic use equals the sum of intermediate demand (
, private household demand
(
), public household demand (
) and investment demand (
).
The model includes one private household that supplies labour and capital to the industries and receives income in return. Capital and labour are assumed to be imperfectly mobile between industries. We also assume one aggregated public household (i.e., government). Consumption of commodity g by the private and public household follows from maximising a CES direct utility function given an income constraint. The CES utility function used implies an income elasticity of one. In addition, as a consumer, the public household imposes taxes and redistributes income. A fixed share of both private and public household income is saved. Savings together with the (minus) surplus on the balance of trade equal investment. Investment demand is modelled using a Leontief production function implying that the demand for an individual commodity is proportional to total investment (Komen & Peerlings, 2001).
The model also includes greenhouse gas emissions that are proportionally linked to the production of an industry ( ).
3.2. Taxes, subsidies, and technological change
All transactions in the model can be potentially taxed or subsidised. Taxes can be divided into product and non-product taxes (including subsidies). The latter are levied on income, the first on transactions of commodities. Product taxes drive a price wedge between the demand and the supply price. In the model, we use ad valorem taxes on demand (see Equation 1).
(1)
A tax increases the price demanders must pay and decreases the price suppliers receive; a subsidy does the opposite.
This paper also examines the effects of Hicks neutral technological change in the biobased energy industry. Hicks neutral technological change implies that with the same level and ratio between (all) inputs, more biobased energy can be produced. Equation 2 shows a CES input demand function. In the case of a Hicks neutral technological change, the exogenous scale parameter increases. We include the Hicks neutral technological change in the aggregate demand functions (see Figure 2) of the biobased energy industry. Hicks neutral technological change implies that input demand ( ) and cost of production decrease given a level of output ceteris paribus. However, in the AGE model, the ceteris paribus assumption does not hold, as Hicks neutral technological change lowers the price of wooden biomass as less is needed to produce biobased energy, making it more attractive to demand. Therefore, technological change in the production of biobased energy leads to an increase in the demand for wooden biomass and a lower price for biobased energy. In addition, the lower price of biobased energy leads, because of substitution, to a reduction in the demand for non-biobased energy by all demanders. The degree of substitution between biobased energy and non-biobased energy depends on the degree of substitution (i.e. substitution elasticity) between both in the different industries.
n = 1,..,N(2)
where: - conditional demand for input n, - output, price of input n, - substitution elasticity, - scale parameter and - distribution coefficient of input n.
The model uses the supply and use tables (SUT) at the basic prices from Latvia`s Central Statistical Bureau for 2015 (CSB Latvia, 2016). A supply table shows in its columns the supply of commodities by the different industries and by imports in an economy for a given period. A use table shows in its columns the use of commodities by type of use. Therefore, the use table reveals in its columns the input structure of each industry and the demand for individual commodities by the different final demand categories (Eurostat, 2008). Due to a lack of data, some industries and commodities are aggregated. The data set used in modelling contains 60 commodities and 60 industries (see Appendices B and C).
Furthermore, we use Latvia’s ‘energy SUT’ in terajoules from Eurostat’s 2015 Physical Energy Flow accounts (Eurostat, 2021) with energy commodities supplied/used by industries to split commodity Electricity, gas, steam and air-conditioning of the SUT in non-biobased and biobased Electricity, gas, steam and air-conditioning, respectively. We consider energy commodities wood, wood waste and other solid biomass, liquid fuels, and biogas as biobased energy commodities. Other energy commodities are fossil-based or renewable energy sources that are not biobased. This implies, for example, that electricity and heat are non-biobased energy products, but they can be produced using both the biobased and non-biobased product.
The two energy commodities are used to calculate the shares of biobased and non-biobased energy commodities in the commodity and industry ‘Electricity, gas, steam and air-conditioning’ in the SUT, respectively. According to the data of Physical Energy Flow accounts, 7.47% of the total energy supplied and 5.88% of the total energy used comes from biobased energy commodities.
In the Base scenario, the model calculates back the actual situation of the Latvian economy in 2015. This includes a product tax of 17% for all energy commodities – biobased and non-biobased – since all energy producers pay the tax.
Scenario I
In Scenario I, we introduce an arbitrary 25% tax on non-biobased energy demand and a subsidy of 10% for biobased energy demand replacing the 17% tax on both products in the Base scenario (see Equation 1 and equations A.29-A.33 in Appendix A).
Scenario II
In Scenario II, a 25% Hicks neutral technological change in the biobased energy production industry is introduced in the Base scenario, where the scale parameter in eq. (2) is increased by 25%. This scenario reflects the technological change in new technologies producing biobased energy that is partially stimulated by government investment from EU funds. The 25% is selected because it leads to a similar increase in the production of biobased energy as in Scenario 1.
Table 3 shows the outcomes of both scenarios. It is important to note that all price changes are relative to the price numeraire chosen, which is the exchange rate in our case.
| Initial values | Scenario I: Tax and subsidy (% change) |
Scenario II: Technological change (% change) |
|||||||||||||||||
|---|---|---|---|---|---|---|---|---|---|---|---|---|---|---|---|---|---|---|---|
| Production* and value added** in million euro of the base year | |||||||||||||||||||
| Production of non-biobased energy industry ( ) | 1,766.3 | -6.0 | -1.2 | ||||||||||||||||
| Production of biobased energy industry ( ) | 110.3 | 57.8 | 57.9 | ||||||||||||||||
| Forestry production ( ) | 938.9 | -0.3 | -0.1 | ||||||||||||||||
| Value added in non-biobased energy industry ( ) | 663.6 | -2.9 | -0.8 | ||||||||||||||||
| Value added in biobased energy industry ( ) | 34.2 | 27.7 | 10.3 | ||||||||||||||||
| Value added in forestry ( ) | 352.8 | -0.2 | -0.1 | ||||||||||||||||
| Prices (index, so no unit) | |||||||||||||||||||
| Price of non-biobased energy production (price of ) | 1.00 | 1.2 | -0.8 | ||||||||||||||||
| Price of biobased energy production (price of ) | 1.00 | 9.4 | -28.1 | ||||||||||||||||
| Price of non-biobased energy demand (price of ) | 1.17 | 8.3 | -0.8 | ||||||||||||||||
| Price of biobased energy demand (price of ) | 1.17 | -16.1 | -28.8 | ||||||||||||||||
| CO2 emissions*** in 1000 tons | |||||||||||||||||||
| CO2 emissions in non-biobased energy industry | 1,757,841 | -6.0 | -1.2 | ||||||||||||||||
| Total CO2 emissions | 6,937,629 | -1.7 | -0.3 | ||||||||||||||||
| Tax revenue in million euro (nominal) | (M euro) | (M euro) | |||||||||||||||||
| Product tax paid on non-biobased energy product | 293.7 | 411.1 | 287.7 | ||||||||||||||||
| Product tax paid on biobased product | 23.7 | -21.9 | 24.5 | ||||||||||||||||
| Welfare in million euro of the base year | (M euro) | (M euro) | |||||||||||||||||
| Laspeyers index | 63.5 | 61.9 | |||||||||||||||||
| * Note: quantities are expressed in million euros for the base year 2015. This implies that initial supply prices (indices) are equal to 1; the initial price for energy demanders is equal to 1.17 due to the 17% tax on energy demand. | |||||||||||||||||||
| ** Value added equals the value of capital and labour. | |||||||||||||||||||
| *** Excluding CO2 emissions from biobased energy commodities that are assumed to be climate neutral. | |||||||||||||||||||
| Source: Authors` elaboration. | |||||||||||||||||||
Scenario I
Table 3 shows that due to the switch to the subsidy (10%) on biobased energy, its production increases with 57.8%. Table 3 also shows that due to the tax (25%) on non-biobased energy, the price of non-biobased energy increases for buyers (8.3%). Moreover, production in the non-biobased energy industry decreases (-6.0%). This leads to a reduction in the value added (-2.9%) of this industry. Non-biobased energy is substituted by biobased energy in all industries where the degree of substitution depends on the substitution elasticity between non-biobased and biobased energy. In the model, we assume that this substitution elasticity is large ( ), implying that the degree of substitution is large (see Table A3). In all industries, we see therefore a reduction in the demand of non-biobased energy and an increase in the use of biobased energy. Overall, the use of energy falls between 1-3% (a reduction of AENb; see Figure 2). The increase in biobased energy production (57.8%) leads to a reduction in imports of biobased energy products (i.e. natural gas and oil) of 4.2%, making Latvia less dependent on energy imports. However, the subsidy on non-biobased energy increases the imports of this product (64.4%). However, these imports are still very small. Table 3 shows a 1.7% reduction in CO2 emissions assuming CO2 emissions from the biobased energy product to be zero (i.e. being climate neutral). The reduction largely follows from the reduced use of non-biobased energy products (5.7%). Despite this reduction, the target of 50% energy from biobased sources is not reached.
Overall, there is a welfare gain (63.5 million euros) in Scenario I, where we measured welfare as private, public, and investment demand changes in prices of the base year. The welfare gain results from a reduction in already existing distortions by introducing the subsidy for biobased products (replacing the 17% tax) and increasing the tax on non-biobased products (from 17% to 25%). Therefore, there is a double dividend. However, whether the double dividend exists depends on the level of tax and subsidy. Sensitivity analyses show that larger taxes and subsidies create welfare losses and that especially the subsidy helps to reduce already existing distortions. Table 3 shows that the increase in tax revenue from the product-related tax on non-biobased energy production (117.4 million euro) is larger than the cost of the switch from the tax to the subsidy for the biobased product (45.6 million euro).
Scenario II
Table 3 shows that Hicks neutral technological change of 25% (Scenario II) results in a reduction in the price of biobased energy (-28.1%) and therefore, an increase in production (57.9%) and value added (10.3%) in the biobased energy industry. This leads to a substitution away from non-biobased energy and a reduction in the production (-1.2%) and value added (-0.8%) in the non-biobased energy industry. Also, in this scenario, import of the biobased energy product fall (-2.5%). The lower price of the biobased energy product decreases imports of the biobased energy product (-12.4%). Again, imports are very small. Compared to Scenario I, the reduction in CO2 emissions is smaller (0.3% versus 1.7%) because the price and production of non-biobased products changes less, and therefore, less substitution takes place. The welfare increase is similar to the welfare increase in Scenario I (61.9 million euros). This welfare gain results from the fact that fewer inputs are needed in the production of biobased energy. This shows the attractiveness of technological change. However, in this scenario, technological change is ‘free’, and this is, of course, not true.
Overall, one can conclude that the effects for the Latvian economy are not large. Important reasons for this are the fact that the biobased energy industry is small and even a large growth in production (57.8% and 57.9% in Scenario I and II respectively) does not create a substantial change. Another reason is that in the AGE model factor inputs are mobile between industries making that labour and capital moving out of industries affected negatively by the scenarios can be used elsewhere in the economy leading there to higher production and value added. Finally, the AGE model allows for substitution because of relative price change, again smoothing the effect for the economy as a whole.
This paper aims to assess the effect of a tax on non-biobased energy demand and a subsidy on biobased energy demand replacing a lower tax on both to facilitate the substitution of the first for the latter as a step in the transition of Latvia’s economy towards climate neutrality and energy self-sufficiency. Furthermore, the effects of Hicks neutral technological change in the biobased energy industry are examined. The paper uses an applied general equilibrium (AGE) model to assess the effects of a tax, subsidy, and technological change given the expected economy-wide effects and interest in national emissions and welfare.
The paper finds that a tax in combination with the subsidy indeed has the expected effects. The Green Deal proposed decarbonisation of the economy by transitioning from fossil-based to renewable sources in energy production. Latvia aims to increase the share of renewable energy production in total energy production to 50% by 2030 (it was 39% in 2017), focussing on the use of wooden biomass in energy production. According to the results of the model, the supply of the biobased energy commodity has increased by 57.8%. However, measures are insufficient to deliver the target, climate neutrality, and energy self-sufficiency. However, there is an overall welfare gain in both Scenario I and Scenario II. So, Scenario I reduces existing distortions in Latvia’s economy (i.e., double dividend). Scenario II (technological change in the biobased energy industry) leads to a similar increase in the production and use of biobased energy. Because in Scenario II the prices of non-biobased energy are affected less than in Scenario I, it`s production and use fall less leading to a lower reduction in CO2 emissions. Although the welfare gain is similar to the gain in Scenario I, Scenario II ignores the costs of technological change and does not explicitly include the incentives needed to implement it.
To our knowledge, there are no prior studies on the use of wooden biomass for bioenergy production in Latvia. While there are studies of the AGE model on energy taxes, they are not recent. For example, Komen and Peerlings (1999) analysed the effect of an energy tax on small users in the Netherlands using 1990 data. They only find a double dividend in the case of small tax rates. Goulder (1995) discusses the double dividend in more detail, coming to the same conclusion. Welfare effects found by Komen and Peerlings (1999) are also small, like in our case. This is largely due to the substitution possibilities economy-wide and fixed endowments of labour and capital in combination with factor mobility in the models used.
This study has three main caveats. First, Latvia devised an action plan in 2019, and is currently undergoing upgrading procedure, although the exact measures are largely unknown. Therefore, it is not possible to calculate the effects of actual policies. This research can contribute to the formulation of such policies. Second, data on energy use and supply are largely aggregated and had to be disaggregated for this study. This involved arbitrary choices. This emphasises the importance of data collection. Related to this, in the base year there is hardly and use of other renewable energy sources than biomass from forests and wood. Wind and solar energy are negligible, although there is some hydropower. It is to be expected that the share of wind and solar energy will grow, requiring that in future research they must be considered separate energy products. Finally, an AGE model is a powerful tool to analyse the economy-wide effects of policies but also comes at a price. For example, the level of aggregation is high, for example, it distinguishes not between, e.g. electricity and heat production. Despite these caveats, this study contributes to the discussion of the transition of the Latvia`s economy towards climate neutrality and energy self-sufficiency.
AM - Ministry of Agriculture. (2022). Latvian Forest Sector in Facts and Figures 2022. Available at: https://www.zm.gov.lv/lv/media/1722/download?attachment (Accessed 1 April 2025).
Arrow, K. J., Chenery, H. B., Minhas, B. S., & Solow, R. M. (1961). Capital-Labor Substitution and Economic Efficiency. The Review of Economics and Statistics, 43(3), 225–250.
Bergman, L. (1990). Energy and environmental constraints on growth: A CGE modeling approach. Journal of Policy Modeling, 12(4), 671–691.
CSB - Central Statistics Bureau of Latvia. (2021a). ENB010m Electricity production, imports, exports and consumption (mln. kWh). Available at: https://stat.gov.lv/en/statistics-themes/business-sectors/energy/tables/enb010m-electricity-production-imports-exports-and
CSB - Central Statistics Bureau of Latvia. (2021b). ENB020m Imports and consumption of natural gas. Available at: https://stat.gov.lv/en/statistics-themes/business-sectors/energy/tables/enb020m-imports-and-consumption-natural-gas
CSB - Central Statistics Bureau of Latvia. (2021c). ENB030m Imports, exports and consumption of oil products (thsd tonnes). Available at: https://stat.gov.lv/en/statistics-themes/business-sectors/energy/tables/enb030m-imports-exports-and-consumption-oil
CSB - Central Statistics Bureau of Latvia. (2021d). MSG040. Forest stand age structure on 1st Jaunary. Available at: https://data.stat.gov.lv/pxweb/en/OSP_OD/OSP_OD__mezsaimn__plat_mez/MSG040.px/
CSB Latvia. (2016). Gross domestic product Supply-Use and Input-Output tables. Available at: https://www.csb.gov.lv/en/statistics/statistics-by-theme/economy/GDP/IOT
De Mooij, R. A. (2002). The double dividend of an environmental tax reform. Handbook of Environmental and Resource Economics, 293–306.
Dervis, K., de Melo, J., & Robinson, S. (1982). General equilibrium models for development policy. Cambridge: Cambridge University Press.
EC - European Commission. (n.d.). EU Bioeconomy Monitoring System Dashboard. Available at: https://knowledge4policy.ec.europa.eu/bioeconomy/monitoring_en (Accessed 1 April 2025).
EC - European Commission b. (n.d.). Bioeconomy&European Green Deal. Available at: https://knowledge4policy.ec.europa.eu/bioeconomy/bioeconomy-european-green-deal_en (Accessed 15 January 2022).
EM - Ministry of Economics. (2019). National Energy and Climate Plan 2021 – 2030. Available at: https://www.em.gov.lv/lv/nacionalais-energetikas-un-klimata-plans (Accessed 1 April 2025).
EU Commission. (2022). REPowerEU: Joint European Action for more affordable, secure and sustainable energy, COM(2022) 108 final. Available at: https://eur-lex.europa.eu/legal-content/EN/TXT/?uri=COM%3A2022%3A108%3AFIN (Accessed 1 April 2025).
Eurostat. (2008). Eurostat Manual of Supply, Use and Input-Output Tables. Available at: https://ec.europa.eu/eurostat/documents/3859598/5902113/KS-RA-07-013-EN.PDF/b0b3d71e-3930-4442-94be-70b36cea9b39 (Accessed 1 April 2025).
Eurostat. (2014). Physical Energy Flow Accounts (PEFA) manual. Available at: https://ec.europa.eu/eurostat/documents/1798247/6191537/PEFA-Manual-2014-v20140515.pdf
Eurostat. (2021). Energy supply and use by NACE Rev.2 activity [env_ac_pefasu]. Available at: https://appsso.eurostat.ec.europa.eu/nui/show.do?dataset=env_ac_pefasu&lang=en
FM-Ministry of Finances. (n.d.). Valdība atbalsta 2021. – 2027. gada plānošanas perioda ES fondu vadības likumprojektu. Available at: https://www.cfla.gov.lv/lv/jaunums/valdiba-atbalsta-2021-2027-gada-planosanas-perioda-es-fondu-vadibas-likumprojektu (Accessed 1 April 2025).
Fonji, S. F., & Taff, G. N. (2014). Using satellite data to monitor land-use land-cover change in North-eastern Latvia. SpringerPlus, 3(1), 61.
Goulder, L. H. (1995), Environmental Taxation and the “Double Dividend”: A Reader’s Guide. International Tax and Public Finance 2(2), 157–183.
Gunning, J. W., & Keyzer, M. (1995). Applied general equilibrium models for policy analysis (H. Chenery & T. N. Srinivasan, Eds.). Available at: https://econpapers.repec.org/RePEc:eee:devchp:3-35 (Accessed 1 April 2025).
Hetemäki, L., Hanewinkel, M., Muys, B., Ollikainen, M., Palahí, M., Trasobares, A., … Potoćnik, J. (2017). Leading the way to a European circular bioeconomy strategy (Vol. 5). European Forest Institute. Available at: https://efi.int/sites/default/files/files/publication-bank/2018/efi_fstp_5_2017.pdf (Accessed 1 April 2025).
Hurmekoski, E., Jonsson, R., Korhonen, J., Jänis, J., Mäkinen, M., Leskinen, P., & Hetemäki, L. (2018). Diversification of the forest industries: role of new wood-based products. Canadian Journal of Forest Research, 48(12).
Komen, M.H.C.; Peerlings, J. H. M. (1999). Energy Taxes in the Netherlands: What are the Dividends? Environmental and Resource Economics, 14(2), 243–268.
Komen, M.H.C. and J.H.M. Peerlings (2001). Endogenous technology in dairy farming under environmental restrictions. European Review of Agricultural Economics 28/2: 117-142.
Kröger, M., & Raitio, K. (2017). Finnish forest policy in the era of bioeconomy: A pathway to sustainability? Forest Policy and Economics, 77, 6–15.
Latvian State Forest Research Institute Silava. (2017). INFORMATION ON LULUCF ACTIONS IN LATVIA Progress report under EU Decision 529/2013/EU Article 10, page 10 section 3. https://www.zm.gov.lv/lv/media/705/download?attachment (Accessed 1 April 2025).
Lazdiņš, A., Lupiķis, A., Butlers, A., Bārdule, A., Kārkliņa, I., Šņepsts, G., & Donis, J. (2019). Latvia’s national forest accounting plan and proposed forest reference level 2021-2025. Available at: https://www.fern.org/fileadmin/uploads/fern/Documents/NFAP_Latvia.pdf (Accessed 1 April 2025).
Robinson, S. (1989). “Multisectoral models,” Handbook of Development Economics (1st ed., Vol. 2; Hollis Chenery & T.N. Srinivasan, Ed.). Available at: https://ideas.repec.org/h/eee/devchp/2-18.html (Accessed 1 April 2025).
Sato, K. (1967). A Two-Level Constant-Elasticity-of-Substitution Production Function. The Review of Economic Studies, 34(2), 201–218.
Wolfson, D. J., & Koopmans, C. C. (1996). Regulatory taxation of fossil fuels: Theory and policy. Ecological Economics, 19(1), 55–65.