Received: November 22, 2024; Accepted: June 13, 2025; Published: December 31, 2025
Bridging the gap: the impact of compensatory measures on mountain farming in Piedmont
1 CREA PB, Turin, Italy
2 Università di Roma La Sapienza, Rome, Italy
3 Università degli Studi di Napoli Federico II, Naples, Italy
*Corresponding author. Email: francesca.moino@crea.gov.it
Abstract. This study examines the impact of the Rural Development Program (RDP) on reducing income disparities between farms in mountainous and non-mountainous areas in Piedmont, Italy. Using Farm Accounting Data Network data from 2012–2022, the analysis focuses on cattle, sheep and goats, and fruit farms, with 525 farms (3,171 observations; 36% in mountainous areas). A pooled multivariate regression assesses income disparities excluding RDP support, RDP’s effectiveness in mitigating gaps, and the role of compensatory allowance. The findings indicate that significant income disparities are primarily observed in small farms specialized in cattle and sheep and goats, with mountain farms facing a net shortfall of €1,319 and €2,384 per hectare, respectively. While compensatory allowance support helps reduce this gap – by 8.93% for cattle farms and 5.28% for sheep and goat farms – a substantial disparity remains. Bridging the gap entirely would require doubling compensatory payments to €340 per hectare, though alternative strategies are discussed.
Keywords: FADN, compensatory allowance, mountain areas, income gap.
Index
2. Data and research methodology
Mountain agriculture in Europe faces critical challenges due to the natural constraints of these regions, often classified as Areas with Natural Constraints (ANCs) under Regulation (EU) No. 1305/2013, Art. 32. Previously termed Less Favoured Areas (LFAs) under the Common Agricultural Policy (CAP), these regions face challenges such as steep slopes, adverse climates, and poorer soil fertility, which collectively restrict arable land and require labour-intensive farming practices. These limitations lead to higher production costs and reduce profitability, causing many farmers in mountainous regions to abandon agricultural activities (Giannakis & Bruggeman, 2015; Strijker, 2004). Such abandonment contributes to depopulation, economic decline, and the loss of agro-biodiversity and traditional landscapes (Cesaro & Marongiu, 2013). To counteract these adverse trends, the European Union (EU) has historically provided targeted support to ANC within the CAP framework, aiming to mitigate the biophysical disadvantages and sustain agricultural livelihoods in ANCs.
The effectiveness of ANC and LFA support measures has been widely studied, with mixed findings (Romagnoli et al., 2021). For instance, Borsotto et al. (2010) questioned the effectiveness of these subsidies across different European contexts, while Ferto et al. (2022) and Klima et al. (2020) observed heterogeneity in outcomes based on regional applications. Oxousi (2012) conducted a comparative analysis on farm performance, finding that while ANC support plays a key role in the profitability of mountain and other disadvantaged farms, mountainous farms still struggle compared to those in less favoured, but more productive, areas. Similarly, Wieliczko et al. (2018) identified significant disparities in production efficiency and economic performance between farms receiving ANC support and those that do not, indicating that while ANC payments partially help mitigate economic disadvantages, they do not fully compensate for them.
As the ANC policy evolved, the 2014–2020 Rural Development Program (RDP) introduced refined eligibility criteria to direct support toward regions with genuine biophysical constraints. ANC support remains a crucial tool for maintaining agricultural activities, preserving rural landscapes, and preventing land abandonment in vulnerable regions (Whitaker, 2024; Veveris et al., 2014). In mountainous regions, these payments significantly contribute to rural sustainability, by retaining population, enhancing business viability, and preserving environmental and territorial integrity (Cooper et al., 2006; Dax et al., 2021).
While the impact of ANC support has been widely studied, limited research has assessed its effectiveness in reducing economic disparities between mountainous and non-mountainous farms in specific regional contexts. This study aims to address this gap by analyzing the adequacy of compensatory allowance (CA) in mitigating income inequalities in mountain agriculture, focusing on the Piedmont region. Unlike previous research, which has often relied on cross-country or aggregated assessments (Poláková, 2019), this study adopts a context-specific approach using Farm Accountancy Data Network (FADN) data. By evaluating the financial resources required to ensure that compensatory measures effectively offset the economic disadvantages faced by mountain farmers, this research provides a robust policy assessment and contributes to a more precise understanding of rural development interventions (Romagnoli et al., 2021).
The choice of Piedmont, a region in northern Italy, as a case study is justified by its diverse agricultural landscape, which includes both mountain and lowland areas, allowing for a meaningful comparison between farms operating under different environmental constraints. Covering over 52% mountainous territory, Piedmont includes both the Apennine and Alpine ranges, where depopulation, agricultural abandonment, and the difficulties faced by small, isolated communities are pronounced (Ferlaino, 2019). Livestock farming, central to Piedmont’s mountainous areas, relies on limited resources and small, family-run farms, which differ substantially from lowland agriculture (ISTAT, 2020). EU programs have increasingly addressed these issues, although the region’s administrative fragmentation, characterised by numerous small municipalities, complicates local development management. This makes Piedmont a compelling case for understanding the complexities of mountain development and the critical role of targeted policies in fostering sustainability.
To properly interpret the methodology and findings, it is essential to understand the structure of the CA under the RDP, established under Regulation (EC) No. 1698/2005. During the 2007–2013 programming period, the CA was implemented through Measure 211, while in the 2014–2020 period, it was integrated into Measure 13.1, both aimed at providing direct financial support to farmers in mountainous areas to offset the economic disadvantages imposed by challenging terrain and climate conditions. Measure 13.1 allocated approximately 60 million euros annually to mountain farmers in Piedmont, succeeding Measure 211, which had provided 52.5 million euros in the previous programming period (Cagliero et al., 2018; NUVAL Piemonte, 2016). These measures play a crucial role in sustaining agriculture, supporting socio-economic stability, and preserving landscapes in disadvantaged areas (Ferlaino, 2019; Regione Piemonte, 2016). However, the CA is not automatically granted to all farmers but is subject to eligibility criteria based on land use and farm characteristics. The amount of support varies depending on the agricultural system and the level of disadvantage. Additionally, to prioritize small and medium-sized farms, payments decrease as farm size increases: farms with less than 20 hectares receive 100% of the allowance, those between 20 and 40 hectares receive 70%, those between 40 and 70 hectares receive 40%, those between 70 and 100 hectares receive 10%, while farms over 100 hectares are not eligible for support. This tiered approach reflects the strategic importance of maintaining agricultural activity in mountainous areas and ensuring that support is directed toward those most affected by structural disadvantages (Regione Piemonte, 2016).
The results of this study are specific to the Piedmont region, as they reflect the particular agricultural, economic, and policy context of this territory. While the per-hectare CA is a common feature of ANC support across the EU, its implementation varies in structure, budget allocation, and eligibility criteria, depending on national and regional regulations (e.g., differences in budget distribution, farm eligibility rules, and administrative procedures). Consequently, the findings may not be directly replicable in other regions, as variations in policy design could influence the effectiveness of CA in addressing economic disparities. However, this study offers a methodological framework that can be adapted for analyzing other mountain regions, particularly within the Alpine arc, where similar agricultural and economic constraints exist. Expanding the analysis to additional regions would facilitate a broader evaluation of ANC policy effectiveness and identify potential areas for policy refinement.
The paper is organised as follows: Section 2 presents the data and methodology, including analytical frameworks; Section 3 reports the results of the policy impact analysis; Section 4 discusses findings with an emphasis on policy implications; and Section 5 concludes, suggesting directions for future research and policy improvements.
2. Data and research methodology
The analysis is based on data from the FADN, which collects harmonized data annually, offering microeconomic insights into income trends and the structural economic dynamics of farms across Europe. For this study, we used data from the Italian survey, which includes approximately 11,000 farms each year (CREA, 2025).
From this dataset, we selected farms located in the Piedmont region with a standard output – defined as the average monetary value of agricultural products at farm-gate prices – exceeding €8,000, in order to focus on commercial farms. We further restricted the sample to those farms engaged in farming types (FT) – FADN classifications based on the relative importance of each agricultural activity within the farm – typical of the Piedmont mountainous area, specifically farms specialised in cattle, sheep and goats, and fruit production. The analysis covers a ten-year period, from 2012 to 2022.
To distinguish between farms in mountainous and non-mountainous areas, we used the receipt of the CA as a classification criterion. Farms receiving this support were classified as located in mountainous areas, while those not receiving it were considered non-mountainous. This approach was adopted since the FADN database defines farm altitude based on the farm center, which may not always correspond to the actual location of the arable land. Using CA support as a proxy provided a more reliable way to identify mountain farms. Moreover, this classification appears consistent, as available data show that, on average, 88% of the total eligible regional hectares received the payment during the years considered (Regione Piemonte, 2025). In addition, farms larger than 100 hectares were excluded from the analysis, as they are not eligible for CA payments. Including them would have led to a misclassification of their geographical location and distorted the estimation.
Based on this criterion, the final sample consists of an unbalanced panel dataset of 525 farms, resulting in a total of 3,171 observations, of which 36.14% are located in mountainous areas. Table 1 presents the distribution of the sample by FT, farm scale and geographic location. The majority of the sample comprises farms specialising in cattle, followed by those engaged in fruit production, and lastly, sheep and goat farming. Farms specialised in sheep and goats are the only group with a higher number of observations in mountainous areas compared to plains.
| Farm Scale | Cattle | Sheep and goats | Fruit | Total | |||||||||||||||
|---|---|---|---|---|---|---|---|---|---|---|---|---|---|---|---|---|---|---|---|
| Non mountain area | Small | 364 | 60 | 546 | 970 | ||||||||||||||
| Large | 853 | 21 | 181 | 1,055 | |||||||||||||||
| Mountain area | Small | 262 | 39 | 228 | 529 | ||||||||||||||
| Large | 486 | 67 | 64 | 617 | |||||||||||||||
| Total | 1,965 | 187 | 1,019 | 3,171 | |||||||||||||||
| Note: Small-scale = UAA < 20 ha; Large-scale = UAA between 20 and 100 ha. | |||||||||||||||||||
The rationale behind the CA support measure assumes that farms located in mountainous areas face a significant income disparity compared to those in non-mountainous areas. The first step of our analysis aimed to empirically test whether this income disparity exists when excluding the effects of the CA. Subsequently, we assessed the extent to which the CA narrows the income gap between mountain and non-mountain farms.
To conduct this analysis, we used a pooled multivariate regression model. This model was selected because it allows for the simultaneous estimation of the effects of several explanatory variables on multiple dependent variables over time, making it particularly suitable for unbalanced panel data such as ours (Baltagi, 2008). The analysis was structured around two key dependent variables: net income (NI) per hectare of utilized agricultural area (UAA) excluding CA support, and overall NI per hectare of UAA. This distinction enabled us to isolate the specific contribution of CA payments in narrowing income disparities.
Looking at the descriptive statistics in Table 2, we observe that, on average, the NI excluding CA support is 41.16% lower for mountain farms compared to non mountain farms. However, when considering the overall NI, the income gap narrows to 37.76%.
| Farm scale | NI excluding CA/ha | NI/ha | |||||||||||||||||
|---|---|---|---|---|---|---|---|---|---|---|---|---|---|---|---|---|---|---|---|
| Non mountain | Mountain | Non mountain | Mountain | ||||||||||||||||
| M (€) | SD | M (€) | SD | M (€) | SD | M (€) | SD | ||||||||||||
| Cattle | Small | 3,228 | 7,556 | 1,115 | 2,182 | 3,228 | 7,556 | 1,251 | 2,193 | ||||||||||
| Large | 2,310 | 2,655 | 1,140 | 1,830 | 2,310 | 2,655 | 1,251 | 1,832 | |||||||||||
| Sheep and goats | Small | 2,079 | 9,849 | 1,006 | 3,124 | 2,079 | 9,849 | 1,142 | 3,132 | ||||||||||
| Large | 355 | 356 | 793 | 1,016 | 355 | 356 | 908 | 1,047 | |||||||||||
| Fruit | Small | 4,421 | 4,826 | 4,344 | 3,985 | 4,421 | 4,826 | 4,488 | 3,992 | ||||||||||
| Large | 5,129 | 5,594 | 3,878 | 3,350 | 5,129 | 5,594 | 4,016 | 3,365 | |||||||||||
| Overall | 3,265 | 5,120 | 1,906 | 2,925 | 3,265 | 5,120 | 2,032 | 2,936 | |||||||||||
| Note: Small-scale = UAA < 20 ha; Large-scale = UAA between 20 and 100 ha. | |||||||||||||||||||
For the independent variables, we included the farm’s geographical location that distinguishes whether the farm is in a mountainous or non-mountainous area, as this is the primary focus of our study. Additionally, we considered several control variables, selected based on previous studies that identified key characteristics from the FADN database as significant determinants of farm income (Andrejovská & Glova, 2022; Kryszak et al., 2021; Ryś-Jurek, 2019; Średzińska, 2018; Strzelecka et al., 2018). These variables include a time variable to control for yearly trends, farm characteristics such as economic dimension (ED) of the farm, measured in terms of standard output, the number of farm labour units, the percentage of family labour, the hectares of UAA, the specific FT, the organic certification and some personal characteristics of the farmer such as age, gender and level of education (Table 3 and Table 4). An interaction term between FT, farm location and farm scale were included to capture any differential effects that may arise from the combination of these three factors. This approach enables us to consider how the limitations imposed by mountainous terrain may affect each FT and farm scale differently.
| Description | Unit of Measure | M | SD | |
|---|---|---|---|---|
| LU | Farm’s labour unit | n | 2.07 | 1.96 |
| FLU | Percentage of family labour | % | 92.2 | 1.97 |
| Age | Farmer’s age | n | 53.9 | 12.03 |
| Description | n | % | |
|---|---|---|---|
| ED € of Standard Output |
8,000 – 25,000 | 440 | 13.88 |
| 25,000 – 50,000 | 566 | 17.85 | |
| 50,000 - 100,000 | 773 | 24.38 | |
| 100,000 – 500,000 | 1,276 | 40.24 | |
| 500,000 – 1,000,000 | 108 | 3.41 | |
| > 1,000,000 | 8 | 0.25 | |
| Farm scale | Small (< 20 ha) | 1,499 | 47.27 |
| Large (20 to 100 ha) | 1,672 | 52.73 | |
| FT | Cattle | 1.965 | 61.97 |
| Sheep and goats | 187 | 5.97 | |
| Fruit | 1.019 | 32.13 | |
| Farm location | Non mountain area | 2,025 | 63.56 |
| Mountain area | 1,146 | 36.14 | |
| Gender | Woman | 443 | 13.97 |
| Man | 2,728 | 86.03 | |
| Diversification | Yes | 588 | 18.46 |
| No | 2,583 | 81.46 | |
| Organic | Yes | 365 | 11.51 |
| No | 2.806 | 88.49 | |
| Level of education | No formal education | 70 | 2.22 |
| Primary school | 362 | 11.46 | |
| Secondary school | 1,971 | 62.37 | |
| High school diploma | 705 | 22.31 | |
| Associate degree | 2 | 0.06 | |
| Bachelor’s degree | 50 | 1.58 | |
| Year | 2012 | 316 | 9.97 |
| 2013 | 326 | 10.28 | |
| 2014 | 316 | 9.97 | |
| 2015 | 309 | 9.74 | |
| 2016 | 314 | 9.90 | |
| 2017 | 305 | 9.62 | |
| 2018 | 304 | 9.59 | |
| 2019 | 188 | 5.93 | |
| 2020 | 186 | 5.87 | |
| 2021 | 307 | 9.68 | |
| 2022 | 300 | 9.46 |
The regression model assumes that the error terms for the two dependent variables are identical, reflecting the premise that residual farm income, after controlling for the relevant variables, should behave similarly across the two income measures. Given that the same farms are observed across multiple years, we addressed the potential issue of autocorrelation by clustering the standard errors at the farm level. This adjustment corrects for any non-independence of observations within each farm over time, enhancing the robustness of our estimates.
Additionally, we addressed selection bias through inverse probability weighting (IPW). First, we defined the propensity score as p(xi) = Pr(Wi = 1 | xi, β), where Wi is an indicator equal to 1 if a farm is a “Mountain farm” (i.e., receiving CA support) and 0 otherwise. The vector β represents the parameters, and xi is a vector of observed covariates. The propensity score reflects the probability that a farm receives CA support and is modelled as F[H(xi)], where F is typically the logistic or normal cumulative distribution function (Guo & Fraser, 2010). In this study, the propensity scores were estimated using a logit model. Inverse probability weights were then computed by taking the reciprocal of the estimated probability of the observed treatment status. For a treated unit (“Mountain farm”), the weight is 1/p(xi), while for a control unit (“Non mountain farm”) the weight is 1/(1 − p(xi)). These weights adjust for differences in covariate distributions between the two groups. Finally, the computed weights were used in the multivariate regression (see Bellon et al., 2015) to estimate the effect of being in a mountainous area on net income. This weighted regression aims to balance the sample, mimicking a randomized experiment and providing less biased estimates (Guo & Fraser, 2010).
After estimating the regression models, we conducted pairwise comparisons to identify statistically significant differences in NI between mountain and non-mountain farms across the various FT.
To further explore the specific role of the CA in reducing the income gap, we estimated the required financial magnitude of CA payment to effectively address income disparities between mountain and non-mountain farms. To achieve this, we conducted a pooled regression analysis, where the dependent variable was net income per hectare of UAA, and the independent variables included the CA payment per hectare of UAA, along with the same control variables used in the previous analysis. Using the model estimates, we calculated how the marginal increase in CA payment would affect the income of mountain farms, identifying the per-hectare payment needed to fully bridge the income gap with non-mountain farms.
The description of the variables reveals that, on average, farms in the dataset employ slightly more than two workers, with an average of 2.07 labour units (LU), and rely predominantly on family labour, which represents approximately 92.2% of the total workforce. The average age of the farm managers is 53.9 years (Table 3).
Regarding ED, the majority of farms fall into the mid-range, with 40.24% of farms classified within the ED category, having a standard output between €100,000 and €500,000 per year. Farms with a standard output between €50,000 and €100,000 represent 24.38% of the dataset, while those with an output between €25,000 and €50,000 account for 17.85%, and 13.88% fall within the €8,000–€25,000 range. Only a small proportion of farms exceed €500,000 in standard output (3.66%). In terms of farm specialisation, 61.97% of farms focus on cattle farming, 32.13% specialise in fruit production, and 5.97% are dedicated to sheep and goat farming. The majority of farms (63.56%) are located in non-mountainous areas, while 36.14% operate in mountain regions.
For farm scale, farms are classified as Small (< 20 hectares) and Large (20 to 100 hectares). This classification reflects the structure of the compensatory allowance (CA), which is granted in full to farms under 20 hectares, while farms above this threshold receive a proportionally reduced payment. The sample is nearly evenly distributed, with 47.27% of farms classified as small and 52.73% as large.
In terms of farm management, 86.03% of the farm managers are male. Farm diversification is relatively limited, with only 18.46% of farms engaged in activities beyond primary agricultural production. Similarly, organic farming is a niche practice, with only 11.51% of farms certified as organic. Education levels vary among farm managers, with 62.37% having completed secondary school, and 22.31% holding a high school diploma. A smaller proportion has attained higher education, with 1.58% holding a bachelor’s degree and 0.06% an associate degree, while 13.68% have primary or no formal education. The data spans multiple years, from 2012 to 2022, with a fairly balanced distribution of observations across these years (Table 4).
The findings from the IPW-adjusted multivariate regression model, as outlined in Table 5, show that the control variables are significant in the expected direction across the two equations. Specifically, an increase in the ED positively influences the dependent variables, as does a marginal increase of UAA. Moreover, farms specialised in fruit production scored higher on the dependent variables when compared to cattle farms. Focusing on the variable that distinguishes between farms located in mountainous areas and those not situated in mountainous areas, we observe that in the two cases the coefficient is significant and negative. This suggests that there is a gap in NI between farms located in mountainous areas and those not located in mountainous areas that the CA support is unable to bridge.
| NI excluding CA/ha | NI/ha | ||||||||||||||||||
|---|---|---|---|---|---|---|---|---|---|---|---|---|---|---|---|---|---|---|---|
| Coefficient | Robust SE | Coefficient | Robust SE | ||||||||||||||||
| Location (Mountain) | -1319.44** | 603.97 | -1201.49** | 605.79 | |||||||||||||||
| FT (vs Cattle) | |||||||||||||||||||
| Sheep & goats | 1737.47* | 1003.23 | 1741.02* | 1005.25 | |||||||||||||||
| Fruit | 2419.50*** | 883.81 | 2421.13*** | 884.60 | |||||||||||||||
| FT × Location × Farm scale | |||||||||||||||||||
| Cattle × Mountain × Large | -2080.62** | 821.62 | -2065.50** | 822.79 | |||||||||||||||
| Cattle × Mountain × Small | -832.43* | 481.14 | -867.59* | 483.10 | |||||||||||||||
| Sheep & goats × Mount × Large | -4283.34*** | 944.87 | -4282.66*** | 945.98 | |||||||||||||||
| Sheep & goats × Mount × Small | -1064.76 | 1018.55 | -1057.00 | 1022.25 | |||||||||||||||
| Sheep & goats × Non M × Small | -2620.65*** | 996.31 | -2662.57*** | 1001.69 | |||||||||||||||
| Fruit × Mountain × Large | -2069.54** | 801.21 | -2063.17** | 800.91 | |||||||||||||||
| Fruit × Mountain × Small | -1513.35 | 939.55 | -1513.56 | 947.54 | |||||||||||||||
| Fruit × Non mountain × Small | 86.07 | 927.07 | 91.64 | 930.49 | |||||||||||||||
| LU | 248.43** | 116.99 | 247.35** | 117.11 | |||||||||||||||
| FLU | 1179.13 | 1090.93 | 1161.00 | 1090.79 | |||||||||||||||
| ED | 1070.17*** | 260.69 | 1060.88*** | 260.84 | |||||||||||||||
| Gender (Woman) | -298.93 | 299.37 | -299.62 | 299.48 | |||||||||||||||
| Diversification | -18.91 | 426.15 | -22.89 | 426.63 | |||||||||||||||
| Organic | 39.21 | 475.92 | 57.18 | 477.77 | |||||||||||||||
| Education | 16.50 | 209.12 | 10.93 | 208.72 | |||||||||||||||
| Age (years) | 24.56** | 12.35 | 24.28** | 12.30 | |||||||||||||||
| Year (vs 2012) | |||||||||||||||||||
| 2013 | -66.35 | 353.20 | -83.99 | 357.96 | |||||||||||||||
| 2014 | 145.63 | 405.84 | 141.99 | 405.14 | |||||||||||||||
| 2015 | 444.99 | 331.13 | 494.20 | 329.88 | |||||||||||||||
| 2016 | 1391.10** | 690.63 | 1384.50** | 690.78 | |||||||||||||||
| 2017 | 374.81 | 428.84 | 367.44 | 428.68 | |||||||||||||||
| 2018 | 1072.66** | 490.55 | 1068.52** | 487.95 | |||||||||||||||
| 2019 | 325.40 | 583.24 | 320.91 | 584.57 | |||||||||||||||
| 2020 | 520.55 | 555.68 | 499.98 | 554.84 | |||||||||||||||
| 2021 | 103.94 | 395.84 | 107.05 | 394.49 | |||||||||||||||
| 2022 | -156.24 | 386.01 | -150.14 | 384.57 | |||||||||||||||
| Constant | -3252.46** | 1416.46 | -3188.35** | 1413.39 | |||||||||||||||
| Note: * p<0.10, ** p<0.05, *** p<0.01. | |||||||||||||||||||
Post-hoc pairwise analyses indicate that, in the two regressions, the gap is not uniformly evident across all FTs and farm scales. From the first regression, which has NI excluding the amount of CA support received as the dependent variable, a negative income gap exists for small farms specialised in cattle and in sheep and goats, while large farms in these same categories and those specialised in fruit do not show a statistically significant gap. Focusing on small cattle farms, the estimated magnitude of the gap excluding CA support is -€1,319.44 per hectare, while the estimated NI gap is -€1,201.49 per hectare. For small farms specialised in sheep and goats, the estimated magnitude of the gap excluding CA support is -€2,384.19 per hectare, which decreases to -€2,258.49 when considering the estimated NI gap (Table 6).
| Scale | NI excluding CA | NI | χ² | P-value | |||||||||||||||
|---|---|---|---|---|---|---|---|---|---|---|---|---|---|---|---|---|---|---|---|
| Gap (€/ha) | Robust SE | Gap (€/ha) | Robust SE | ||||||||||||||||
| Cattle | Small | -1319.44 ** | 603.97 | -1201.49** | 605.79 | 159.88 | < .0001 | ||||||||||||
| Large | -71.24 | 305.14 | -3.586 | 301.425 | 68.93 | < .0001 | |||||||||||||
| Sheep & goats | Small | -2384.19 *** | 867.49 | -2258.49 *** | 870.54 | 101.85 | < .0001 | ||||||||||||
| Large | 343.25 | 386.87 | 418.60 | 397.00 | 9.31 | 0.002 | |||||||||||||
| Fruit | Small | -1233.37 | 754.99 | -1109.84 | 757.62 | 147.01 | < .0001 | ||||||||||||
| Large | -763.25 | 946.99 | 653.55 | 953.66 | 0.48 | 0.486 | |||||||||||||
| Note: NI = Net income; CA = Compensatory allowance; Gap = estimate of the operating income difference between mountain and non-mountain farms; ** p < .05, *** p<0.01. The last two columns refer to the Wald test between the two estimated gaps, where H0: NI excluding CA = NI. | |||||||||||||||||||
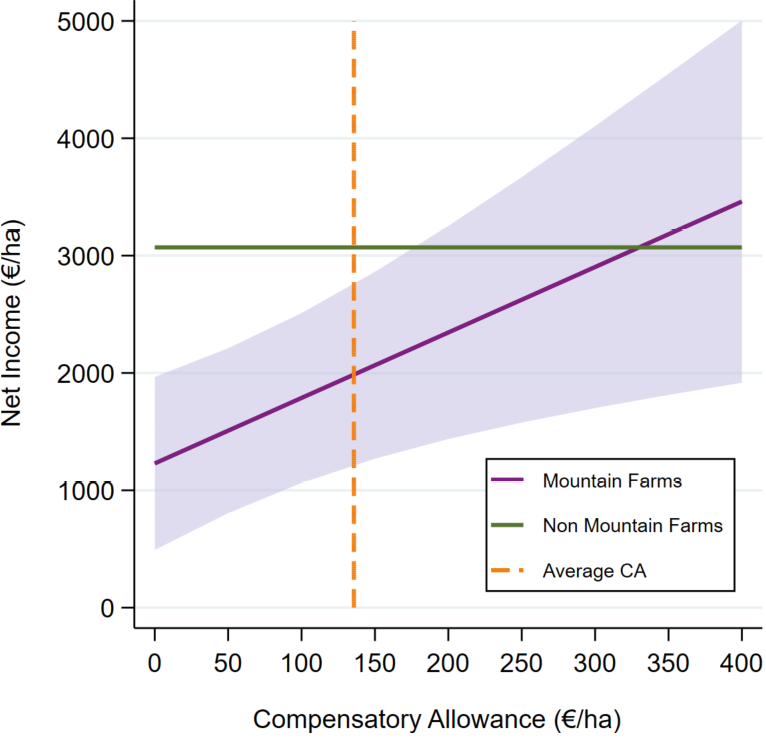
Our analysis further proceeded to determine the required financial magnitude of CA payment to effectively address income disparities between farms situated in mountainous and non-mountainous areas. The analysis was conducted exclusively on small farms specialising in cattle and sheep and goats, as these were the farming types where the income gap was found to be negative and statistically significant. As shown in Figure 1, mountain farms currently receive an average CA payment of around €135/ha. To fully close the income gap between farms in mountainous areas and those in non-mountainous areas, the CA payment would need to more than double, reaching approximately €340/ha.
The findings of this study provide a deeper understanding of the economic challenges faced by farms in Piedmont’s mountainous areas, especially concerning income disparities when compared to farms in non-mountainous regions. In addition, the study highlights the role of public support in addressing these challenges, particularly evaluating the effectiveness of compensatory measures such as the CA.
Our results confirm the existence of an income gap between farms situated in mountainous and non-mountainous areas. This disparity is largely driven by socio-ecological challenges such as steep terrain, adverse climate conditions, and limited competitiveness, which collectively increase the risk of land abandonment in mountain regions (Dax, 2021). Additional challenges, including an ageing farming population, limited technical training, and the prevalence of low-input systems, further undermine the economic sustainability of agriculture in these areas (Giannakis & Bruggeman, 2015; Strijker, 2004). These vulnerabilities appear to be particularly pronounced in smaller farms, which tend to have fewer resources to adapt to structural constraints.
Moreover, our study demonstrates that this income gap is not uniformly distributed across different types of farming, confirming that distinct mountain farming types result in different economic outcomes (Papić Milojević & Bogdanov, 2023). The income gap was found to be statistically significant, and negative in small farms specialised in cattle and sheep and goats. Importantly, these differences are further influenced by farm scale: small-scale farms within these specialisations show a marked income disadvantage, whereas large farms within the same types often do not present a significant income gap. The reason for this phenomenon could be attributed to the high fixed costs borne by small farms specialized in animal breeding, which, combined with lower production volumes, result in a decrease in profitability (Kuhl et al., 2019). At the same time, the absence of a significant income gap for other FT raises important policy considerations. If certain sectors do not experience substantial economic disadvantages due to mountain constraints, this might suggest that CA support should not be uniformly distributed, but rather adjusted according to the specific needs of different FT and scales. Current eligibility rules already distinguish between small and large farms – granting full CA support only to those under 20 hectares – but our findings show that this differentiation, while appropriate in principle, does not go far enough in correcting income disparities.
Furthermore, our results indicate that the income gap in small farms specialized in animal breeding is only partially bridged by CA support, which covers only a small portion of this gap. This finding echoes previous concerns regarding the effectiveness of policies aimed at supporting mountain farms in Italy (Whitaker, 2024). However, CA support remains insufficient to fully close the gap. Previous studies have shown that the impact of ANC support is variable, depending on context (Namiotko et al., 2017). While some research aligns with our findings, demonstrating ANC supports’ limited role in bolstering mountain farm income (Ferto et al., 2022; Wieliczko et al., 2018), other studies have highlighted its effectiveness in other agricultural types, such as cereals (Klima et al., 2021), or in boosting income for organic farms, especially small-scale (Veveris et al., 2014).
Even though current eligibility criteria consider factors such as the agricultural system, the level of land disadvantage, and farm scale (Regione Piemonte, 2016), they do not fully capture the economic heterogeneity across those factors and different FT. This limitation suggests that a more differentiated approach in the allocation of CA support could enhance its effectiveness. In particular, redistributing resources from less-affected sectors to those that bear the highest costs of mountain farming could provide a more targeted use of funds.
Notably, the current policy framework already recognises the importance of farm scale by modulating CA support, however our findings indicate that this differentiation is not sufficient to fully compensate for the income gap observed in small mountain farms.
To further reduce the income disparities, a multifaceted strategy should be considered. In addition to revising CA distribution, policies aimed at enhancing productivity and market access for mountain farms could be beneficial. Investments in infrastructure, technological innovation, and training programs tailored to the needs of mountain farmers could improve efficiency and economic resilience (Dax & Fischer, 2018; Pezzini, 2001). Furthermore, fostering cooperatives and producer organizations may strengthen the bargaining power of mountain farmers, enabling them to capture a larger share of market value and thereby reducing income disparities (Knickel et al., 2018).
Nonetheless, the income gap for farms specialised in animal breeding is not fully addressed by CA support, and achieving full compensation would require more than doubling the per-hectare payment. While increasing financial support could help, it is essential to evaluate its cost-effectiveness. A simple increase in payments may not be the most efficient approach, as it could lead to budgetary constraints without necessarily addressing structural inefficiencies. Instead, a combination of increased financial aid and complementary measures, such as targeted investments in modernization, innovation, and value-chain integration, could yield better long-term results. Future policy adjustments should consider the balance between financial sustainability and the actual impact of interventions on mountain farm incomes.
It is essential to consider a redistribution of support payments that reflects the varied economic outcomes across different mountain FT, underscoring the need for sectoral policies tailored to these differences (Papić Milojević & Bogdanov, 2023). A more tailored distribution of CA support, based not only on land characteristics but also on the specific economic challenges of different FT, could lead to a more equitable and effective support mechanism. In particular, an equitable distribution of CA support may be challenging to achieve with a flat per-hectare payment structure. Allocating contributions based on labour units rather than area could offer a more equitable approach, and presents a promising avenue for future research. Additionally, first-pillar direct payments could play a critical role in this redistribution by facilitating a convergence process that reallocates resources in favour of mountain areas (Tantari et al., 2017).
It is important to acknowledge a broader structural disadvantage that our analysis does not capture: the limited range of viable production options in LFAs. Mountain farms are often constrained not only by higher production costs but also by ecological and climatic factors that restrict crop and livestock choices, limiting their ability to diversify or switch to more profitable activities. This implies an additional layer of opportunity cost, which is not addressed through intra-sectoral profitability comparisons alone. Capturing such constraints would require integrating agronomic feasibility assessments and opportunity cost modeling into a broader analytical framework, an important, though currently out-of-scope, direction for future research. However, we believe recognizing this limitation is essential when designing compensation schemes and rural development strategies that aim to fully reflect the multi-dimensional nature of disadvantage in LFAs.
Beyond public support, narrowing the income gap between mountain and non-mountain farms might also require consumer recognition and willingness to pay a price premium for mountain-origin products. This added value would create a more sustainable revenue stream for mountain farms, helping to offset higher production costs and lower yields, and thus supporting the long-term viability of agriculture in these challenging areas (Cei et al., 2023; Staffolani et al., 2023; Mazzocchi & Sali, 2021).
It is important to acknowledge, however, that the empirical strategy employed in this study does not allow for causal inference. Although we apply statistical techniques to adjust for observable differences between farms, unobserved confounding factors may still influence the results. As such, the findings should be interpreted as associations rather than causal effects. Policy implications should be considered exploratory, offering indications rather than definitive prescriptions.
This study aimed to assess the effectiveness of RDP’s measures to bridge the income gap between farms located in mountainous and non-mountainous areas in Piedmont. The results show that a statistically significant and negative income gap exists only in small farms specialized in cattle and sheep and goats. Net of the CA support provided through the RDP, the average shortfall amounts to €1,319.44 per hectare for cattle farms and €2,384.19 per hectare for sheep and goat farms. Compensatory allowance support helps reduce this gap by 8.93% for cattle farms and 5.28% for sheep and goat farms, though a substantial disparity remains.
While increasing compensatory allowances could help narrow income disparities in mountain areas, our findings suggest that this measure alone is neither financially sustainable nor sufficient to address the broader challenges these regions face. A more promising approach involves embedding CAs within integrated territorial development strategies that tackle structural and systemic constraints. For example, policy experiences in France during the early 2000s highlight the value of bundled interventions, whereby CAs were linked to participation in agri-environmental or organic farming schemes – promoting both economic viability and environmental stewardship. At the regional level, the Strategia per le Montagne del Piemonte (DGR 27/02/2023) offers a concrete illustration of how multi-sectoral action plans can support youth entrepreneurship, workforce training, and the valorization of ecosystem services alongside traditional income support (Regione Piemonte, 2022; 2023). Additionally, shifting from per-hectare to per-labor-unit payments could enhance the equity and effectiveness of support, better aligning aid with actual farm effort and viability – though this would require overcoming significant administrative and WTO-related hurdles. Ultimately, advancing the cost-effectiveness and legitimacy of rural policy in mountain areas calls for a transition from a logic of compensation to one of strategic investment, in line with the broader vision of the Strategia Nazionale per le Aree Interne, recognizing mountain farming as a cornerstone of territorial resilience and social cohesion
In general, the findings indicate that CA support does not fully bridge the income gap, even when supplemented by contributions from other RDP measures. To completely close this gap, CA support would need to more than double, increasing from €135/ha to €340/ha, which would require a substantial rise in allocated resources. Given the limited economic feasibility of this approach, a more viable solution would involve not only increasing contributions but, more importantly, redistributing them. All in all, mountainous areas constitute approximately 45% of Piedmont’s total land area and 30% of its agricultural land, making them crucial for the region’s economic and environmental sustainability. The study serves as an exploratory analysis, with the intention of expanding the research to additional Alpine regions in future studies.
This work was funded by the European Union Next-GenerationEU: (Call PRIN 2022 - Italian Ministry of University and Research (MUR) - RECIPE - cod. 20224ZHNXE). Also, we would like to thank the two anonymous reviewers for their thoughtful comments and efforts towards improving the initial draft of our manuscript.
Andrejovská, A., & Glova, J. (2022). Sustainability of farms in EU countries in the context of income indicators: Regression analysis based on a new classification. Agriculture, 12(11), 1884.
Baltagi, B. H., (2008). Econometric analysis of panel data (Vol. 4, pp. 135-145). Chichester: Wiley.
Bellon, M. R., Gotor, E., & Caracciolo, F. (2015). Assessing the effectiveness of projects supporting on-farm conservation of native crops: Evidence from the high Andes of South America. World development, 70, 162-176.
Borsotto, P., Cagliero, R., & Trione, S. (2010). Le zone svantaggiate e le altre zone con svantaggi specifici. In Le politiche comunitarie per lo sviluppo rurale. Il quadro degli interventi in Italia (pp. 127-142). INEA.
Cagliero, R., Iacono, R., Licciardo, F., Prandi, T., & Rossi, N. (2018). La montagna e le zone svantaggiate nei Programmi di Sviluppo Rurale: Una valutazione delle indennità compensative attraverso la Rica. Economia Agro-Alimentare, 20(3), 479-501.
Cei, L., Defrancesco, E., Gatto, P., & Pagliacci, F. (2023). Pay more for me, I’m from the mountains! The role of the EU Mountain Product term and other credence attributes in consumers’ valuation of lamb meat. Agricultural and Food Economics, 11(1), 12.
Cesaro, L., & Marongiu, S. (2013). L’agricoltura di montagna svantaggio o risorsa? RRN Magazine, 6, 6-9.
Cooper, T., Baldock, D., Rayment, M., Kuhmonen, T., Terluin, I., Swales, V., Poux, X., Zakeossian, D., & Farmer, M. (2006). An Evaluation of the Less Favoured Area Measure in the 25 Member States of the European Union. IEEP Brussels Report for Directorate-General Agriculture.
CREA. (2025). RICA – Rete d’Informazione Contabile Agricola. https://rica.crea.gov.it/index.php?lang=en
Dax, T., Schroll, K., Machold, I., Derszniak-Noirjean, M., Schuh, B., & Gaupp-Berghausen, M. (2021). Land abandonment in mountain areas of the EU: An inevitable side effect of farming modernization and neglected t hreat to sustainable land use. Land, 10(6), 591.
Dax, T., & Fischer, M. (2018). An alternative policy approach to rural development in regions facing population decline. European Planning Studies, 26(2), 297-315.
Direzione Agricoltura - Regione Piemonte. Allegato ai Quaderni della Regione Piemonte – Collana “Agricoltura”. Direttore Responsabile: Luciano Conterno.
Ferlaino, F., Rota, F. S., Dematteis, G., et al. (2019). Le montagne del Piemonte. Curato da Fiorenzo Ferlaino, Francesca Silvia Rota, e Giuseppe Dematteis. Istituto di Ricerche Economico Sociali del Piemonte (IRES). Via Nizza 18, 10125 Torino.
Fertő, I., Bojnec, Š., & Podruzsik, S. (2022). Do subsidies decrease the farm income inequality in Hungary? AGRIS on-line Papers in Economics and Informatics, 14(2), 49-56.
Fraschetti, L., Lupia, F., and Storti, D. (2017). Le zone agricole soggette a limitazioni naturali nelle politiche comunitarie. Agriregionieuropa, 13(51), 107.
Giannakis, E., & Bruggeman, A. (2015). The highly variable economic performance of European agriculture. Land Use Policy, 45, 26-35.
Guo, S., & Fraser, M. W. (2010). Propensity score analysis: statistical methods and applications. Psychometrika, 75(4), 775.
ISTAT (2020) “Annuario statistico italiano – Territorio”. [Online] Available: https://www.istat.it/it/files//2020/12/C01.pdf [Accessed: Nov. 01, 2024].
Klima, K., Kliszcz, A., Puła, J., & Lepiarczyk, A. (2020). Yield and profitability of crop production in mountain less favoured areas. Agronomy, 10(5), 700.
Knickel, K., Redman, M., Darnhofer, I., Ashkenazy, A., Chebach, T. C., Šūmane, S., … & Rogge, E. (2018). Between aspirations and reality: Making farming, food systems and rural areas more resilient, sustainable and equitable. Journal of Rural Studies, 59, 197-210.
Kryszak, Ł., Guth, M., & Czyżewski, B. (2021). Determinants of farm profitability in the EU regions. Does farm size matter? Agricultural Economics/Zemědělská Ekonomika, 67(3), 90-100.
Kühl, S., Flach, L., & Gauly, M. (2020). Economic assessment of small-scale mountain dairy farms in South Tyrol depending on feed intake and breed. Italian Journal of Animal Science, 19(1), 41-50.
Mazzocchi, C., & Sali, G. (2022). Supporting mountain agriculture through “mountain product” label: A choice experiment approach. Environment, Development and Sustainability, 24(1), 701-723.
Namiotko, V., Góral, J., & Soliwoda, M. (2017). The economic situation of farms located in less favoured areas on the example of Lithuania and Poland. Agricultural and Resource Economics: International Scientific E-Journal, 3(4), 5-19.
NUVAL Piemonte. (2016). Scheda di Valutazione Misura 211: Indennità a favore degli agricoltori delle zone montane - Rapporto di valutazione ex post del PSR 2007-2013 Regione Piemonte. Regione Piemonte - Direzione Risorse Finanziarie e Patrimonio.
Oxouzi, E., Melfou, K., Galea, M., & Papanagiotou, E. (2012). Economic performance and crop farm efficiency in mountainous and other less favoured areas in Greece. Bulgarian Journal of Agricultural Science, 18(6), 846-853.
Papić Milojević, R., & Bogdanov, N. (2024). Typology of farms in areas with natural constraints--diversity of livelihood strategies and their determinants. Applied Ecology & Environmental Research, 22(2), 1051-1073.
Pezzini, M. (2001). Rural policy lessons from OECD countries. International Regional Science Review, 24(1), 134-145.
Poláková, J. (2019). Subsidies to less favoured areas in the Czech Republic: Why do they matter? Prague Economic Papers, 28(4), 416-432.
Regione Piemonte. (2025). PSR Piemonte – dati di sintesi. Servizionline. https://servizi.regione.piemonte.it/catalogo/psr-piemonte-dati-sintesi.
Regione Piemonte. (2023). Piano di Azione 2024. Strategia per le Montagne del Piemonte. Visioni per i territori montani. Dicembre 2023.
Regione Piemonte. (2022). Documento di Strategia Regionale per lo Sviluppo Sostenibile (SRSvS). Luglio 2022.
Regulation (EU) No 1305/2013 of the European Parliament and of the Council of 17 December 2013 on support for rural development by the European Agricultural Fund for Rural Development (EAFRD) and repealing Council Regulation (EC) No 1698/2005. OJ L 347, 20.12.2013, p. 487.
Regione Piemonte. (2016). Guida al PSR 2014-2020: Attivita di informazione realizzata nell’ambito del piano di comunicazione del Programma di sviluppo rurale 2014-2020, Misura 20 – Assistenza tecnica.
Regulation (EC) No 1698/2005 of 20 September 2005 on support for rural development by the European Agricultural Fund for Rural Development (EAFRD)
Romagnoli, L., Giaccio, V., Mastronardi, L., & Forleo, M. B. (2021). Highlighting the drivers of Italian diversified farms efficiency: A Two-stage DEA-panel Tobit analysis. Sustainability, 13(23), 12949.
Ryś-Jurek, R. (2019). Determinants of family farm income depending on farm size. Roczniki (Annals), 2019(3), 401-411.
Średzińska, J. (2018). Determinants of the Income of Farms in EU Countries. Studia Oeconomica Posnaniensia, 6(2), 54-65.
Staffolani, G., Bentivoglio, D., & Finco, A. (2022). Consumers’ purchasing determinants towards mountain food products. Sustainability, 14(14), 8282.
Strijker, D. (2005). Marginal lands in Europe – causes of decline. Basic and Applied Ecology, 6(2), 99-106.
Strzelecka, A., Zawadzka, D., & Kurdyś-Kujawska, A. (2018). Production Potential and Income of Agricultural Holdings in Poland. Regional Barometer. Analyses & Prognoses, 16(3), 137-144.
Storti, D. (2013). Le zone agricole svantaggiate: ieri, oggi, domani. Agriregionieuropa, 9(34), 6-9.
Tantari, A., Persia, F., & Cardillo, C. (2019). Assessing the impact of direct payments convergence on farm income inequality: The case of Italian farms. Journal of International Food & Agribusiness Marketing, 31(4), 417-428.
Veveris, A., Lakovskis, P., & Benga, E. (2014). Economic Aspects Of Lfa And Organic Farming Payments In Latvia. Management Theory & Studies for Rural Business & Infrastructure Development, 36, 679-687.
Whitaker, S. H. (2024). The impact of government policies and regulations on the subjective well-being of farmers in two rural mountain areas of Italy. Agriculture and Human Values, 1-19.
Wieliczko, B., Kurdyś-Kujawska, A., & Sompolska-Rzechuła, A. (2018). Economic component of ANC payments. Example of the farms in Poland. Research For Rural Development, 2, 154-159.