Received: November 29, 2024; Accepted: June 5, 2025; Published: December 31, 2025
Promoting natural capital conservation: a bet for socioeconomic development of marginal areas
Università degli studi della Tuscia, Italy
*Corresponding author. Email: f.pietrangeli89@unitus.it
Abstract. The aim of this paper is to enhance the well-being of marginalized areas by improving their local economy, considering the correlation between socioeconomic marginalization and environmental sustainability. These two objectives are at the core of the international and European policy agenda, but they are not often merged in one action. Within this study, we selected a marginal area in central Italy and assessed its environmental sustainability, using the method of the ecological balance. The results show that this territory has the capacity to provide an amount of natural capital greater than the ecological footprint generated by local production activities, thus the value of the ecological balance is positive. Then, we discussed how local policies can favor processes focused on agricultural products coming from areas recognized as sustainable. Environmental sustainability can be work as a branding strategy, which can raise the market value of the products and the farmers’ income, thus supporting the economic development of marginal areas and promoting the protection of their natural capital.
Keywords: sustainability, marginality, ecological balance, agriculture, rural policy.
Index
2.1. The concept of marginality and marginal areas characteristics
2.2. Definition and assessment of environmental sustainability
3.1. Delimitation of marginal areas within a region
3.2. The Ecological Balance for sustainability assessment
4.1. Delimitation of the marginal area
4.2. The Ecological Balance of LAG Alto Lazio
The socioeconomic development of marginal areas is one of the most important targets of European policies, due to their generalized diffusion. About 45% of European territory consists of regions presenting strong marginality characteristics (De Toni et al., 2021).
In countries where a large part of the territory is covered by marginal areas, as in the case of Italy, the policy makers are engaged in facing the implementation of specific interventions to fill the development gaps that often characterize such areas (Kang et al., 2013a). Socioeconomic marginality, indeed, is associated with negative characteristics such as isolation, low income, depopulation, old age of residents, weak connections with urban areas, few infrastructures and a significant share of the local income being based on agricultural production (Arshad et al., 2021).
However, there are also some positive aspects in marginal areas, such as immaterial assets, which are important to promote their development: biodiversity, varied agroecosystems, wide availability of natural resources, just to name a few (Ahmadzai et al., 2021; Balzan et al., 2018). This evidence has led to the general and often implicit perception that marginality is associated with sustainability. The point is not whether this perception is true; rather, what do we mean by (socioeconomic) “marginality” and (environmental) “sustainability”.
This study, carried out within the Spoke 7 of PNRR Agritech project (“Integrated models for the development of marginal areas to promote multifunctional production systems enhancing agro-ecological and socio-economic sustainability”), aims to face and discuss this point.
More specifically, this paper has three main objectives.
The first one is to give a clear definition of socioeconomic marginality and select a marginal area inside the province of Viterbo (Italy) that matches such definition.
The second one is to adopt a definition of environmental sustainability and assess if the selected marginal area may be declared as sustainable. To accomplish this objective the focus has been placed on the agricultural sector rather than on the whole local economic system. This choice is justified by two main reasons. First, agriculture is the only economic sector that directly manages natural resources, represented by farmland. Second, the idea of food from a sustainable production system mainly refers more to agricultural practices than to the other stages of the supply chain.
The third one is to discuss how specific actions supported by local institutions can favor processes to promote agricultural products coming from an area recognized as sustainable to raise their market value, thus increasing the farmers’ income and supporting the economic development of a marginal area.
As asserted by Basile and Cavallo (2020), regional and cohesion policies of national governments and the European Union typically address internal or marginal areas. However, the objective of this paper is not to discuss the national or regional measures more suitable for the development of marginal areas. This work looks at valorization process of local economy as a possible “bottom-up” action, able to identify a territorial brand linked to specific characteristics of marginal areas (Banini and Pollice, 2015). This appears to be an interesting topic also considering that, despite its significance, research on the connections between place branding and sustainable development is still limited in the scientific literature (Aguilera-Cora et al., 2024).
To achieve these objectives the paper is structured as follows.
The background is divided into two subsections. In the first one we discuss what a marginal area is, what does marginality mean, which the marginality indicators are and why the idea of sustainability is so often linked to marginal areas. In the second one, we present the definition of environmental sustainability as the spatial condition where the natural capital maintenance is ensured. The methodology section is also split in two parts. One describes the process adopted to identify a marginal area as a group of municipalities in a province. The other explains how the environmental sustainability of an agricultural system can be evaluated by means of an ecological balance. The results section reports on the outcome of the marginal area selection process and the description of its main characteristics. The ecological balance assessment of the selected area’s agricultural system follows. The results obtained are then discussed to underline their coherence with previous studies and in terms of policy implications of sustainability conditions. The paper ends with some final considerations related to the opportunity of valorizing the environmental dimension of the marginal areas.
2.1. The concept of marginality and marginal areas characteristics
Rural areas cover a wide part of the Italian territory. Many of these areas face the issue of overcoming the developmental gaps with urban areas and the consequent negative phenomena such as depopulation, ageing and loss of primary services. This topic is particularly relevant in a country like Italy, where the internal areas suffer isolation and socioeconomic problems.
For this reason, these areas are specifically considered as the target of many European (Oecd and European Commission, 2020) and national policies, such as the “National Strategy for Inner Areas” (SNAI), to support their revitalization with a “place-based” approach, where the focus of the policies are the specific qualities of each area and its local production system (De Toni et al., 2021).
In addressing these issues, the regions with the above characteristics are often defined as marginal areas, yet it is not so common to find a clear meaning of what “marginality” really is. Therefore, a definition of marginality is needed for the task of identifying and shaping the boundaries of a marginal area.
The general idea underlying the concept of marginal areas, a notion frequently used by researchers and policy makers, is often associated with a complex condition of disadvantage according to both geographic characteristics and socioeconomic aspects. Sometimes this term is also used like a synonym for abandoned, degraded, unused or under-used area (Sallustio et al., 2018).
To provide a more comprehensive definition, it should be noted that there is a widely shared understanding that socio-economic marginality refers to situations of territorial disadvantage that undermines the vitality, competitiveness and development potential of a region (Arshad et al, 2021). These are areas with a very low population density and a negative demographic trend, along with a minimal presence of basic services (Malikova et al., 2016). Furthermore, a region is considered marginal because it is significantly distant from essential services and is also characterized by geomorphological conditions that lead to structural deficiencies in transportation routes, which in turn affect the location of settlements and productive activities (Lucas, 2012; Vendemmia et al., 2021). A territory far from primary services and weakly connected to infrastructures and networks is marginal because these conditions affect the establishment of farms and industries (Meini et al., 2017). Marginality also involves a structural weakening of the local system’s capacity to react, caused by the simultaneous occurrence of a combination of recessive effects (Carrosio and Osti, 2017).
Due to the uneven geographical distribution of development conditions, such as structures, activities resources, knowledge and so on, resources available to develop local systems do not operate everywhere with the same intensity, increasing the risk of socioeconomic marginality (Sotte, 2016). On the other hand, if we associate the territorial conditions of marginality to the specific characteristics of the economic local production system, the economic system itself can represent a development driver, provided that is possible to promote its positive environmental dimension (Ahmadzai et al., 2021).
Given a definition of marginality, it is important to clarify that, as a phenomenon, it can be measured, detected, and quantified based on coherent economic, social, territorial, environmental, and demographic indicators within a specific area. As well as the possible definitions, even the indicators of socioeconomic marginality are varied and often interrelated. Commonly used indicators include income levels, employment status, education and access to basic services such as healthcare, housing and social protection. Other indicators may include participation in informal labor markets, vulnerability to economic shocks and social isolation (Vendemmia et al., 2021). Indicators help both with identifying the area at risk of marginalization and providing a framework for assessing the effectiveness of policies aimed at reducing inequality and promoting social and economic development (De Toni et al., 2021).
In choosing indicators it is important to consider that marginality is both a relative and dynamic condition: relative because it can only be defined through comparison with different situations, either spatial or socio-economic; dynamic because various causes can influence its level, as well as changes in terms of comparison or in the factors considered important in defining it (Ahmadzai et al., 2021). To identify marginal areas as a group of municipalities, data related to selected indicators should be collected at municipal level.
Moreover, it is appropriate that such aggregation corresponds to an administrative authority. This is important because only in the presence of an authority that aggregates the municipalities it is possible to apply policies to develop the marginal area, involving the participation of economic actors and the engagement of local administrations and stakeholders (Covino R., 2017).
2.2. Definition and assessment of environmental sustainability
Agriculture, like all productive activities, uses natural resources to obtain the material and energy inputs needed to carry out production processes and to absorb residues, such as waste and greenhouse gas emissions. However, unlike other sectors, agriculture has the potential to directly contribute to the supply of natural resources with different types of farmlands. The property of agricultural system of managing natural resources and economic activities at the same time offers the opportunity of directly comparing availability and consumption of natural capital in a certain area. It is thus possible to assess a real ecological balance (Franco, 2021a).
In this regard, there is a broad consensus in the scientific community that ecological footprint (Wackernagel and Rees, 1996), is a suitable methodology to compare supply and demand of natural resources, therefore assessing the environmental sustainability of economic processes (Moldan et al., 2012; Neumayer, 2013). The environmental sustainability discussed here, refers to the ability of the ecosystems to support given economic effects. Specifically, the approach used in this study, evaluates a type of environmental sustainability defined as “strong”, which assumes the conservation of natural capital as a basic condition, where the use of natural resources must avoid the deterioration of their reserve. This methodology is not limited to the analysis of single economic activities, but it is also applicable for entire regions, thus providing the possibility to operate at different scales, as highlighted in many studies focused on agricultural sector (Niccolucci et al., 2008; Cerutti et al., 2013; Galli et al., 2014; Martella et al., 2023; Biagetti et al., 2023a).
To proceed with the assessment of an ecological balance in agriculture, the first step is represented by the delimitation of the space involved in the assessment. Then, it is essential to define the key indicators for calculation. The availability of natural resources present in the defined area is measured by Biocapacity (BC), while Ecological Footprint (EF) quantifies the impact of economic activities carried out in the same area. EF translates the natural capital required by cultivation and livestock management in terms of biologically productive areas, in a way that such demand can be compared with the carrying capacity of the agricultural ecosystem (Franco, 2021b). This makes it possible to determine the condition of environmental sustainability or unsustainability as the result of the Ecological Balance (EB = BC - EF).
BC, EF and EB are expressed using a standardized unit of measurement, defined as global hectare (gha). This metric represents the average biological productivity of one hectare of the world’s surface, calculated by dividing the planet’s total capacity to provide natural resources by the number of hectares of land surface (Kitzes and Wackernagel, 2009; Galli, 2015). The Yield Factor (YF), specific to each country, and the Equivalence Factor (EQF), are the two parameters used to convert physical land hectares to final global hectares, with values varying by both land type and year considered (Borucke et al., 2013).
The ecological balance, and consequently the validation of the sustainability condition, can be applied to different typologies of agricultural systems, from a single crop to a farm, up to an entire region (Biagetti et al., 2023b). In this study, which focuses on the assessment of the sustainability of the agricultural sector in marginal areas, the boundary within which the supply and demand of natural capital must be assessed is represented by the total agricultural area inside a predefined group of municipalities.
3.1. Delimitation of marginal areas within a region
To identify marginal areas within a region, as pointed out in the background section, many approaches can be applied. In this study, considering the focus on the socio-economic dimension and the outcome of a literature overview on this topic, three indicators were chosen: old-age index, depopulation rate and per capita income. These indicators synthetize the marginality condition in terms of aging and decline of the local population and residents’ impoverishment (De Toni et al., 2021; Vendemmia et al., 2021). In this study such indicators for each municipality in the selected region are calculated as follows:
– Old-age index (2023): resident population older than 65, divided by resident population younger than 14 (ISTAT, 2024a);
– Population variation (2001-2023): resident population variation between 2023 and 2001 divided by resident population in 2001 (ISTAT, 2024a);
– Per capita income (2023): total taxable income divided by resident population (Ministero dell’Economia e delle Finanze 2024).
For every municipality in the province of Viterbo, the indicator values are classified in the range 1 (low marginality) to 5 (high marginality) coherently with the categories reported in Table 1. In this way three new marginality indicators, respectively IAGE, IDEP and IINC, are defined.
| Level of Marginality | Old-age index | Population variation | Income per capita (€) |
|---|---|---|---|
| 1 | < 1.5 | > +15% | > 14,000 |
| 2 | 1.5 - 2.0 | +5% - +15% | 13,000 - 14,000 |
| 3 | 2.0 - 2.5 | –5% - +5% | 12,000 - 13,000 |
| 4 | 2.5 - 3.0 | –15% - –5% | 11,000 - 12,000 |
| 5 | > 3.0 | < –15% | < 11,000 |
Categories in table 1 were set considering the values distribution of the three indicators in the municipalities of Viterbo province. It follows that IAGE, IDEP, IINC measure a relative (local) level of marginality. Furthermore, considering that the Italian old-age index is 1.93, the population variation is 3.5% and the income per capita is 14,590 €, what is marginal within Viterbo province is even more marginal in a national perspective. Therefore, the highest values of IAGE, IDEP, IINC can be associated with an absolute marginal condition.
Then, for each municipality (i) the index of marginality IMARi is calculated using the following relation:
IMARi = round ((IAGEi + IDEPi + IINCi)/3)(1)
Once each municipality is characterized with an individual marginality score, it’s necessary to define a marginal area where to assess the environmental sustainability of the local agricultural system. Such delimitation should consider at least two criteria: all the municipalities included in the area have a high enough level of marginality; the municipalities aggregation corresponds to an administrative body (or, at least, to a recognized legal entity) that is in the position to define and implement actions at local level. Therefore, the second step of the methodology is to border the marginal area that will be the object of sustainability evaluation and, at the same time, to identify the related governance institution that can promote specific actions for supporting the valorization of local products.
For this purpose, after identifying all the possible k municipality aggregations in the selected region (the province of Viterbo in our case), a variable t is defined. Such variable can have only two values: tij = 1 if the municipality i belongs to aggregation j; tij = 0 if the municipality i does not belong to aggregation j.
Using this variable, it is possible to assess the overall marginality of the aggregation j as
(2)
Once measured the marginality for each territorial aggregation, the one with the highest Mj can be chosen. This will be the area of which the sustainability of the agricultural system will be assessed.
3.2. The Ecological Balance for sustainability assessment
To evaluate the condition of deficit/surplus of natural capital in a delimited agricultural system a comparison between its supply and demand may be established. Such an ecological balance (EB) is calculated as the difference between the system’s overall biological productivity (BioCapacity - BC) and the impact of production activities (Ecological Footprint - EF): EB = BC – EF (Martella et al., 2023)
The amount of natural capital in the area (BCTOT) is determined by the bio-productivity of different types of farmland: cropland (BCCROP), forest land (BCFOR), semi-natural areas (pastures, shrublands, …) (BCASN), other surfaces (buildings, roads, …) (BCOTH), water (BCWAT).
The values of BCFOR, BCASN, BCOTH are determined following the standard ecological footprint methodology (Wackernagel and Rees, 1996) by converting the relative area through standard coefficients YF (yield factor) and EQF (equivalence factor) provided by Global Footprint Network (GFN, 2024).
The biocapacity associated with cropland is also calculated following the standard methodology, but the overall value is assessed by summing up the bio-productivity of each one (i) of the n crops cultivated in the area, as suggested by Passeri et al. (2013):
(3)
where Aj indicates the cultivated area, Ypj the crop average yield in the area, Ywj the crop world average yield (FAO, 2024).
Concerning the term BCWAT, is quite difficult to carry out a detailed analysis on the watersheds inside the farms within the area under analysis. Therefore, the biocapacity of this typology of land cover is included in BCOTH.
The demand for natural capital, measured by the total ecological footprint (EFTOT) is calculated through the sum of three farm activities impacts: cultivations (EFCROP), livestock (EFLIV), others (EFOTH).
EFCROP can be calculated following the methodology proposed by Passeri et al. (2013), which identifies two sources of impact: overproduction (EFovp) and use of inputs (EFinp). The first one is related to the bias between the observed yield and the yield that can be obtained in natural conditions, i.e., without using inputs. The second one expresses the area of bio-productive land required to absorb the effects of input use. The assessment of these two components, both referring to calculation methodology and coefficients used, is explained in detail in Blasi et al. (2016) and Franco (2021b).
The impact of livestock farming activities in terms of natural capital demand can be estimated as suggested in Biagetti et al. (2023b). The impact for each (j) of the m types of livestock farms in the area (EFlivj) is calculated in terms of bio-productive land needed for absorbing the emissions caused by input utilization and by enteric fermentation and management of animal manure, making use of specific conversion coefficients available in the literature (Coderoni et al., 2013; Mancini et al., 2016).
Finally, EFOTH includes the impact of labor use, energy and fuel consumption for operation and maintenance of farms areas not directly affected by production processes.
Therefore, the negative term of the ecological balance is calculated as follows:
(4)
EB, as well as all the components of BC and EF, are measured in global hectares (gha). However, to explain the outcome of the ecological balance in clearer terms, it is possible to convert the EB value in “real” hectares of a specific land cover. If we choose forest as land cover and consider the average biological productivity of an average Italian forest, an index of ecological performance (IEP) may be defined. Such an index expresses the hectares of Italian forest, in terms of natural capital, that is made available (if EB>0) or subtracted (if EB<0) for each hectare of the study area.
4.1. Delimitation of the marginal area
According to the methodology presented in the previous section, the old-age index, population variation and per capita income were calculated for all the 60 municipalities in the province of Viterbo. All data were extracted from Italian bureau of census (ISTAT, 2024a) database, except the taxable income that was obtained from the Ministry of Finance (MF) website.
Then the indicators IAGE, IDEP, IINC were assessed applying the classes reported in Table 1. For each municipality i these values were combined to obtain the marginality index IMARi. All the values of variable, indicators and IMAR are listed in Table A1 of the Appendix.
The next step was to identify the territorial aggregations within the province of Viterbo. These are the following: Inner area Alta Tuscia, Biodistrict of Bolsena lake, Biodistrict of Maremma, Biodistrict of Amerina road and Forre, Local Action Group Alto Lazio, Local Action Group Teverina, Local Action Group Etrusco Cimino, Local Action Group Amerina Agro Falisco, Local Action Group Tuscia Romana, Mountain community Alta Tuscia Laziale, Mountain community of Cimini (rural district).
Table 2 lists the names of territorial aggregation, the number of the municipalities and the marginality level Mj.
| Aggregation Code | Aggregation Name | Municipalities (nj) | Mj | ||||||||||||||||
|---|---|---|---|---|---|---|---|---|---|---|---|---|---|---|---|---|---|---|---|
| A1 | Inner area Alta Tuscia | 22 | 3.91 | ||||||||||||||||
| A2 | Biodistrict of Bolsena Lake | 17 | 3.59 | ||||||||||||||||
| A3 | Biodistrict of Maremma | 2 | 2.50 | ||||||||||||||||
| A4 | Biodistrict Via Amerina and Forre | 13 | 3.08 | ||||||||||||||||
| A5 | LAG Alto Lazio | 15 | 4.27 | ||||||||||||||||
| A6 | LAG in Teverina | 11 | 3.55 | ||||||||||||||||
| A7 | LAG Etrusco Cimino | 9 | 3.22 | ||||||||||||||||
| A8 | LAG Amerina Agro Falisco | 10 | 2.80 | ||||||||||||||||
| A9 | LAG Tuscia Romana | 6 | 2.83 | ||||||||||||||||
| A10 | Mountain community Alta Tuscia Laziale | 8 | 4.13 | ||||||||||||||||
| A11 | Mountain community of Cimini | 10 | 3.10 | ||||||||||||||||
| Source: Our elaboration. | |||||||||||||||||||
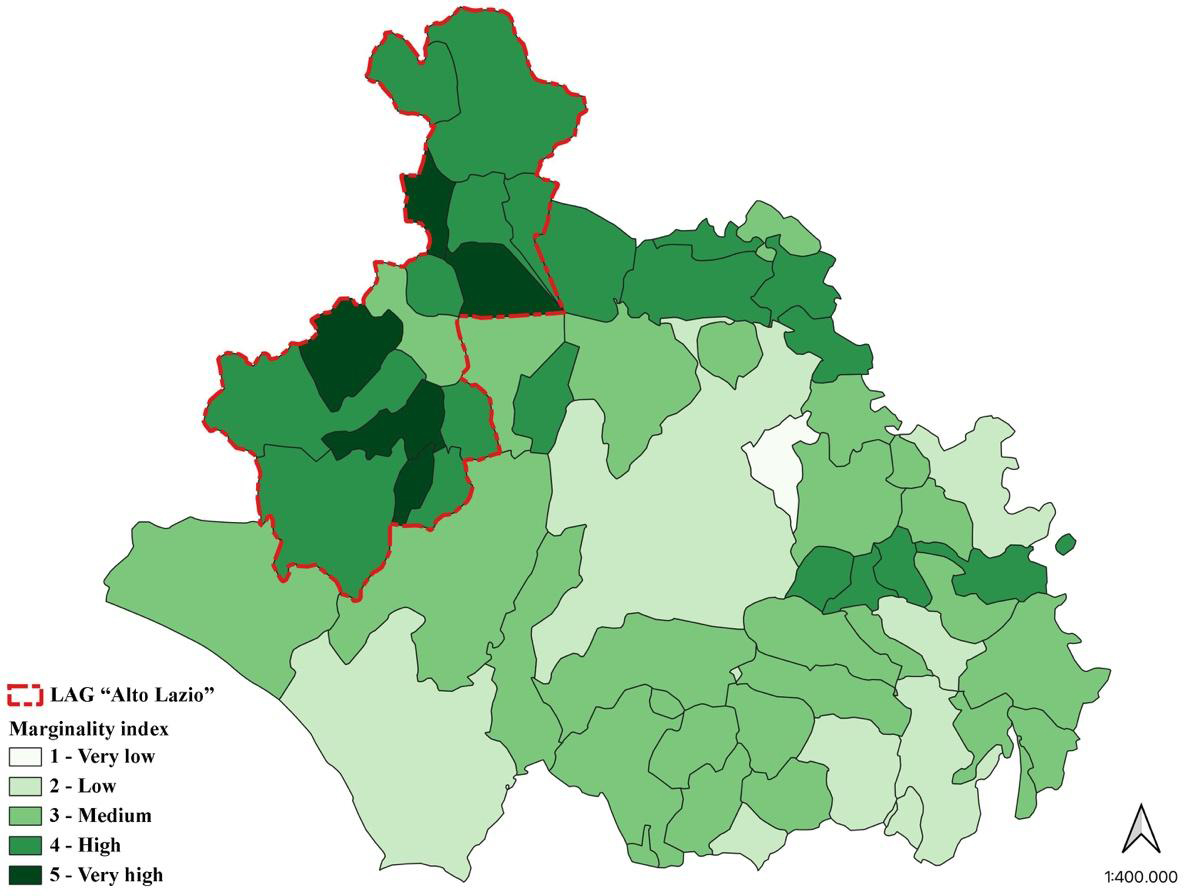
The aggregation with the highest level of marginality is the Local Action Group (LAG) Alto Lazio with a Mj equal to 4.27 followed by mountain community Alta Tuscia Laziale (4.13). All municipalities that are also included in the LAG Alto Lazio belong to this second aggregation. Considering this point and, moreover, the peculiarities of a LAG with respect to a mountain community in terms of policy intervention, the LAG Alto Lazio was preferred. Therefore, this area was chosen to calculate the environmental sustainability of the agricultural system and verify the possibility of increasing the value of local products through an environmental claim.
Figure 1 shows the values of IMAR for the Viterbo province municipalities and the boundaries of the LAG Alto Lazio. Table 3 lists the municipalities which belong to LAG Alto Lazio and their main characteristics.
| Municipality | Old-age index | Depopul. Rate | Income p.c. (€) |
IMAR | Area (km2) |
Agricultural area (km2) | Population | ||||||||||||
|---|---|---|---|---|---|---|---|---|---|---|---|---|---|---|---|---|---|---|---|
| Acquapendente | 3.11 | -8.9% | 13,117 | 4 | 131.71 | 46.08 | 5,271 | ||||||||||||
| Arlena di Castro | 3.21 | -2.9% | 11,001 | 4 | 21.87 | 14.88 | 842 | ||||||||||||
| Canino | 2.44 | -0.7% | 10,806 | 4 | 123.50 | 76.27 | 5,036 | ||||||||||||
| Cellere | 4.02 | -17.7% | 11,138 | 5 | 32.70 | 25.46 | 1,071 | ||||||||||||
| Farnese | 4.25 | -19.4% | 11,924 | 5 | 52.38 | 23.78 | 1,393 | ||||||||||||
| Gradoli | 4.49 | -16.3% | 11,607 | 5 | 37.50 | 7.11 | 1,252 | ||||||||||||
| Grotte di Castro | 3.82 | -20.2% | 13,389 | 4 | 33.42 | 16.88 | 2,369 | ||||||||||||
| Ischia di Castro | 2.92 | -13.2% | 10,966 | 4 | 104.95 | 55.94 | 2,138 | ||||||||||||
| Latera | 6.23 | -25.0% | 12,063 | 4 | 22.66 | 9.24 | 767 | ||||||||||||
| Onano | 3.33 | -23.6% | 10,215 | 5 | 24.60 | 11.29 | 893 | ||||||||||||
| Piansano | 3.69 | -13.2% | 11,898 | 4 | 26.61 | 18.39 | 1,928 | ||||||||||||
| Proceno | 5.89 | -17.6% | 12,032 | 4 | 41.90 | 26.36 | 521 | ||||||||||||
| San Lorenzo Nuovo | 3.21 | -2.6% | 12,001 | 4 | 27.99 | 8.51 | 2,013 | ||||||||||||
| Tessennano | 5.39 | -33.1% | 11,961 | 5 | 14.60 | 11.40 | 281 | ||||||||||||
| Valentano | 2.91 | -5.7% | 13,297 | 3 | 43.29 | 26.75 | 2,768 | ||||||||||||
| Total | 739.68 | 378.34 | 28,543 | ||||||||||||||||
| Source: Our elaboration on ISTAT (2024a) and MF (2024a). | |||||||||||||||||||
It could be useful to point out that a Local Action Group is a public-private partnership set up as an association with recognized legal personality, that has the mission to implement a strategic local development plan as defined in measure 19 of the 2014-2020 Lazio Regional Development Plan. The LAG decision-making is managed by the Board of directors composed of a maximum number of five members. This kind of administrative local authority has the advantage of bringing decision making processes closer to the territory, enhancing the real strengths and allowing broad and direct participation of local communities.
This feature fits with the area selection requirement, because only by involving local authorities, stakeholders’ environmental policies and actions are more effective in developing a marginal area.
4.2. The Ecological Balance of LAG Alto Lazio
Primary data on the agricultural sector in LAG Alto Lazio area was obtained through the 7th General Census of Agriculture (ISTAT, 2024b). The information collected includes data on the crop mix, in terms of major cultivation types and dimensions, and livestock, in terms of species and number of animals. Processing ISTAT data is a key element for obtaining detailed information on land use, such as crops and bio productive areas, as well as statistics on the number and type of livestock. Then, all information on the cultivation techniques (yield, work, machinery, inputs) was obtained from the FADN database for the year 2021 and 2022 (FADN, 2024). The technical information contained in the FADN provides a solid basis for the analysis of different agronomic practices and their consequent implications on the LAG territory.
The data analysis revealed that total farmland of the LAG Alto Lazio covers 49,905 hectares, which is about 67% of the whole area. As shown in Table 4, the total farm area is allocated 76% to cropland, 18% to forest land, and the remaining 5% to semi-natural areas (identified with grazing land) and other surfaces.
| Municipality | Total (ha) | Crop land | Forest Land | Semi-Natural Areas | Other surfaces | ||||||||||||||
|---|---|---|---|---|---|---|---|---|---|---|---|---|---|---|---|---|---|---|---|
| Acquapendente | 7,127 | 64.7% | 31.0% | 1.3% | 3.0% | ||||||||||||||
| Arlena di Castro | 1,634 | 91.1% | 5.9% | 0.4% | 2.6% | ||||||||||||||
| Canino | 10,039 | 76.0% | 12.9% | 1.0% | 10.1% | ||||||||||||||
| Cellere | 2,925 | 87.0% | 9.8% | 0.6% | 2.6% | ||||||||||||||
| Farnese | 2,997 | 79.4% | 16.4% | 2.3% | 1.9% | ||||||||||||||
| Gradoli | 941 | 75.7% | 19.0% | 1.9% | 3.4% | ||||||||||||||
| Grotte di Castro | 2,165 | 78.0% | 17.1% | 2.4% | 2.5% | ||||||||||||||
| Ischia di Castro | 8,499 | 65.8% | 28.5% | 1.1% | 4.6% | ||||||||||||||
| Latera | 1,361 | 67.9% | 28.7% | 0.8% | 2.6% | ||||||||||||||
| Onano | 1,394 | 81.0% | 15.1% | 1.6% | 2.3% | ||||||||||||||
| Piansano | 2,003 | 91.8% | 3.6% | 1.5% | 3.1% | ||||||||||||||
| Proceno | 3,132 | 84.2% | 11.9% | 1.5% | 2.4% | ||||||||||||||
| San Lorenzo Nuovo | 1,113 | 76.6% | 17.7% | 1.7% | 4.0% | ||||||||||||||
| Tessennano | 1,395 | 81.8% | 14.4% | 2.2% | 1.6% | ||||||||||||||
| Valentano | 3,182 | 84.1% | 12.3% | 1.8% | 1.8% | ||||||||||||||
| Total | 49,907 | 75.8% | 18.4% | 1.3% | 4.4% | ||||||||||||||
| Source: ISTAT, (2024b). | |||||||||||||||||||
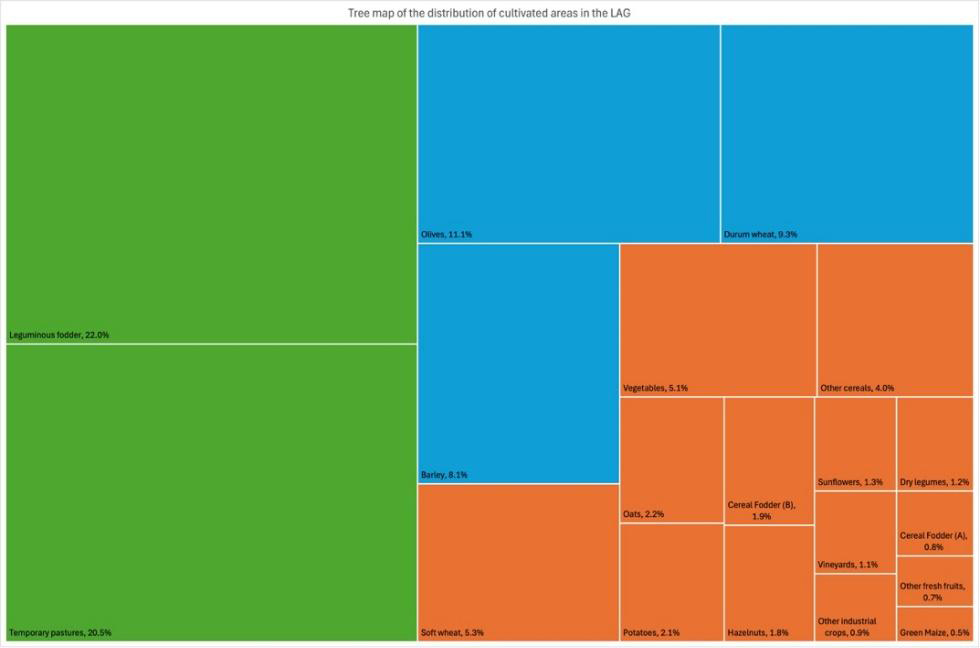
Focusing on cropland, the LAG area shows a general heterogeneity of cultivations, which can be divided into three main categories (Figure 2): leguminous fodder and temporary pastures (42.6%), mainly linked to livestock practices; a group of three major crops: olive trees, durum wheat, barley (28.5%); a group of many minor crops, including other cereals, vegetables and fruit trees, characterized by low-incidence surfaces (28.9%).
Regarding livestock (see Table 5), the main categories include laying hens and broilers, which constitute 52.6% of the total, followed by sheep, representing 39%. The remaining portion is divided between pigs (4.3%) and other species, such as cattle, horses and goats (4.1%).
| Livestock | Heads | ||||||||||||||||||
|---|---|---|---|---|---|---|---|---|---|---|---|---|---|---|---|---|---|---|---|
| Cattle | |||||||||||||||||||
| Dairy cow | 348 | ||||||||||||||||||
| Other cattle | 5,794 | ||||||||||||||||||
| Equines | |||||||||||||||||||
| Horses | 293 | ||||||||||||||||||
| Other equines | 29 | ||||||||||||||||||
| Sheep | 68,109 | ||||||||||||||||||
| Goats | 763 | ||||||||||||||||||
| Pigs | |||||||||||||||||||
| Sows | 489 | ||||||||||||||||||
| Other pigs | 7,033 | ||||||||||||||||||
| Poultry | |||||||||||||||||||
| Laying hens | 77,395 | ||||||||||||||||||
| Broilers | 14,591 | ||||||||||||||||||
| Source: Our elaboration on ISTAT (2024b). | |||||||||||||||||||
The analysis performed on the LAG Alto Lazio farmland made it possible to evaluate the environmental sustainability of the local agricultural system. The assessment, based on the comparison between biocapacity (BC) of different types of land use and the ecological footprint (EF) of agricultural activities, was carried out following the methodology explained in the previous section and using the data elaborated from ISTAT and FADN databases and the coefficient described in the cited literature. The results are synthetized in Table 6.
| BioCapacity | gha | Ecological Footprint | gha | ||||||||||||||||
|---|---|---|---|---|---|---|---|---|---|---|---|---|---|---|---|---|---|---|---|
| Cropland | 104,353 | Crops | 93,521 | ||||||||||||||||
| Forested land | 19,785 | Livestock | 16,229 | ||||||||||||||||
| Semi-natural areas | 3,512 | Other activities | 7,669 | ||||||||||||||||
| Other surfaces | 3,730 | ||||||||||||||||||
| Total BC | 131,380 | Total EF | 117,419 | ||||||||||||||||
| Ecological Balance (EB) | + 13,961 | ||||||||||||||||||
| Source: Our elaboration. | |||||||||||||||||||
As can be seen, the LAG agricultural system has the capacity to make a natural capital amount (BCTOT=131,370 gha) greater than the ecological footprint generated by local production activities (EFTOT = 117,419 gha) available. The positive value of the ecological balance (EB = 13,961 gha) signifies a condition of environmental sustainability where available natural resources are not exploited beyond their regenerative capacity.
The BC of cropland represents the most significant component of the overall BC (almost 80%), and it is able to fully sustain the impacts generated by the cultivation activities. A significant aspect that emerged from the analysis is the ability of forests and grazing land to offset approximately 97% of the impact generated by livestock (EFLIV) and other activities (EFOTH).
To explain the outcome of ecological balance more explicitly, the IEP was assessed. Its value, equal to 0.13, shows that every hectare of the LAG agricultural system hectares made available to the community, beyond its agricultural productivity, the natural resources equivalent to 0.13 ha of average Italian forest. This result emphasizes the area’s ability to maintain a positive balance between used and regenerated resources and to actively contribute to the improvement of overall environmental quality. The IEP represents a key parameter for assessing the efficiency with which natural resources are managed by the farming systems as a whole, thus providing a clear picture of the overall sustainability of agricultural practices in the LAG Alto Lazio territory.
Although the topic of socioeconomic marginality has sparked extensive scientific and political debate in recent years, accurately and comprehensively assessing the phenomenon - especially in terms of extent and location - is not an easy task. Moreover, the concept of marginality is highly subjective and, together with the variety of definitions, indicators and methodological approaches used (Peterson and Galbraith, 1932; Csikós and Tóth, 2023), complicates comparisons with similar studies. Marginal areas can emerge in a wide range of socio-ecological systems, from deserts to rainforests, and thus vary in their conceptualization (Lipper et al., 2006). These areas are generally perceived as “limited” in their ability to sustain human activities due to persistent biophysical and/or socioeconomic constraints.
In our study, socioeconomic marginality was assessed using three key indicators, as indicated in the methodology. The results show that Alto Lazio LAG is the area with the highest values for the combination of such key indicators (old age index, population change and per capita income), with a marginality index of 4.27 in the range 1 to 5. This suggests that the region is characterized by a vulnerable economy and a significant social development gap.
In these conditions, especially for the marginal regions where the agricultural sector plays a relevant role, the crops and livestock intensification could be seen as a possible strategy for local socioeconomic development. Nevertheless, it is evident how a similar solution presents significant environmental risks. Indeed, the practices for rising agricultural productivity with the aim of greater profitability often lead to increase exploitation of natural resources, with intensive use of pesticides and fertilizers, with harmful consequences for local ecosystems (Hazell and Wood, 2008; Barbier, 2010). In this sense, marginal areas are not only land to be exploited, but places with a precious biological capacity that must be used in a sustainable way (Sallustio et al., 2018). Agricultural activity in marginal areas should be view from this perspective, considering how productive techniques, crop selection and human-environment relationships pose tangible problems in terms of environmental impact (Kanianska, 2016).
Referring to LAG Alto Lazio, the value of the ecological balance gives a positive result, highlighting how the heterogeneity of land covers and the presence of forested and semi-natural areas within the agricultural land are essential not only biodiversity conservation but also for ensuring the sustainability of farming systems. This outcome of our case study suggests how marginal areas are often characterized by a land use pattern that can advantage the environmental sustainability of local agricultural system. Several studies have discussed the relationships between marginality and environmental issues, such as water quality, soil degradation, biodiversity and climate change mitigation (Fisher et al., 2002; O’Connor et al., 2005; Searchinger et al., 2008; Kang et al., 2013b). Even if these studies raise concerns about the environmental risks linked to some fragility in land use in marginal areas, the outcome of our study clearly indicates that the combination of marginality and sustainable agriculture should not be seen as separate concepts, but rather as two sides of the same coin. While marginal areas present significant challenges, they also offer opportunities for more ecological and resilient agriculture. Therefore, our study confirms that agriculture can play two basic roles: as a producer of agricultural goods and as a custodian of the ecosystem.
By improving sustainable agricultural practices, production can be optimized while minimizing environmental impact. This approach not only helps protect natural capital, but also promotes economic and social development in rural areas, creating a virtuous circle that benefits both local communities and the ecosystem at large. Furthermore, environmental sustainability can be seen as a branding strategy, also at territorial level, with the result that consumers will tend to perceive brands as adding value to the product and their place of origin (Nakaishi and Chapman, 2024). The effects of this strategic leverage have been analyzed in several studies, showing how integrating sustainability into branding increases consumers’ willingness to pay a higher price for the product (Franco and Cicatiello, 2018).
The main aim of this study was to find out how to develop the local economy of marginal areas and thus increase their well-being. We focus on the link between socio-economic marginality and environmental sustainability and find that in the literature there are many examples of marginal areas that are also environmentally sustainable.
As agriculture is often the main productive activity in marginal areas, promoting sustainable agricultural practices can be the key both to increase the value of local food production and strengthen the overall identity of the territory. This approach not only protects the natural capital, but also promotes the resilience of rural communities.
We chose the Alto Lazio LAG as a case study due to its high socio-economic marginality and the type of governance that allows political intervention. We then evaluated the environmental sustainability of the LAG agricultural system using an environmental balance approach and came to positive conclusions. Breeding activities, that generally have a high impact on environmental sustainability, are present in this marginal area, but other agricultural production combined with a good management system clearly compensate for this and achieve a positive ecological balance.
Marginal areas possess the potential for sustainable production and self-development without adversely affecting the ecosystem, particularly through the implementation of virtuous local production systems exemplified by the Alto Lazio LAG. Consequently, it can be stated that this agricultural model is commendable; if local authorities promote and enhance it, it could serve as an effective mechanism to bridge the development gap in marginal areas while simultaneously safeguarding the environment.
The study also focused on identifying opportunities for sustainability claims and certification processes that could enhance the value of local agriculture and food production. This tool is needed to effectively convey to consumers, in a clear and quantifiable manner, the beneficial impact of local agricultural production systems on the environment.
The promotion of agricultural sustainability, fully respecting ecosystem limits, if accompanied by a recognized certification and resulting from the active involvement of stakeholders, can serve as a strategic lever for the economic development of local agricultural production. This approach not only strengthens territorial competitiveness but also helps to create a more inclusive and environmentally respectful growth model.
We are aware of the limits of our results, due to a partial accounting for the territory sustainability, since we considered only the agricultural production system. Furthermore, implementation challenges might arise due to potential discrepancies between the overarching territorial vision and its practical application at the individual farm level.
Further investigations are necessary, incorporating a stakeholder engagement process that involves local policymakers and relevant actors. This approach aims to elucidate their vision of development while emphasizing the potential costs and benefits associated with the transition.
This study was carried out within the Agritech National Research Center and received funding from the European Union Next-GenerationEU (Piano Nazionale di Ripresa e Resilienza (PNRR) – Missione 4 Componente 2, Investimento 1.4 – D.D. 1032 17/06/2022, CN00000022). This manuscript reflects only the authors’ views and opinions, neither the European Union nor the European Commission can be considered responsible for them.
Aguilera-Cora, E., Fernández-Cavia, J., Codina, L. (2024). Place branding and sustainable development: a scoping review. Place Brand Public Diplomacy.
Ahmadzai, H., Tutundjian, S., Elouafi, I. (2021). Policies for Sustainable Agriculture and Livelihood in Marginal Lands: A Review. Sustainability, 13, 8692.
Arshad, M.N., Donnison, I., Rowe, R.L. (2021). Marginal lands: Concept, classification criteria and management, Supergen Bioenergy Hub report no. 02/2021.
Balzan, M.V., Caruana, J., Zammit, A. (2018). Assessing the capacity and flow of ecosystem services in multifunctional landscapes: Evidence of a rural-urban gradient in a Mediterranean small island state. Land Use Policy, 75, 711-725.
Banini, T.; Pollice, F. (2015). Territorial identity as a strategic resource for the development of rural areas. In Semestrale di Studi e Ricerche di Geografia XXVII; Sapienza University: Rome, Italy ; Volume 1.
Barbier, E.B. (2010). Poverty, development, and environment. Environment and Development Economics, 15(6), 635-660.
Basile, G., Cavallo, A. (2020). Rural Identity, Authenticity, and Sustainability in Italian Inner Areas. Sustainability, 12(3), 1272.
Biagetti, E., Gislon, G., Martella, A., Zucali, M., Bava, L., Franco, S., Sandrucci, A. (2023a). Comparison of the use of life cycle assessment and ecological footprint methods for evaluating environmental performances in dairy production. Science of The Total Environment, 905, 166845.
Biagetti, E., Pancino, B., Martella, A., La Porta, I.M., Cicatiello, C., De Gregorio, T., Franco, S. (2023b). Is Hazelnut Farming Sustainable? An Analysis in the Specialized Production Area of Viterbo. Sustainability, 15, 10702.
Borucke, M., Moore, D., Cranston, G., Gracey K., Iha, K., Larson. J., Lazarus, E., Morales, J.C., Wackernagel, M., Galli, A. (2013). Accounting for demand and supply of the biosphere’s regenerative capacity: the National Footprint Accounts’ underlying methodology and framework. Ecological Indicators, 24, 518-533
Carrosio, G., Osti, G. (2017). Le aree marginali, Barbera, F., Pais I., Fondamenti di sociologia economica, Egea, Milano, 303-316.
Cerutti, A.K., Beccaro, G.L., Bagliani, M., Donno, D., Bounous, G. (2013). Multifunctional Ecological Footprint Analysis for assessing eco-efficiency: a case study of fruit production systems in Northern Italy. Journal of Cleaner Production, 40, 108-117.
Coderoni, S., Bonati, G., Longhitano, D., Papaleo, A., Vanino, S. (2013). Impronta carbonica aziende agricole italiane. Aspetti orizzontali.
Covino, R. (2017). Aree interne: una “marginalità” che parla al futuro. Geotema, 55, 89-91.
Csikós, N., Tóth, G. (2023). Concepts of agricultural marginal lands and their utilisation: A review. Agricultural Systems, 204, 103560.
De Toni, A., Vizzarri, M., Di Febbraro, M., Lasserre, B., Noguera, J., Di Martino, P. (2021). Aligning Inner Peripheries with rural development in Italy: Territorial evidence to support policy contextualization. Land Use Policy, 100, 104899.
FADN (2024). Italian FADN database (available on https://bancadatirica.crea.gov.it (accessed in June 2024).
FAO STAT Database (2024). Available online: https://www.fao.org/faostat/en/#data
Fisher, G., Van Velthuizen, H.T., Shah, M.M., Nachtergaele, F.O. (2002). Global agro-ecological assessment for agriculture in the 21st century: methodology and results. IIASA, FAO.
Franco, S. (2021a). La sostenibilità ambientale in agricoltura: l’approccio dell’economia ecologica. Agriregionieuropa, 2.
Franco S. (2021b). Assessing the environmental sustainability of local agricultural systems: How and why. Current Research in Environmental Sustainability, 3, 100028.
Franco, S., Cicatiello, C. (2018). The Role of Food Marketing in Increasing Awareness of Food Security and Sustainability: Food Sustainability Branding in Encyclopedia of Food Security and Sustainability, 3, 27-31.
Galli, A., (2015). On the rationale and policy usefulness of ecological footprint accounting: the case of Morocco. Environmental Science & Policy, 48, 210-224.
Galli, A., Wackernagel, M., Iha, K., Lazarus, E. (2014). Ecological footprint: Implications for biodiversity. Biological Conservation, 173, 121-132.
GFN Global Footprint Network, Open Data Platform (2024). Available online: https://www.footprintnetwork
Hazell P., Wood S. (2008). Drivers of change in global agriculture. Philos Trans R Soc Lond B Biol Sci, 363 (1491) 495–515.
ISTAT (2024a). Istat Censimento popolazione residente (2024). Available online: https://esploradati.istat.it/databrowser/#/it/dw/categories/IT1,POP,1.0/POP_POPULATION/DCIS_POPRES1/IT1,22_289_DF_DCIS_POPRES1_24,1.0.
ISTAT (2024b). Istat 7° Censimento Generale dell’agricoltura (2020). Available online: https://esploradati.istat.it/databrowser/#/it/censimentoagricoltura (accessed in June 2024).
Kang, S., Post, W.M., Nichols, J.A., Wang, D., West, T.O., Bandaru, V., Izaurralde, R.C. (2013a) Marginal Lands: Concept, Assessment and Management. Journal of Agricultural Sciences, 5(5), 129-139.
Kang, S., Post W.M., Wang D., Nichols J., Bandaru V., West T. (2013b). Hierarchical marginal land assessment for land use planning. Land Use Policy, 30(1), 106-113.
Kanianska, R. (2016). Agriculture and its impact on land-use, environment, and ecosystem services. Landscape ecology - The influences of land use and anthropogenic impacts of landscape creation, 1-26.
Kitzes, J., Wackernagel, M. (2009). Answer to common questions in Ecological Footprint accounting. Ecological Indicators, 9, 812-817.
Lipper, L., Pingali, P., Zurek, M. (2006). Less-favoured areas: looking beyond agriculture towards ecosystem services. Sustainable poverty reduction in less-favoured areas. Wallingford UK: CABI, 442-460.
Lucas, K. (2012). Transport and social exclusion: Where are we now? Transport Policy, 20, 105-113.
Malikova, L., Farrel, M., McDonagh, J. (2016). Perception of marginality and peripherality in an irish rural context. Quaestiones geographicae, 35(4), 93-105.
Mancini, M. S., Galli, A., Niccolucci, V., Lin, D., Bastianoni, S., Wackernagel, M., & Marchettini, N. (2016). Ecological footprint: refining the carbon footprint calculation. Ecological Indicators, 61, 390-403.
Martella, A., La Porta, I. M., Nicastro, M., Biagetti, E., Franco, S. (2023). Ecological Balance of Agri-Food Supply Chains—The Case of the Industrial Tomato. Sustainability, 15(10), 7846.
Meini, M., Di Felice, G., Nocera, R. (2017). Mappare le risorse delle aree interne: potenzialità e criticità per la fruizione turistica, Bollettino dell’Associazione Italiana di Cartografia, EUT Edizioni Università di Trieste.
Ministero dell’Economia e delle Finanze (2024). Redditi e principali variabili Irpef su base comunale. Available online: https://www1.finanze.gov.it/finanze/analisi_stat/public/index.php?search_class%5b0%5d=cCOMUNE&opendata=yes.
Moldan, B.; Janoušková, S.; Hák, T. (2012). How to Understand and Measure Environmental Sustainability: Indicators and Targets. Ecological Indicators, 17, 4-13.
Nakaishi, T., Chapman, A. (2024). Eco-labels as a communication and policy tool: a comprehensive review of academic literature and global label initiatives. Renewable and Sustainable Energy Reviews, 202, 114708.
Neumayer, E. (2013). Weak Versus Strong Sustainability: Exploring the Limits of Two Opposing Paradigms, 4th ed.; Edward Elgar: Cheltenham, UK.
Niccolucci, V., Galli, A., Kitzes, J., Pulselli, R.M., Borsa, S., Marchettini, N. (2008). Ecological Footprint Analysis Applied to the Production of Two Italian Wines. Agriculture, Ecosystems and Environment, 128, 162-166.
O’ Connor, G.A., Elliott, H.A., Basta, N.T., Bastian, R.K., Pierzynski, G.M., Sims, R.C., Smith, J.E. (2005). Sustainable land application: An overview. Journal of Environmental Quality, 34(1), 7-17.
OECD/European Commission (2020). Cities in the World: A New Perspective on Urbanisation, OECD Urban Studies, OECD Publishing, Paris.
Passeri, N., Borucke, M., Blasi, E., Franco, S., Lazarus, E. (2013). The influence of farming technique on cropland: a new approach for the Ecological Footprint. Ecological Indicators, 29, 1-5.
Peterson, G.M., Galbraith, J.K. (1932). The concept of marginal land. Journal of Farm Economics, 14(2), 295-310.
Pingali, P., Schneider K., Zurek, M. (2014). Poverty, Agriculture and the Environment: The Case of Sub-Saharan Africa. Von Braun, J., Gatzweiler, F., W., (Eds) Marginality: Addressing the Nexus of Poverty, Exclusion and Ecology, Springer Open, 151-168.
Sallustio, L., Pettenella, D., Merlini, P., Romano, R., Salvati, L., Marchetti, M., Corona, P. (2018). Assessing the economic marginality of agricultural lands in Italy to support land use planning. Land Use Policy, 76, 526-534.
Searchinger, T., Heimlich, R., Houghton, R.A., Dong, F., Elobeid, A., Fabiosa, J., Yu, T.H. (2008). Use of US croplands for biofuels increases greenhouse gases through emissions from land-use change. Science, 319(5867), 1238-1240.
Sotte, F. (2016). Scenari evolutivi del concetto di ruralità, in Paesaggi del Cibo, Atti della Summer School Emilio Sereni 2015, Gattatico.
Vendemmia, B., Pucci, P., Beria, P. (2021). An institutional periphery in discussion. Rethinking the inner areas in Italy. Applied Geography, 135, 102537.
Wackernagel, M., Rees, W.E., (1996). Our Ecological Footprint: Reducing Human Impact on the Earth. New Society Publishers, Gabriola Island, Canada.
| Municipality | Old-age index | IAGE | Depop. rate | IDEP | Income per capita | IINC | IMAR | ||||||||||||
|---|---|---|---|---|---|---|---|---|---|---|---|---|---|---|---|---|---|---|---|
| Acquapendente | 3,11 | 5 | -8,9% | 4 | 13.117 | 2 | 4 | ||||||||||||
| Arlena di Castro | 3,21 | 5 | -2,9% | 3 | 11.001 | 4 | 4 | ||||||||||||
| Bagnoregio | 3,35 | 5 | -6,7% | 4 | 13.025 | 2 | 4 | ||||||||||||
| Barbarano Romano | 3,55 | 5 | 5,5% | 2 | 13.146 | 2 | 3 | ||||||||||||
| Bassano in Teverina | 2,77 | 4 | 11,7% | 2 | 12.075 | 3 | 3 | ||||||||||||
| Bassano Romano | 2,50 | 4 | 7,7% | 2 | 12.352 | 3 | 3 | ||||||||||||
| Blera | 2,48 | 3 | -7,1% | 4 | 12.143 | 3 | 3 | ||||||||||||
| Bolsena | 3,97 | 5 | -9,7% | 4 | 12.119 | 3 | 4 | ||||||||||||
| Bomarzo | 2,26 | 3 | 4,0% | 3 | 12.406 | 3 | 3 | ||||||||||||
| Calcata | 1,99 | 2 | 6,6% | 2 | 10.386 | 5 | 3 | ||||||||||||
| Canepina | 2,22 | 3 | -5,6% | 4 | 11.665 | 4 | 4 | ||||||||||||
| Canino | 2,44 | 3 | -0,7% | 3 | 10.806 | 5 | 4 | ||||||||||||
| Capodimonte | 3,87 | 5 | -0,9% | 3 | 14.215 | 1 | 3 | ||||||||||||
| Capranica | 1,91 | 2 | 13,1% | 2 | 11.795 | 4 | 3 | ||||||||||||
| Caprarola | 2,22 | 3 | -0,7% | 3 | 11.502 | 4 | 3 | ||||||||||||
| Carbognano | 1,86 | 2 | 1,3% | 3 | 10.980 | 5 | 3 | ||||||||||||
| Castel Sant’Elia | 1,86 | 2 | 14,1% | 2 | 10.578 | 5 | 3 | ||||||||||||
| Castiglione in Teverina | 2,16 | 3 | 0,6% | 3 | 11.933 | 4 | 3 | ||||||||||||
| Celleno | 2,55 | 4 | -2,2% | 3 | 12.290 | 3 | 3 | ||||||||||||
| Cellere | 4,02 | 5 | -17,7% | 5 | 11.138 | 4 | 5 | ||||||||||||
| Civita Castellana | 2,23 | 3 | 0,5% | 3 | 12.491 | 3 | 3 | ||||||||||||
| Civitella d’Agliano | 3,33 | 5 | -16,8% | 5 | 12.100 | 3 | 4 | ||||||||||||
| Corchiano | 1,86 | 2 | 7,5% | 2 | 10.307 | 5 | 3 | ||||||||||||
| Fabrica di Roma | 1,74 | 2 | 23,5% | 1 | 11.716 | 4 | 2 | ||||||||||||
| Faleria | 2,29 | 3 | 15,2% | 1 | 11.778 | 4 | 3 | ||||||||||||
| Farnese | 4,25 | 5 | -19,4% | 5 | 11.924 | 4 | 5 | ||||||||||||
| Gallese | 2,65 | 4 | -6,5% | 4 | 12.105 | 3 | 4 | ||||||||||||
| Gradoli | 4,49 | 5 | -16,3% | 5 | 11.607 | 4 | 5 | ||||||||||||
| Graffignano | 2,67 | 4 | -7,9% | 4 | 11.759 | 4 | 4 | ||||||||||||
| Grotte di Castro | 3,82 | 5 | -20,2% | 5 | 13.389 | 2 | 4 | ||||||||||||
| Ischia di Castro | 2,92 | 4 | -13,2% | 4 | 10.966 | 5 | 4 | ||||||||||||
| Latera | 6,23 | 5 | -25,0% | 5 | 12.063 | 3 | 4 | ||||||||||||
| Lubriano | 2,70 | 4 | -6,2% | 4 | 11.970 | 4 | 4 | ||||||||||||
| Marta | 2,83 | 4 | -5,8% | 4 | 12.261 | 3 | 4 | ||||||||||||
| Montalto di Castro | 2,21 | 3 | 14,0% | 2 | 12.649 | 3 | 3 | ||||||||||||
| Monte Romano | 2,06 | 3 | -3,5% | 3 | 13.569 | 2 | 3 | ||||||||||||
| Montefiascone | 2,41 | 3 | 2,6% | 3 | 13.181 | 2 | 3 | ||||||||||||
| Monterosi | 1,32 | 1 | 102,1% | 1 | 11.677 | 4 | 2 | ||||||||||||
| Nepi | 1,79 | 2 | 20,2% | 1 | 11.762 | 4 | 2 | ||||||||||||
| Onano | 3,33 | 5 | -23,6% | 5 | 10.215 | 5 | 5 | ||||||||||||
| Oriolo Romano | 2,13 | 3 | 27,4% | 1 | 12.464 | 3 | 2 | ||||||||||||
| Orte | 1,71 | 2 | 16,6% | 1 | 13.055 | 2 | 2 | ||||||||||||
| Piansano | 3,69 | 5 | -13,2% | 4 | 11.898 | 4 | 4 | ||||||||||||
| Proceno | 5,89 | 5 | -17,6% | 5 | 12.032 | 3 | 4 | ||||||||||||
| Ronciglione | 2,32 | 3 | 13,2% | 2 | 12.232 | 3 | 3 | ||||||||||||
| San Lorenzo Nuovo | 3,21 | 5 | -2,6% | 3 | 12.001 | 3 | 4 | ||||||||||||
| Soriano nel Cimino | 2,50 | 3 | -2,8% | 3 | 11.728 | 4 | 3 | ||||||||||||
| Sutri | 2,40 | 3 | 32,0% | 1 | 12.959 | 3 | 2 | ||||||||||||
| Tarquinia | 2,32 | 3 | 5,7% | 2 | 13.901 | 2 | 2 | ||||||||||||
| Tessennano | 5,39 | 5 | -33,1% | 5 | 11.961 | 4 | 5 | ||||||||||||
| Tuscania | 2,31 | 3 | 6,6% | 2 | 11.788 | 4 | 3 | ||||||||||||
| Valentano | 2,91 | 4 | -5,7% | 4 | 13.297 | 2 | 3 | ||||||||||||
| Vallerano | 2,54 | 4 | -3,7% | 3 | 11.724 | 4 | 4 | ||||||||||||
| Vasanello | 1,96 | 2 | 2,4% | 3 | 12.322 | 3 | 3 | ||||||||||||
| Vejano | 2,51 | 4 | 3,0% | 3 | 12.715 | 3 | 3 | ||||||||||||
| Vetralla | 2,09 | 3 | 11,6% | 2 | 12.292 | 3 | 3 | ||||||||||||
| Vignanello | 2,38 | 3 | -8,8% | 4 | 10.664 | 5 | 4 | ||||||||||||
| Villa San Giovanni in T. | 2,97 | 4 | 3,4% | 3 | 12.668 | 3 | 3 | ||||||||||||
| Viterbo | 2,02 | 3 | 11,6% | 2 | 14.440 | 1 | 2 | ||||||||||||
| Vitorchiano | 1,18 | 1 | 63,2% | 1 | 13.619 | 2 | 1 | ||||||||||||
| Source: Our elaboration on ISTAT (2024a) and MF (2023). | |||||||||||||||||||
| Municipality | IMAR | A1 | A2 | A3 | A4 | A5 | A6 | A7 | A8 | A9 | A10 | A11 | |||||||
|---|---|---|---|---|---|---|---|---|---|---|---|---|---|---|---|---|---|---|---|
| Acquapendente | 4 | 1 | 1 | 0 | 0 | 1 | 0 | 0 | 0 | 0 | 1 | 0 | |||||||
| Arlena di Castro | 4 | 1 | 0 | 0 | 0 | 1 | 0 | 0 | 0 | 0 | 0 | 0 | |||||||
| Bagnoregio | 4 | 0 | 1 | 0 | 0 | 0 | 1 | 0 | 0 | 0 | 0 | 0 | |||||||
| Barbarano Romano | 3 | 0 | 0 | 0 | 0 | 0 | 0 | 0 | 0 | 1 | 0 | 0 | |||||||
| Bassano in Teverina | 3 | 0 | 0 | 0 | 0 | 0 | 0 | 0 | 0 | 0 | 0 | 0 | |||||||
| Bassano Romano | 3 | 0 | 0 | 0 | 0 | 0 | 0 | 0 | 0 | 1 | 0 | 0 | |||||||
| Blera | 3 | 0 | 0 | 0 | 0 | 0 | 0 | 0 | 0 | 1 | 0 | 0 | |||||||
| Bolsena | 4 | 1 | 1 | 0 | 0 | 0 | 1 | 0 | 0 | 0 | 0 | 0 | |||||||
| Bomarzo | 3 | 0 | 0 | 0 | 0 | 0 | 1 | 0 | 0 | 0 | 0 | 0 | |||||||
| Calcata | 3 | 0 | 0 | 0 | 1 | 0 | 0 | 0 | 1 | 0 | 0 | 0 | |||||||
| Canepina | 4 | 0 | 0 | 0 | 1 | 0 | 0 | 1 | 0 | 0 | 0 | 1 | |||||||
| Canino | 4 | 1 | 1 | 0 | 0 | 1 | 0 | 0 | 0 | 0 | 0 | 0 | |||||||
| Capodimonte | 3 | 1 | 1 | 0 | 0 | 0 | 1 | 0 | 0 | 0 | 0 | 0 | |||||||
| Capranica | 3 | 0 | 0 | 0 | 0 | 0 | 0 | 1 | 0 | 0 | 0 | 1 | |||||||
| Caprarola | 3 | 0 | 0 | 0 | 0 | 0 | 0 | 1 | 0 | 0 | 0 | 1 | |||||||
| Carbognano | 3 | 0 | 0 | 0 | 0 | 0 | 0 | 1 | 0 | 0 | 0 | 1 | |||||||
| Castel Sant’Elia | 3 | 0 | 0 | 0 | 1 | 0 | 0 | 0 | 1 | 0 | 0 | 0 | |||||||
| Castiglione in Teverina | 3 | 0 | 0 | 0 | 0 | 0 | 1 | 0 | 0 | 0 | 0 | 0 | |||||||
| Celleno | 3 | 0 | 1 | 0 | 0 | 0 | 1 | 0 | 0 | 0 | 0 | 0 | |||||||
| Cellere | 5 | 1 | 1 | 0 | 0 | 1 | 0 | 0 | 0 | 0 | 0 | 0 | |||||||
| Civita Castellana | 3 | 0 | 0 | 0 | 1 | 0 | 0 | 0 | 1 | 0 | 0 | 0 | |||||||
| Civitella d’Agliano | 4 | 0 | 0 | 0 | 0 | 0 | 1 | 0 | 0 | 0 | 0 | 0 | |||||||
| Corchiano | 3 | 0 | 0 | 0 | 1 | 0 | 0 | 0 | 1 | 0 | 0 | 0 | |||||||
| Fabrica di Roma | 2 | 0 | 0 | 0 | 1 | 0 | 0 | 0 | 1 | 0 | 0 | 0 | |||||||
| Faleria | 3 | 0 | 0 | 0 | 1 | 0 | 0 | 0 | 1 | 0 | 0 | 0 | |||||||
| Farnese | 5 | 1 | 1 | 0 | 0 | 1 | 0 | 0 | 0 | 0 | 0 | 0 | |||||||
| Gallese | 4 | 0 | 0 | 0 | 1 | 0 | 0 | 0 | 1 | 0 | 0 | 0 | |||||||
| Gradoli | 5 | 1 | 1 | 0 | 0 | 1 | 0 | 0 | 0 | 0 | 1 | 0 | |||||||
| Graffignano | 4 | 0 | 0 | 0 | 0 | 0 | 1 | 0 | 0 | 0 | 0 | 0 | |||||||
| Grotte di Castro | 4 | 1 | 1 | 0 | 0 | 1 | 0 | 0 | 0 | 0 | 1 | 0 | |||||||
| Ischia di Castro | 4 | 1 | 1 | 0 | 0 | 1 | 0 | 0 | 0 | 0 | 0 | 0 | |||||||
| Latera | 4 | 1 | 1 | 0 | 0 | 1 | 0 | 0 | 0 | 0 | 1 | 0 | |||||||
| Lubriano | 4 | 0 | 0 | 0 | 0 | 0 | 1 | 0 | 0 | 0 | 0 | 0 | |||||||
| Marta | 4 | 1 | 1 | 0 | 0 | 0 | 1 | 0 | 0 | 0 | 0 | 0 | |||||||
| Montalto di Castro | 3 | 1 | 0 | 0 | 0 | 0 | 0 | 0 | 0 | 0 | 0 | 0 | |||||||
| Monte Romano | 3 | 0 | 0 | 1 | 0 | 0 | 0 | 0 | 0 | 0 | 0 | 0 | |||||||
| Montefiascone | 3 | 1 | 1 | 0 | 0 | 0 | 1 | 0 | 0 | 0 | 0 | 0 | |||||||
| Monterosi | 2 | 0 | 0 | 0 | 0 | 0 | 0 | 0 | 0 | 0 | 0 | 0 | |||||||
| Nepi | 2 | 0 | 0 | 0 | 1 | 0 | 0 | 0 | 1 | 0 | 0 | 0 | |||||||
| Onano | 5 | 1 | 0 | 0 | 0 | 1 | 0 | 0 | 0 | 0 | 1 | 0 | |||||||
| Oriolo Romano | 2 | 0 | 0 | 0 | 0 | 0 | 0 | 0 | 0 | 1 | 0 | 0 | |||||||
| Orte | 2 | 0 | 0 | 0 | 1 | 0 | 0 | 0 | 1 | 0 | 0 | 0 | |||||||
| Piansano | 4 | 1 | 1 | 0 | 0 | 1 | 0 | 0 | 0 | 0 | 0 | 0 | |||||||
| Proceno | 4 | 1 | 0 | 0 | 0 | 1 | 0 | 0 | 0 | 0 | 1 | 0 | |||||||
| Ronciglione | 3 | 0 | 0 | 0 | 0 | 0 | 0 | 1 | 0 | 0 | 0 | 1 | |||||||
| San Lorenzo Nuovo | 4 | 1 | 1 | 0 | 0 | 1 | 0 | 0 | 0 | 0 | 1 | 0 | |||||||
| Soriano nel Cimino | 3 | 0 | 0 | 0 | 0 | 0 | 0 | 0 | 0 | 0 | 0 | 1 | |||||||
| Sutri | 2 | 0 | 0 | 0 | 0 | 0 | 0 | 1 | 0 | 0 | 0 | 0 | |||||||
| Tarquinia | 2 | 1 | 0 | 1 | 0 | 0 | 0 | 0 | 0 | 0 | 0 | 0 | |||||||
| Tessennano | 5 | 1 | 0 | 0 | 0 | 1 | 0 | 0 | 0 | 0 | 0 | 0 | |||||||
| Tuscania | 3 | 1 | 0 | 0 | 0 | 0 | 0 | 0 | 0 | 0 | 0 | 0 | |||||||
| Valentano | 3 | 1 | 1 | 0 | 0 | 1 | 0 | 0 | 0 | 0 | 1 | 0 | |||||||
| Vallerano | 4 | 0 | 0 | 0 | 1 | 0 | 0 | 1 | 0 | 0 | 0 | 1 | |||||||
| Vasanello | 3 | 0 | 0 | 0 | 1 | 0 | 0 | 0 | 1 | 0 | 0 | 0 | |||||||
| Vejano | 3 | 0 | 0 | 0 | 0 | 0 | 0 | 0 | 0 | 1 | 0 | 0 | |||||||
| Vetralla | 3 | 0 | 0 | 0 | 0 | 0 | 0 | 1 | 0 | 0 | 0 | 1 | |||||||
| Vignanello | 4 | 0 | 0 | 0 | 1 | 0 | 0 | 1 | 0 | 0 | 0 | 1 | |||||||
| Villa San Giovanni in T. | 3 | 0 | 0 | 0 | 0 | 0 | 0 | 0 | 0 | 1 | 0 | 0 | |||||||
| Viterbo | 2 | 0 | 0 | 0 | 0 | 0 | 0 | 0 | 0 | 0 | 0 | 0 | |||||||
| Vitorchiano | 1 | 0 | 0 | 0 | 0 | 0 | 0 | 0 | 0 | 0 | 0 | 1 | |||||||
| Source: Our elaboration. | |||||||||||||||||||