Received: January 29, 2025; Accepted: June 26, 2025; Published: September 30, 2025
Rebuilding strategies for food self-sufficiency: Portugal’s past patterns and future ambitions
1 Center for Interdisciplinary Studies, University of Coimbra, Portugal
2 Center for Interdisciplinary Studies, Faculty of Economics, University of Coimbra, Portugal
3 Centre for Business and Economics Research, Faculty of Economics, University of Coimbra, Portugal
4 Institute for Systems Engineering and Computers at Coimbra, Faculty of Economics, University of Coimbra, Portugal
*Corresponding author. Email: j.alexjoao@gmail.com
Abstract. This study analyses Portugal’s wheat productive capacity, exploring the reasons behind its recent steady decline despite achieving self-sufficiency in the 20th century. Using Multivariate Adaptive Regression Splines (MARS), which proved to be highly effective in the development of forecasting models, the research provides valuable insights for countries facing similar challenges in defining production strategies. By employing this approach, decision-makers can improve resource allocation, ensure food security, and foster a resilient agricultural sector. The findings highlight the importance of understanding wheat production dynamics within the European Union and aligning national strategies with the Union’s goals and policies. The analysis indicates that achieving self-sufficiency is possible, supported by productivity improvements and increased cultivation areas. However, realizing significant production growth demands the adoption of sustainable strategies. This research contributes to shaping informed agricultural policies, enhancing decision-making processes, and promoting a more sustainable and efficient food production system to meet future challenges.
Keywords: wheat production, self-sufficiency, productivity, forecasting models, policy making.
JEL Codes: E21, E23, E27, Q10.
Index
Portuguese productive capacity
The scenario based approach and policy context
Limitations and further research
EEC/EU: European Economic Community/European Union
MARS: Multivariate Adaptive Regression Splines
CAP: Common Agricultural Policy
Cereal production and consumption have been central issues for the world economy. The main similarity between the subsistence bases of ancient states was the fact that their economy was based on cereal production (Scott, 2017). During the second half of the 20th century wheat production and productivity per hectare increased steadily, reflecting its status as the main cereal for human consumption. However, in recent decades, the increases in production of several major cereal crops have slowed down, and in several countries, yields started to stagnate (Michel & Makowski, 2013). To further aggravate this situation, the armed conflict affecting the Ukrainian territory caused international wheat prices to rise to all-time highs. In the case of European countries, this confrontation was especially harsh, given that a lot of countries were dependent on cereals imported from Russia and Ukraine (Zhang et al., 2024). Given the strategic relevance that wheat has in societies, how can each State respond to these domestic supply threats? Departing from the analysis of Portugal, this paper aims to answer a question that is arising in many countries.
The main objective of this study is to analyse historical wheat production and consumption data and to project trends for 2022–2032, in order to find out if Portugal has the capacity to become self-sufficient in wheat production, something that was already achieved in the 20th century, particularly during the “Wheat Campaign”. We adopt the Multivariate Adaptive Regression Splines (MARS) machine learning model, validated in time-series forecasting (Nayana et al., 2022). By employing the predictions resulting from MARS in scenarios with different cultivated areas, we assessed the implications of land use adjustments on future wheat production. Although this study is focused on the Portuguese case, the method employed can be applied to other countries. This scenario-based approach provides informed guidance to policymakers, identifying realistic and sustainable strategies to optimize production efficiency, strengthen national food security and support informed planning based on each country’s production potential.
Portugal was the chosen country because it has been, throughout history, very dependent on the agricultural sector. Furthermore, the country has witnessed periods of self-sufficiency and also of very low levels of self-supply in wheat production. But in recent decades, production has dropped to alarming numbers. If in 1989 the degree of self-supply was around 60%, in 2021 this value had dropped to 6.1%. As a result, Portugal became a country very dependent on imports. In order to invert this trend, the Portuguese government created the National Strategy for the Promotion of Cereal Production (NSPCP), which set self-supply goals in cereal production for the period between 2018 and 2023. The degree of self-supply defined by the NSPCP was 38% for all cereals and 20% for wheat (Barreiros, 2018). Since the NSPCP has already ended, we can confirm that its objectives were not achieved. Regardless, and in order to have defined goals with political relevance, its targets will serve as a basis to build one of the three production scenarios discussed in this study. Two prediction models were developed, one for the per capita consumption and other for the production per hectare.
This study is structured as follows. The next section presents the data collected, as well as the chosen methodology. Section 3 discusses the results, drawing three scenarios for production. Finally, section 4 presents the main conclusions of this study: Self-sufficiency, although difficult to achieve, would still be possible given the area that was once cultivated in Portugal.
This study is based on quantitative data and qualitative information obtained from scientific studies and relevant historical documents. Data is available for the whole Portuguese continental territory, but after a preliminary analysis, we observed that 8 districts (out of 18) were responsible for 92% of the national wheat production from 1920 to 2021. These districts are: Beja, Bragança, Évora, Faro, Lisbon, Portalegre, Santarém and Setúbal (Figure 1). Considering that these districts contributed the most to national production, it is plausible to assume that this trend will continue and consequently, the analysis focuses on them. Unfortunately, some of the data for the districts, like the cultivated area and the climatic variables, were only available from 1943 onwards. So, although at a national level the available data started in 1920, when looking at the district level the available data only considers the period from 1943.
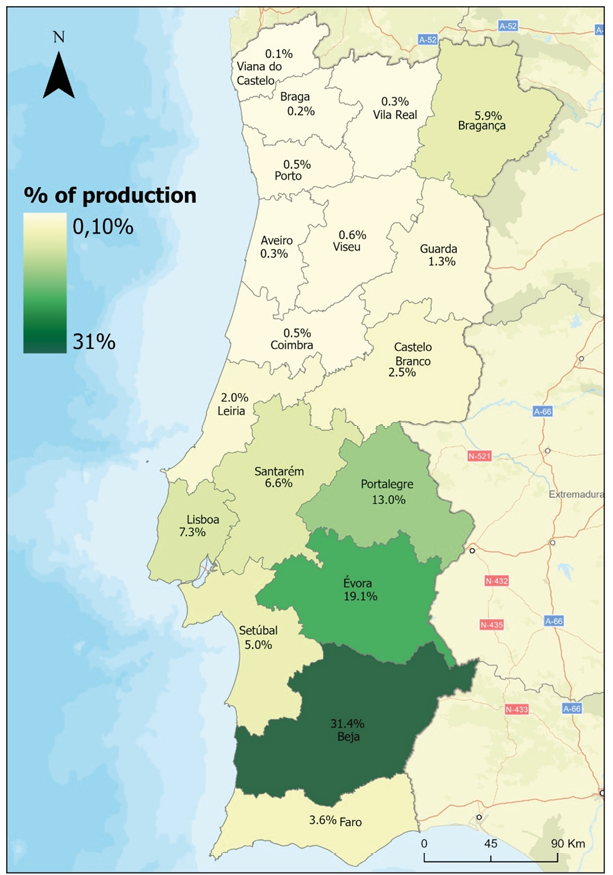
As shown by Figure 1, we can observe the discrepancies in production between the chosen districts and the rest of the country. The districts that completely make up the Alentejo region (Beja, Évora and Portalegre), are the three main contributors and together represent 64% of total production.
We collected data on total consumption, per capita consumption, population, total production, productivity per hectare, cultivated area and climatic variables (temperature and precipitation). The data used in this study were produced by several certified national and international entities: National Statistics Institute (NSI), Portuguese Institute of the Sea and Atmosphere (PISA), United Nations (UN), Climate Portal (CP) and Pordata.
Production values at district level were calculated by Viana et al. (2021). This data required extensive research, since the sources where it was published have different territorial units over the years. Therefore, it was necessary to transform the values so that they were all measured using the same territorial unit. This transformation was done by applying an area-weighting technique that allows the transfer of data from a set of units in the territory to a second set of units, with which the first ones overlap. This method assumes a spatially homogeneous relationship between the source unit and the target unit, meaning that the variable is assumed to be equally distributed across the source unit (Viana et al., 2021). The evolution of wheat production in Portugal has not been consistent over the last century, as can be seen in Figure 2. Although there have been periods in which production has come close to and, in some cases, even exceeded consumption, the insufficiency of national production has been a constant in Portuguese history (Pais et al., 1978; Freire & Lains, 2017). In recent decades, the situation has worsened with production capacity declining at an alarming rate.
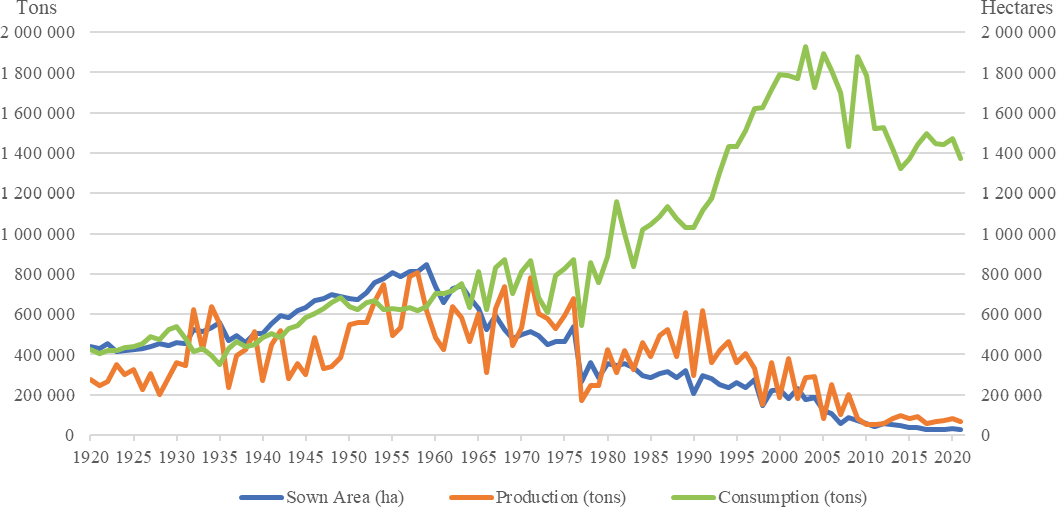
The cultivated area was also calculated by applying the same method used for production and can also be seen in Figure 2. The decrease in cultivated area is pointed out as one of the main reasons why Portugal has seen such large production losses in recent decades. The NSI estimated, for the year of 2022, an area of about 103 thousand hectares dedicated to cereal cultivation, the lowest value in the last 100 years. In comparison, 322 thousand hectares of wheat were cultivated in 1989, a year in which the degree of self-supply reached 60%.
Wheat consumption in Portugal has increased over the last century but has stagnated since the beginning of the 21st century. While the consumption registered in 2021 is below its peak, it is still very high when compared to historical values. It’s important to note that the growth in consumption was achieved through an increase in wheat imports and not production (Freire & Lains, 2017). In our analysis, the consumption values are of total consumption, which include human, animal, and other uses. The evolution of total consumption can also be observed in Figure 2.
The population of each country constitutes another essential variable in this analysis, as it directly affects the calculation of self-supply. Therefore, we collected data on the total Portuguese population at the end of each year between 1920 and 2021. For the period 2022 to 2032, we used the population forecasts available in the United Nations database (Gaigbe-Togbe et al., 2022).
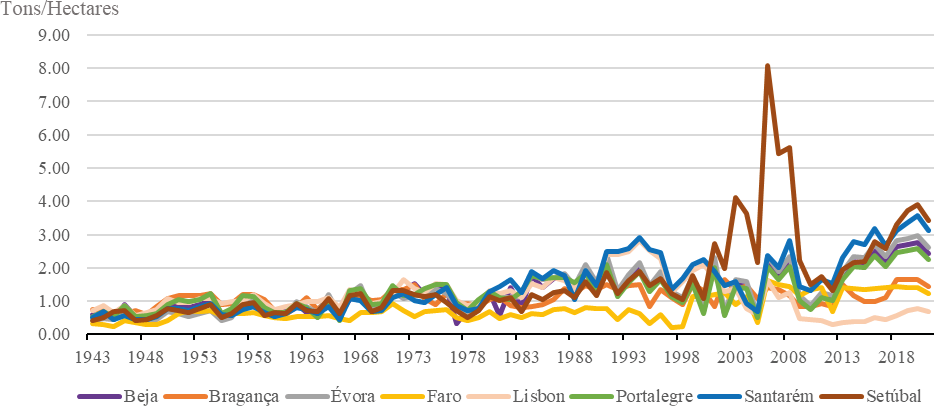
Productivity per hectare is more relevant at district level because it enables us to analyse which districts have the highest yields and where production can be more efficient and profitable. Historically, productivity levels in Portugal have been low, and experts argue that this is mainly due to poor soil and adverse climatic conditions suitable for increasing productive efficiency in a competitive market. In addition, the soils with productive potential have been progressively occupied by more efficient and profitable crops, such as vineyards, olive groves and almond trees (Pais et al., 1978; Faisca 2019). The evolution of productivity per hectare is shown in Figure 3.
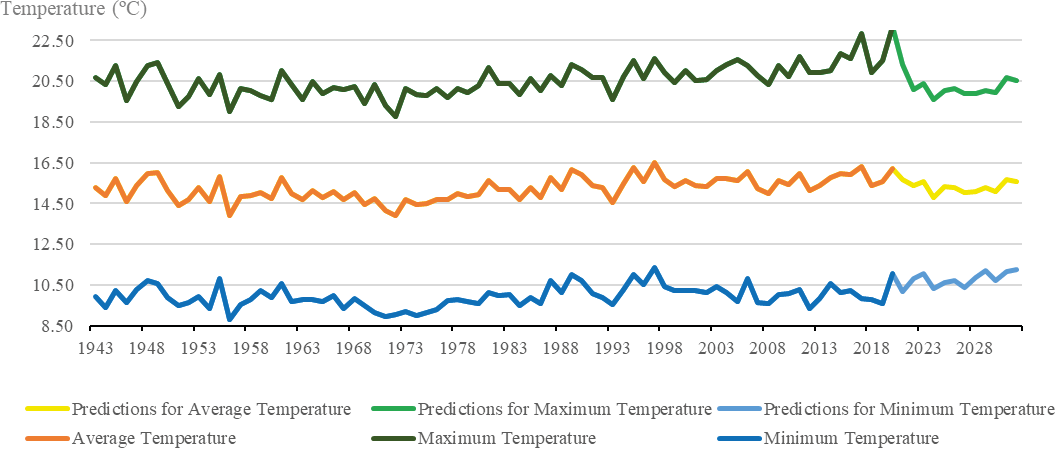
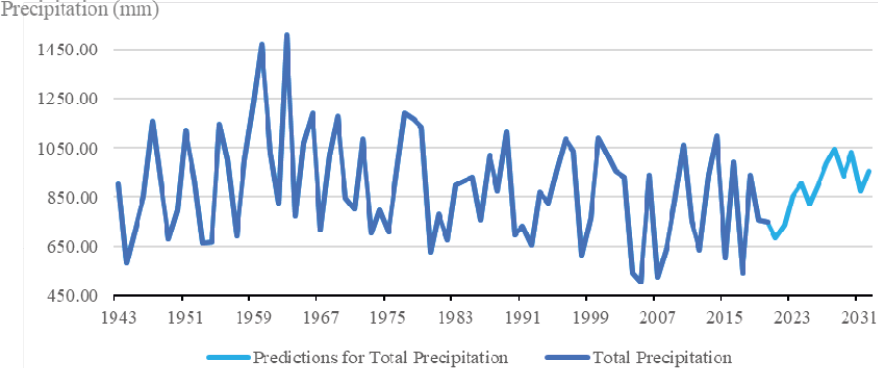
Climatic variables are essential for understanding the performance of agricultural production, as crops are vulnerable to inter-annual climatic variability (Gouveia & Trigo, 2008). Despite technological advances, modern agriculture is still heavily dependent on weather conditions, which poses a significant risk to production due to short-term variability and future climate changes. Jambekar et al. (2018) used data mining techniques to model wheat production in India, showing that climatic variables are one of the main predictive factors. Rocha & Dias (2019) observed that low precipitation and its seasonality distribution can explain as much as 75% of the wheat yield variability. Garrido-Lestache et al. (2005) concluded that the quality of certain varieties of wheat under Mediterranean conditions is mainly affected by precipitation and temperature. We have values for annual temperatures (average, maximum and minimum) and precipitation. These figures cover the period from 1943 to 2021. As we are forecasting future yields, it is also necessary to obtain forecasts for the climatic variables, which are available in the CP database. The data is shown in Figure 4 and Figure 5.
Based on the available data, two different forecasting models were developed: one for production and the other for consumption. It is assumed that future consumption will be influenced mainly by historical consumption and population’s trend. In the case of production, the forecast model includes variables with a direct impact on wheat yield, namely the cultivated area, temperature and precipitation.
The method used in both models was MARS, developed by Friedman, J. (1988). It is similar to linear regression as it aims to model the relationship between the dependent and the independent variables. However, unlike linear regression, which uses a single coefficient to represent the relationship between the variables, MARS uses a series of spline functions, with their own set of parameters to model this relationship. Each spline function represents a segment of the overall relationship, and the combination of these functions can approximate a wide range of non-linear relationships between the predictor variables and the dependent variable. It automatically identifies important interactions in the data which it fits into a model to capture these interactions (Nayana et al., 2022). Its ability to automatically identify and capture complex relationships in the data, especially for situations where the functional form of the relationship is difficult to specify, as well as its ability to handle large data, make it a very useful tool for data modelling and analysis.
The choice of MARS over more conventional methods, such as linear regression or ARIMA, is justified by its demonstrated predictive accuracy and robustness in previous studies, as well as its growing momentum as a tool for developing predictive models in complex data mining applications and challenging scenarios (Nayana et al., 2022). Dias & Rocha (2019) tested different modelling approaches for wheat price forecast in the USA, one of which was MARS, using only past values of the time series. Their study concluded that the most consistent results were obtained with MARS. Nayana et al. (2022) used MARS to predict wheat yield in India. The results showed that MARS was an effective approach for predicting wheat yield, achieving high levels of accuracy. Jambekar et al. (2018) conducted a study aimed at predicting crop production using different data mining techniques in India, exploring datasets containing information on the production of wheat, climatic variables, and area under cultivation. Their results demonstrated that MARS was the most effective technique for predicting crop production. Overall, these studies highlight the growing relevance of MARS in agricultural research, particularly in settings where the underlying data relationships are difficult to specify. Its proven effectiveness reinforces its suitability for the present study, which deals with forecasting under structural and historical complexity. By supporting more accurate predictions, MARS contributes to better-informed decisions in crop management, resource allocation and policy design.
The consumption of a given product depends on many variables, such as price, alternatives, availability and per capita income. Based on the available data and given the lack of additional information allowing a more detailed analysis of the evolution of consumption, it is assumed that the historical values of the series represent, in an integrated manner, the set of variables that influence consumption. Any structural change in the Portuguese economy that has occurred during the period from 1920 to 2021, with a significant impact on the variation in consumption, is reflected in the historical records of total consumption. This approach is therefore considered the most suitable for generating viable and realistic forecasts, within the limitations of the available data. These values can therefore be used as a basis for forecasting values. In other words, MARS was employed to predict per capita consumption using an autoregressive model, which is a model that uses past values of the dependent variable as forecasting variables.
As in any autoregressive model, it is necessary to decide which past values will be considered to estimate the values of the future series (the figure in the future period will be calculated based on known past values from t – n1 to t – n2). The choice of the past values is made automatically by an optimization algorithm that studies the different possibilities, choosing the one that leads to a smaller prediction error considering the data. The sliding window concept is used, in which it is considered that not all the data of the series are known, predicting these values based on the lag interval to be evaluated. As the aim is to estimate the period from 2022 to 2032, while forecasting each year individually, multiple forecasting models were developed, one for each year under analysis. The lagged values that may be the best for predicting consumption figures for next year may not be the best for predicting two years into the future. To create these models, we resorted to existing libraries that implement these methods in the R studio software (Dias & Rocha, 2019). The predictions of the per capita consumption are represented in Figure 6.
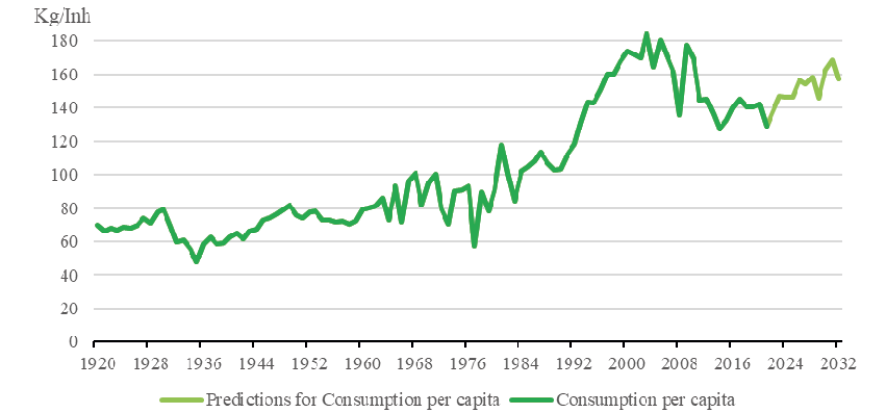
As expected, the predictions point to an increase in per capita consumption. Even with some setbacks and a somewhat uneven evolution, per capita consumption will end 2032 at 156.97 kilos consumed per inhabitant. These values were calculated in kilos per inhabitant, but the total figure is measured in tonnes so that a comparison can be made with production values. Obtaining these values for the per capita consumption forecast and combining them with the population forecast for Portugal, we calculated the value of national consumption, which is presented in Table 1.
| Year | Total consumption (ton) | Population | Per capita consumption (kg/inh) |
||||||||||||||||
|---|---|---|---|---|---|---|---|---|---|---|---|---|---|---|---|---|---|---|---|
| 2022 | 1 411 132 | 10 282 222 | 137.24 | ||||||||||||||||
| 2023 | 1 508 353 | 10 259 508 | 147.02 | ||||||||||||||||
| 2024 | 1 498 097 | 10 235 702 | 146.36 | ||||||||||||||||
| 2025 | 1 493 358 | 10 210 995 | 146.25 | ||||||||||||||||
| 2026 | 1 593 684 | 10 185 237 | 156.47 | ||||||||||||||||
| 2027 | 1 568 546 | 10 158 975 | 154.40 | ||||||||||||||||
| 2028 | 1 606 847 | 10 132 084 | 158.59 | ||||||||||||||||
| 2029 | 1 471 144 | 10 104 703 | 145.59 | ||||||||||||||||
| 2030 | 1 637 633 | 10 076 502 | 162.52 | ||||||||||||||||
| 2031 | 1 692 462 | 10 047 864 | 168.44 | ||||||||||||||||
| 2032 | 1 572 636 | 10 018 702 | 156.97 | ||||||||||||||||
| Source: Based on Data from PorData and UN. | |||||||||||||||||||
We can see that the population in Portugal will decrease over the period analysed, which is in line with the trend of recent decades. Despite this, as we can see from the figures presented, wheat consumption in Portugal is expected to continue to increase. In 2021, national wheat consumption was approximately 1 335 million tonnes. This figure, compared to the range of values forecasted up to 2032, shows that despite the decrease in population, total consumption in Portugal will increase by around 18% over this period.
In the case of the model for productivity per hectare, the use of MARS was applied differently. As mentioned previously, 8 districts accounted for 92% of the production over the last century. Thus, we will estimate the productivity per hectare of these districts individually, providing a way for determining the districts where it is most advantageous to concentrate production.
In our first attempt, we only considered climatic variables as independent variables: annual temperature (average, maximum and minimum) and precipitation. However, these climatic variables were found to have little explanatory power with regard to productivity trends. This might be caused by the fact that only annual values of these variables were included, which is not the most optimal level of aggregation, as it does not allow for capturing monthly values and variations that have a significant impact on output. Additionally, technological and biotechnological innovations in agriculture significantly influence yields and productivity per hectare, a factor that is not captured by climatic variables, highlighting the importance of considering technological change in analysing dynamics of productivity over time.
Different categories of innovation, including mechanical, biological, chemical, agronomic, and computer technologies, have profoundly transformed the structure of the agricultural sector (Sunding & Zilberman, 2001). After the Second World War, there were major advances in mechanization and biological innovations, and fertilizer consumption increased significantly around the world (Federico, 2010). At the beginning of the 21st century, the sector experienced a new technological revolution, driven by advances in biotechnology and precision agriculture (Sunding & Zilberman, 2001). However, while innovation is rightly highlighted as a key driver of productivity growth, it is essential to recognize the practical challenges associated with adopting new technologies, particularly in regions with limited financial resources, aging agricultural populations or underdeveloped infrastructures. This is particularly evident in the Portuguese case, where several authors have shown the historical and structural difficulties in adopting agricultural innovations (Freire & Lains, 2017, Lains et al., 2024). Despite significant transformations in recent decades, Portugal continues to face challenges, which make it more difficult to apply advanced solutions (Soares, 2005). As such, although innovation is a driver of agricultural productivity growth, it is important to always consider the geographical and infrastructural context in which it is implemented.
Given that climatic variables alone could not accurately predict future productivity and assuming that, with the constant advances in innovation, average productivity will continue to increase, it was decided to include the year as an explanatory variable. The inclusion of this variable captures the progressive effect of time on productivity and therefore captures the impact of innovations. By including the year as an independent variable, models with acceptable explanatory power were obtained.
Analysing the results presented in Table 2 reveals that climatic variables have good explanatory power over productivity per hectare in certain districts, such as Bragança, Faro, Lisbon and Santarém. The forecasts displayed in Table 3 indicate a significant increase in productivity per hectare over the period analysed. According to the trends observed, Beja, Évora, Portalegre, Santarém and Setúbal are the districts with the biggest increases. Not coincidentally, they are all neighbours and belong to the Ribatejo and Alentejo regions, located in the south of Portugal. On the other hand, the districts of Bragança, Faro and Lisbon show a slower evolution and seem to be entering a period of stagnation or even decline in productivity, as can be seen in the last three years of the series.
| Districts | Explanatory power of climatic variables for predicting productivity | ||||||||||||||||||
|---|---|---|---|---|---|---|---|---|---|---|---|---|---|---|---|---|---|---|---|
| Beja | 74.2% | climatic variables are not significant | |||||||||||||||||
| Bragança | 55.8% | maximum and average temperature are significant | |||||||||||||||||
| Évora | 74.2% | climatic variables are not significant | |||||||||||||||||
| Faro | 76.1% | all climatic variables are significant | |||||||||||||||||
| Lisbon | 84.8% | maximum temperature is significant | |||||||||||||||||
| Portalegre | 64.1% | climatic variables are not significant | |||||||||||||||||
| Santarém | 86.6% | maximum temperature is significant | |||||||||||||||||
| Setúbal | 80.1% | climatic variables are not significant | |||||||||||||||||
| Source: author’s calculation using Rstudio. | |||||||||||||||||||
| Year | Beja | Bragança | Évora | Faro | Lisbon | Portalegre | Santarém | Setúbal | |||||||||||
|---|---|---|---|---|---|---|---|---|---|---|---|---|---|---|---|---|---|---|---|
| 2022 | 3.14 | 1.74 | 3.36 | 1.13 | 0.81 | 2.93 | 3.58 | 4.49 | |||||||||||
| 2023 | 3.32 | 1.81 | 3.55 | 1.42 | 0.53 | 3.09 | 3.63 | 4.84 | |||||||||||
| 2024 | 3.49 | 1.87 | 3.74 | 1.38 | 0.87 | 3.25 | 3.84 | 5.19 | |||||||||||
| 2025 | 3.67 | 1.93 | 3.92 | 1.58 | 0.90 | 3.42 | 3.92 | 5.53 | |||||||||||
| 2026 | 3.85 | 1.99 | 4.11 | 1.44 | 0.93 | 3.58 | 4.06 | 5.88 | |||||||||||
| 2027 | 4.02 | 2.06 | 4.30 | 1.58 | 0.97 | 3.74 | 4.15 | 6.23 | |||||||||||
| 2028 | 4.20 | 2.12 | 4.49 | 1.37 | 1.00 | 3.91 | 4.28 | 6.58 | |||||||||||
| 2029 | 4.38 | 2.18 | 4.67 | 1.63 | 1.03 | 4.07 | 4.37 | 6.93 | |||||||||||
| 2030 | 4.56 | 2.25 | 4.86 | 1.43 | 1.06 | 4.23 | 4.46 | 7.28 | |||||||||||
| 2031 | 4.73 | 2.31 | 5.05 | 1.50 | 1.09 | 4.39 | 4.48 | 7.62 | |||||||||||
| 2032 | 4.91 | 2.37 | 5.24 | 1.19 | 1.02 | 4.56 | 4.59 | 7.97 | |||||||||||
| Source: author’s calculation using Rstudio. | |||||||||||||||||||
This section examines whether it is possible for Portugal to achieve wheat self-sufficiency over the analysed period. To assess this possibility, three different scenarios of cultivated area are considered:
– First scenario: the area in 2021 remains constant;
– Second scenario: the area corresponds to its maximum value since 1943;
– Third scenario: the necessary area to reach the 20% target defined in the NSPCP.
By combining the predicted yields per hectare obtained from MARS with the proposed cultivated area in each of these three scenarios, we can determine the potential for wheat production in Portugal. Table 4 shows the values for the cultivated area for each scenario. In the case of the third scenario, since the sown area was calculated based on the productivity figures predicted for the 2022-2032 period, an average was calculated to provide a single approximate value that represents the area needed to achieve 20% self-supply over the entire period. Table 4 clearly show that Beja stands out as the district with the largest cultivated area across all scenarios, followed by Évora and Portalegre. Lisbon, Setúbal, and Faro consistently show the smallest cultivated areas. The second scenario, which represents the maximum expansion, presents values significantly higher than the other two.
| District | First Scenario | Second Scenario | Third Scenario | ||||||||||||||||
|---|---|---|---|---|---|---|---|---|---|---|---|---|---|---|---|---|---|---|---|
| Beja | 9 787 | 275 363 | 28 967 | ||||||||||||||||
| Bragança | 2 907 | 56 545 | 9 962 | ||||||||||||||||
| Évora | 6 859 | 149 344 | 20 369 | ||||||||||||||||
| Faro | 717 | 65 089 | 3 065 | ||||||||||||||||
| Lisbon | 772 | 71 374 | 2 861 | ||||||||||||||||
| Portalegre | 3 840 | 86 219 | 11 418 | ||||||||||||||||
| Santarém | 1 318 | 64 649 | 4 872 | ||||||||||||||||
| Setúbal | 1 174 | 46 151 | 3 202 | ||||||||||||||||
| Total | 27 374 | 814 734 | 84 717 | ||||||||||||||||
| Source: based on data from the NSI and author’s calculation. | |||||||||||||||||||
Agricultural production dynamics have undergone significant changes over the past decades. In several countries, the area allocated to agriculture has declined and the workforce in the sector has also fallen significantly (Federico, 2010). Portugal has followed this trend, as evidenced by the data from the last few decades. Increasing production depends largely on expanding the agricultural land and as wheat is considered a very demanding crop in terms of natural resources, namely fertile soils, expanding the cultivated area is a huge challenge. In 2021, the area allocated to wheat production in the 8 districts was 27 374 hectares, corresponding to 95% of the entire cultivated area. This number is one of the lowest of the last century, being only higher than the values recorded in 2018 and 2019. The figures for the cultivated area with wheat in 2021 were used to estimate the amount of output that can be achieved.
The production numbers recorded in Table 5 show a continuous increase during the series, which can be attributed to productivity gains driven by innovations, as mentioned earlier. Despite having the third smallest cultivated area in the last century, the increase in production, even with the land remaining constant, demonstrates Portugal’s productive potential. Given that the highest self- supply figure achieved was 8% in 2032, the results show that Portugal does not have the capacity to guarantee 20% self-supply, which means that it cannot meet the target set by the NSPCP. This indicates that Portugal cannot rely exclusively on innovation advances to increase productivity. It is also necessary to look at the possibility of expanding the cultivated area.
| Year | Beja | Bragança | Évora | Faro | Lisbon | Portalegre | Santarém | Setúbal | Total | Self-Supply | |||||||||
|---|---|---|---|---|---|---|---|---|---|---|---|---|---|---|---|---|---|---|---|
| 2022 | 30 730 | 5 058 | 23 048 | 811 | 625 | 11 250 | 4 717 | 5 271 | 81 510 | 5.8% | |||||||||
| 2023 | 32 492 | 5 261 | 24 351 | 1 019 | 409 | 11 865 | 4 783 | 5 682 | 85 861 | 5.7% | |||||||||
| 2024 | 34 155 | 5 436 | 25 655 | 990 | 672 | 12 479 | 5 059 | 6 093 | 90 539 | 6.0% | |||||||||
| 2025 | 35 917 | 5 610 | 26 889 | 1 133 | 695 | 13 132 | 5 165 | 6 492 | 95 033 | 6.4% | |||||||||
| 2026 | 37 679 | 5 785 | 28 193 | 1 033 | 718 | 13 746 | 5 349 | 6 903 | 99 405 | 6.2% | |||||||||
| 2027 | 39 342 | 5 988 | 29 496 | 1 133 | 749 | 14 361 | 5 468 | 7 313 | 103 851 | 6.6% | |||||||||
| 2028 | 41 104 | 6 163 | 30 799 | 983 | 772 | 15 013 | 5 639 | 7 724 | 108 197 | 6.7% | |||||||||
| 2029 | 42 866 | 6 337 | 32 034 | 1 169 | 795 | 15 628 | 5 758 | 8 135 | 112 722 | 7.7% | |||||||||
| 2030 | 44 627 | 6 540 | 33 337 | 1 026 | 818 | 16 242 | 5 876 | 8 546 | 117 013 | 7.1% | |||||||||
| 2031 | 46 291 | 6 715 | 34 640 | 1 076 | 842 | 16 857 | 5 902 | 8 945 | 121 268 | 7.2% | |||||||||
| 2032 | 48 054 | 6 890 | 35 941 | 853 | 787 | 17 510 | 6 050 | 9 357 | 125 442 | 8.0% | |||||||||
| Source: author’s calculation using Rstudio. | |||||||||||||||||||
In the second scenario, production was calculated based on the largest sown area recorded since 1943. Once again, the districts of Beja, Évora and Portalegre recorded the largest areas, while the districts with the smallest were Bragança and Setúbal. The sum of the figures presented in Table 4 corresponds to 814 734 hectares, a figure higher than that recorded at the peak of the Wheat Campaign, when self-sufficiency was achieved. The importance of mentioning the Wheat Campaign lies in the fact that it was the period in which the highest levels of self-sufficiency were achieved, demonstrating that it is possible to place Portugal in a comfortable situation in terms of domestic supply.
Following the public policies applied by fascist Italy, the Portuguese government launched the Wheat Campaign in 1929. It was established due to two main factors: the insufficiency of national production to meet consumption needs and the implementation of protectionist policies by the countries to which Portugal depended on for its supply (Freire, 2008). The measures implemented were successful in the sense that, between the years 1931 and 1935, wheat production exceeded domestic consumption and made it possible to create surpluses (Pais et al., 1978). The highest degree of self-sufficiency recorded was 161.29% in the year 1934.
Both testimonies of time and historians recognise that wheat self-sufficiency was difficult to achieve in the following decades. One of the reasons that explains this fall in production in the decades following the Wheat Campaign is the fact that most of the incentives granted by the Portuguese state during the campaign was primarily aimed at increasing the cultivated area (Freire, 2008), rather than promoting investment in innovation and new cultivation techniques. However, with the implementation of new technologies that have altered the structure of the agricultural sector and increased productivity, it is relevant to compare the figures recorded during the Wheat Campaign with those of this second scenario, since self-sufficiency is achieved in both.
According to the data presented in Table 6, production is significantly higher than consumption forecasts, which suggests that Portugal would be able to achieve self-sufficiency if it recuperated the area that was once allocated to growing wheat. In 2022, Portugal would reach an output corresponding to 162% of consumption and in 2032, this figure increased to 221%. However, it is unlikely that this land can be repurposed for wheat production due to the occupation of much of it by urban uses, more profitable crops or because it no longer has the required fertility levels (van Vliet et al., 2017). During the period in which these maximum areas were recorded, it was clear that they were driven by strong state support, which encouraged producers to occupy their land with wheat. However, given the comparative disadvantages and the fact that the agricultural sector is no longer governed by national policies, but by the Common Agricultural Policy (CAP), this type of guideline is no longer available and probably won’t be in the future.
| Year | Beja | Bragança | Évora | Faro | Lisbon | Portalegre | Santarém | Setúbal | Total | Self-Supply | |||||||||
|---|---|---|---|---|---|---|---|---|---|---|---|---|---|---|---|---|---|---|---|
| 2022 | 864 640 | 98 388 | 501 796 | 73 551 | 57 813 | 252 622 | 231 443 | 207 218 | 2 287 471 | 162% | |||||||||
| 2023 | 914 205 | 102 346 | 530 171 | 92 426 | 37 828 | 266 417 | 234 676 | 223 371 | 2 401 441 | 159% | |||||||||
| 2024 | 961 017 | 105 739 | 558 547 | 89 823 | 62 095 | 280 212 | 248 252 | 239 524 | 2 545 208 | 170% | |||||||||
| 2025 | 1 010 582 | 109 132 | 585 428 | 102 841 | 64 237 | 294 869 | 253 424 | 255 215 | 2 675 728 | 179% | |||||||||
| 2026 | 1 060 148 | 112 525 | 613 804 | 93 728 | 66 378 | 308 664 | 262 475 | 271 368 | 2 789 089 | 175% | |||||||||
| 2027 | 1 106 959 | 116 483 | 642 179 | 102 841 | 69 233 | 322 459 | 268 293 | 287 521 | 2 915 968 | 186% | |||||||||
| 2028 | 1 156 525 | 119 875 | 670 555 | 89 172 | 71 374 | 337 116 | 276 698 | 303 674 | 3 024 988 | 188% | |||||||||
| 2029 | 1 206 090 | 123 268 | 697 436 | 106 095 | 73 515 | 350 911 | 282 516 | 319 826 | 3 159 659 | 215% | |||||||||
| 2030 | 1 255 655 | 127 226 | 725 812 | 93 077 | 75 656 | 364 706 | 288 335 | 335 979 | 3 266 447 | 199% | |||||||||
| 2031 | 1 302 467 | 130 619 | 754 187 | 97 634 | 77 798 | 378 501 | 289 628 | 351 671 | 3 382 504 | 200% | |||||||||
| 2032 | 1 352 032 | 134 012 | 782 563 | 77 456 | 72 801 | 393 159 | 296 739 | 367 823 | 3 476 585 | 221% | |||||||||
| Source: author’s calculation using Rstudio. | |||||||||||||||||||
In the third scenario, it was tested the situation in which Portugal reaches the 20% target of self-supply. In 2017, the Portuguese Ministry of Agriculture, Forestry and Rural Development announced the creation of the NSPCP, which defined several mains goals, like the increase of cereal production, the reduction of external dependence and the achievement of a stronger and more efficient agricultural sector in the period between 2018-2023. The strategy was based on three pillars: strengthening the role of producer associations, focusing on innovation and transfer of knowledge, and better organization along the production chain (Barreiros, 2018). The production of the districts was calculated based on the percentage of total national production achieved by each district in 2021, and is shown in Table 7.
| Year | Beja | Bragança | Évora | Faro | Lisbon | Portalegre | Santarém | Setúbal | Total | ||||||||||
|---|---|---|---|---|---|---|---|---|---|---|---|---|---|---|---|---|---|---|---|
| 2022 | 104 573 | 18 546 | 78 573 | 3 929 | 2 340 | 38 346 | 18 221 | 17 698 | 282 226 | ||||||||||
| 2023 | 111 779 | 19 823 | 83 986 | 4 200 | 2 502 | 40 988 | 19 476 | 18 918 | 301 671 | ||||||||||
| 2024 | 111 019 | 19 689 | 83 415 | 4 171 | 2 485 | 40 709 | 19 343 | 18 789 | 299 619 | ||||||||||
| 2025 | 110 668 | 19 626 | 83 151 | 4 158 | 2 477 | 40 580 | 19 282 | 18 729 | 298 672 | ||||||||||
| 2026 | 118 102 | 20 945 | 88 738 | 4 437 | 2 643 | 43 306 | 20 578 | 19 988 | 318 737 | ||||||||||
| 2027 | 116 239 | 20 614 | 87 338 | 4 367 | 2 601 | 42 623 | 20 253 | 19 672 | 313 709 | ||||||||||
| 2028 | 119 078 | 21 118 | 89 471 | 4 474 | 2 665 | 43 664 | 20 748 | 20 153 | 321 369 | ||||||||||
| 2029 | 109 021 | 19 334 | 81 915 | 4 096 | 2 440 | 39 977 | 18 995 | 18 451 | 294 229 | ||||||||||
| 2030 | 121 359 | 21 522 | 91 185 | 4 559 | 2 716 | 44 501 | 21 145 | 20 539 | 327 527 | ||||||||||
| 2031 | 125 422 | 22 243 | 94 238 | 4 712 | 2 807 | 45 991 | 21 853 | 21 227 | 338 492 | ||||||||||
| 2032 | 116 543 | 20 668 | 87 566 | 4 379 | 2 608 | 42 735 | 20 306 | 19 724 | 314 527 | ||||||||||
| Source: author’s calculation using Rstudio. | |||||||||||||||||||
According to the results, the total wheat production required to meet the self-supply target in 2032 is approximately 10% higher than in 2022, primarily due to the projected increase in national consumption. This trend underscores the importance of continuing to invest in strategies to boost wheat production, as the target will continue to rise steadily. In contrast, the required cultivated area gradually decreases over the same period, reflecting the positive impact of innovation-driven gains in productivity.
Portuguese productive capacity
As other European countries, from the second half of the 19th century onwards (Federico, 2010; Lains et al., 2024), Portugal experienced growing State intervention, particularly in the most important agricultural subsectors for human consumption, like cereals. The Wheat Campaign is part of this trend of national protectionist policies (Freire, 2008). In Portugal, this kind of policies lasted until the country’s entry into the European Economic Community (EEC), in 1986, where the CAP came into effect. The policy changes had a very particular impact on wheat, because in the 20th century it was the crop that deserved the most protection (Freire & Lains, 2017). The implementation of the CAP changed the structure of the Portuguese agricultural sector and has been considered detrimental to the sector’s evolution. Indeed, it can be observed that agriculture has struggled to generate new dynamics capable of counteracting the structural impacts of the CAP reforms, notably failing to devise development strategies, engage new stakeholders, and harness productive potential (Cunha, 2010). Following the decline in incentives for wheat cultivation, output sharply declined nationwide, since it was state intervention that rendered production economically attractive to farmers. Combining these changes in the orientation of incentives with the opening of international markets and the integration into the EEC, imports were favoured in order to make up for the national consumption deficit.
The findings of the second scenario suggest that Portugal could become self-sufficient if it manages to recover a large part of the land once used to produce wheat. In fact, the lower degree of self-supply recorded in this scenario, 159% in 2023, allows us to understand that there is room for production gains through increases in the cultivated area. However, the assumption that the maximum areas historically cultivated can be recovered does not fully consider current constraints, such as urbanization, land abandonment, soil degradation and shifts to more profitable crops (van Vliet et al., 2017). These structural changes in land use reduced the feasibility of fully recovering former wheat production areas. This complexity must be acknowledged when interpreting the results. However, the analysis also shows that a consistent and stable increase in cultivated area, combined with productivity gains driven by technological innovation, could significantly improve self-supply. Although self-sufficiency is unlikely to be achieved in the short term due to climatic, environmental and political constraints, the third scenario emerges as a more realistic benchmark. To be more specific, the year in which the area necessary to reach 20% is lowest is 2032, and to reach that point it would be necessary to increase the area by 44 300 hectares, an increase of 162% over the 2021 figure.
Another significant takeaway from the analysis of the results is the identification of the most favourable districts for wheat production. It has already been mentioned that most of the Portuguese territory does not have favourable conditions for wheat production and that only a few regions are capable of meeting the necessary conditions to produce it efficiently (Freire & Lains, 2017). The Alentejo and Ribatejo regions, composed by five districts (Beja, Évora, Portalegre, Santarém and Setúbal), emerge as the most productive zones. Setúbal, which is the district with the highest productivity, should have production concentrated mainly in municipalities outside the Setúbal peninsula, due to the high residential density in this zone, which are a part of the Lisbon metropolitan area. The district of Santarém, with the second highest productivity, has historically concentrated production in the municipalities located on the left bank of the Tagus river, which is close to the Alentejo region. Although Beja, Évora and Portalegre have lower productivity levels than these two, they are still the districts with the highest concentration of production and should continue to be prioritised. During several centuries, wheat was the main crop of the Alentejo region (Faísca, 2019). In fact, “government policies were, since 1899, contributing for the region to consolidate the image of Portugal’s granary” (Freire, 2008, p. 31). As a result, wheat cultivation has emerged as an activity which exercised a substantial influence on soil degradation and played a significant role in the state of desertification within the region.
The scenario based approach and policy context
The scenario-based approach used in this study can be easily adapted to other national contexts and crop types, as long as country-specific data on cultivated area, production figures and climatic variables are available. By defining alternative scenarios of land allocation and productivity improvements, the same framework can simulate the evolution of production potential of other cereals such as maize, barley or oats. For example, applying this approach to maize in the southern countries of Eastern Europe is particularly relevant, as maize is one of the most important cereal crops for this region, occupying a significant share of cultivated land and playing a central role in consumption (Grčak et al., 2020).
From a political point of view, integrating scenario results with existing agricultural strategies improves decision-making at various levels of governance. In the EU, for example, scenario modelling can serve as a basis for CAP interventions and support the “Farm to Fork” strategy, which aims to make food systems fair, healthy and environmentally friendly (Wesseler, 2022). National authorities can then prioritize incentive systems, to encourage farmers to expand cultivation in environmentally sustainable ways or to rotate crops to maintain soil quality. By linking this method directly to policy instruments, future research can provide tailored recommendations that support sustainable intensification, crop diversification and resilience building ensuring that scenario-based planning becomes a relevant indicator for agricultural policymaking.
Although this study focuses mainly on consumption and production scenarios, it is important to recognize the broader economic context in which is inserted. Market dynamics, including price volatility and global imbalances between supply and demand, can have a significant impact on both domestic production incentives and the level of wheat imports. A clear example of this, as mentioned earlier, is the armed conflict on the Ukrainian territory. The disruptions in the production cycle and in the supply chain resulting from this conflict have made a significant impact on the market dynamics of wheat on the international stage (Zhang et al., 2024). Similarly, international trade policies, such as tariffs or subsidies, also play a critical role in shaping these dynamics. In the context of the EU, the CAP and the trade agreements with third parties have a profound influence on grain markets (Wieliczko, 2017). These factors collectively shape the economic environment in which agricultural decisions are made and must be considered when assessing the viability and sustainability of production strategies.
Any strategy aimed at achieving national self-sufficiency in wheat must be conceived as a long-term, carefully planned and environmentally sustainable effort. The Wheat Campaign, although it led to self-sufficiency, proved to be economically and ecologically unsustainable and cannot be repeated. Intensive cultivation led to serious erosion and degradation of soil quality due to over-exploitation, particularly in the Alentejo, reflecting a lack of planning on the part of policymakers who ignored these factors (Freire, 2008). In addition, much of the soil in Portugal is unsuitable for growing wheat, resulting in chronically low yields and high production costs due to heavy dependence on fertilizers (Faísca, 2019). Consequently, any future efforts should prioritize the expansion of wheat into the most suitable areas. To ensure that any increase in production aligns with sustainability goals, expansion must be accompanied by environmental safeguards that mitigate soil degradation, conserve water resources and preserve biodiversity. This implies the adoption of soil conservation practices and the adoption of technologies to optimize the use of production factors. Integrating these measures into national policy frameworks will be crucial to balance productivity objectives with long-term ecological resilience and to ensure that the quest for self-sufficiency adheres to the principles of sustainable agriculture.
Limitations and further research
The work carried out and described in this study has some limitations that should be acknowledged when interpreting the results. One fundamental limitation concerns the relatively weak explanatory power of the climatic variables in the model, particularly in relation to predicting productivity levels. However, this should not be interpreted as proof that climate variables are insignificant in determining agricultural results. Nevertheless, aggregating data over large temporal and spatial scales can hide more nuanced interactions between weather patterns and crop output (Srikanthan & McMahon, 2001). By relying on annual figures, the analysis fails to capture the timing and intensity of key climatic events, such as rainfall during the main growth phases or temperature extremes during sensitive periods of the crop cycle, which are known to have substantial effects on yields (Gouveia & Trigo, 2008). In this regard, the use of weekly, monthly, or even seasonal climatic data would allow for a much more precise understanding of when and how climate variables influence production (Gao et al., 2023). As such, the lack of significant explanatory power in the current model probably reflects a limitation in the availability of the data rather than the actual influence of weather on production. Future research could benefit significantly from incorporating more granular climate data, both spatially and temporally, to better understand the specific conditions under which climate variability affects agricultural productivity.
To resolve this constraint, the model was adjusted to include the year as an explanatory variable. This choice allowed MARS to capture the temporal evolution existing in our dataset, which gave it the ability to generate stable and reliable results. More importantly, this inclusion revealed that productivity trends are also significantly influenced by technological innovations, which were not previously considered. By introducing the year into the model, we were able to indirectly reflect the cumulative effect of these innovations over time, from mechanization and the use of fertilizers to the adoption of biotechnology and precision agriculture (Federico, 2010). Although this approach does not isolate specific technologies, it does incorporate their overall influence on output. The resulting models, which include year as a variable, achieved acceptable levels of explanatory power and improved predictive capacity.
In conclusion, an increase in wheat production not only depends on productivity improvement brought by innovations, but also on the increase of the cultivated area. If it remains constant, the maximum degree of self-supply that can be achieved is 8% in 2032, a figure not very different from the value of 6,1% recorded in 2021, which is very far from the 20% target. Considering the circumstances in which the periods of self-sufficiency occurred, it can be observed that an increase in production would require an extension of the cultivated area, which may become possible if incentives are created.
The scenario-based approach used not only provides policymakers with informed guidance on realistic and sustainable strategies for optimizing production efficiency but also provides a form of sensitivity analysis of the MARS method used for forecasting. While the MARS method has strengths, such as the ability to model non-linear relationships and to select the most efficient variables automatically, it also has limitations, such as sensitivity to missing data and high computational requirements for large data sets. Despite these limitations, MARS remains a valuable tool due to its ability to produce understandable models and identify influential forecasting factors. However, to ensure reliable and accurate forecasts, it is advisable to complement it with other models and validation techniques.
The use of MARS in this paper proved very efficient and it emerges as a powerful tool for modelling and predicting wheat production and consumption. It allowed us to work with a very extensive database and, by using its ability to capture nonlinear relationships and interactions among multiple predictors, it provided a robust framework for forecasting. The fact that it identifies and captures complex relationships in data, which would not be possible to unfold if we had used a linear model, was fundamental to this research.
For a strategy to be drawn up and implemented successfully in any sector of the economy, it is necessary to carry out studies and analyses of current conditions and past performance in order to establish reliable objectives. Based on historical data of variables that directly impact wheat production, our analysis was made to provide us with information on the productive capacity of the main agrarian regions. The fact that we limited ourselves to values that were previously recorded gave us the ability to state that this study is reliable and realistic, because these values have been achieved in the past. As such, this study is of great importance to researchers and policymakers to gain insights into the key factors influencing wheat production, enabling informed decision-making and resource allocation. Due to the lack of investment by the Portuguese government, which is still not paying enough attention to the problem of decreasing wheat production, it has not yet been possible to record the figures we had predicted could be achieved. As agricultural systems face increasing challenges due to climate change and fluctuating market conditions, this paper offers a valuable approach for reliable and accurate wheat production predictions, thereby aiding in the formulation of sustainable agricultural strategies. This becomes more relevant considering the current geopolitical context of the European continent, as it provides countries with information on their productive capacity so that they can design strategies to increase production and achieve self-sufficiency.
Barreiros, L. S. (2018). Estratégia Nacional para a Promoção da Produção de Cereais. 9º Colóquio Nacional do Milho. Póvoa do Varzim.
Cunha, A. (2010). Impactos da adesão na agricultura e nas pescas. Revista Europa Novas Fronteiras. Nºs, 26.
Dias, J., & Rocha, H. (2019). Forecasting wheat prices based on past behavior: comparison of different modelling approaches. In Computational Science and Its Applications–ICCSA 2019: 19th International Conference, Saint Petersburg, Russia, July 1–4, 2019, Proceedings, Part III 19 (pp. 167–182). Springer International Publishing.
Faísca, C. M. (2019). A produção agrícola no Alentejo. Revista de Estudios Económicos y Empresariales, 39–64.
Federico, G. (2010). Feeding the world. In Feeding the World. Princeton University Press.
Freire, D. (2008). A Campanha do Trigo. In Simões do Paço, A. (ed.), Os Anos de Salazar. 1933 – A Constituição do Estado Novo (Vol.2, pp. 31–39). Lisboa: Centro Editor PDA/Planeta DeAgostini.
Freire, D. & Lains, P. (Eds.) (2017). An agrarian history of Portugal, 1000-2000: economic development on the European frontier. Leiden / Boston: Brill.
Friedman, J. (1988). Multivariate Adaptive Regression Splines (MARS) (No. 102). Technical Report.
Gaigbe-Togbe, V., Bassarsky, L., Gu, D., Spoorenberg, T., & Zeifman, L. (2022). World Population Prospects 2022.
Gao, J., Linton, O., & Peng, B. (2023). A non-parametric panel model for climate data with seasonal and spatial variation. Journal of the Royal Statistical Society, 187(1), 160–179
Garrido-Lestache, E., Lopez-Bellido, R.J., Lopez-Bellido, L., (2005). Durum wheat quality under Mediterranean conditions as affected by N rate, timing and splitting, N form and S fertilization. Eur. J. Agron. 23, 265–278.
Gouveia, C. & Trigo, R.M. (2008) Influence of Climate Variability on Wheat Production in Portugal. In: Soares A., Pereira M.J., Dimitrakopoulos R. (eds) geoENV VI – Geostatistics for Environmental Applications. Quantitative Geology and Geostatistics, vol 15. Springer, Dordrecht.
Grčak, M., Grčak, D., Penjišević, A., Simjanović, D., Orbović, B., Đukić, N., & Rajičić, V. (2020). The trends in maize and wheat production in the Republic of Serbia. Acta Agriculturae Serbica, 25(50), 121–127.
Jambekar, S., Nema, S., & Saquib, Z. (2018). Prediction of Crop Production in India Using Data Mining Techniques. Proceedings - 2018 4th International Conference on Computing, Communication Control and Automation, ICCUBEA 2018.
Lains, P., Costa, L. F., Grafe, R., Loncán, A. H., Luis, D. I., Pinilla, V., & Vilar, H. V. (Eds.). (2024). An economic history of the Iberian Peninsula, 700-2000. Cambridge University Press.
Michel L., Makowski D. (2013) Comparison of Statistical Models for Analyzing Wheat Yield Time Series. PLoS One 8(10): e78615.
Nayana, B. M., Kumar, K. R., & Chesneau, C. (2022). Wheat Yield Prediction in India Using Principal Component Analysis-Multivariate Adaptive Regression Splines (PCA-MARS). AgriEngineering, 4(2), 461–474. MDPI AG.
Pais, J. M., Lima, A., Baptista, J., Jesus, M. De, & Gameiro, M. (1978). Elementos para a história do fascismo nos campos: A «Campanha do Trigo»: 1928-38 (I) & (II). AnáliseSocial, XIV (54), 321–389.
Rocha, H., & Dias, J. M. (2019). Early prediction of durum wheat yield in Spain using radial basis functions interpolation models based on agroclimatic data. Computers and Electronics in Agriculture, 157, 427-435.
Scott, J. C. (2017). Against the Grain: A Deep History of the Earliest States. Yale University Press.
Soares, Fernando de Brito (2005). “A agricultura”. In Pedro Lains and Álvaro F. da Silva (Eds.). História Económica de Portugal. Lisbon: Imprensa de Ciências Sociais, vol. 3, pp. 158–183.
Srikanthan, R., & McMahon, T. A. (2001). Stochastic generation of annual, monthly and daily climate data: A review. Hydrology and Earth System Sciences, 5(4), 653–670.
Sunding, D., & Zilberman, D. (2001). The agricultural innovation process: research and technology adoption in a changing agricultural sector. Handbook of agricultural economics, 1, 207–261.
van Vliet, J., Eitelberg, D. A., & Verburg, P. H. (2017). A global analysis of land take in cropland areas and production displacement from urbanization. Global Environmental Change-Human and Policy Dimensions, 43, 107–115.
Viana, C. M., Freire, D., Abrantes, P., & Rocha, J. (2021). Evolution of agricultural production in Portugal during 1850–2018: A geographical and historical perspective. Land, 10(8).
Wesseler, J. (2022). The EU’s farm‐to‐fork strategy: An assessment from the perspective of agricultural economics. Applied Economic Perspectives and Policy, 44(4), 1826–1843.
Wieliczko, B. (2017). The impact of global surrounding on the common agricultural policy. 498, 374–381.
Zhang, Y.-T., Li, M.-Y., & Zhou, W. (2024). Impact of the Russia-Ukraine Conflict on International Staple Agrifood Trade Networks. Foods, 13(13), 2134.