Received: February 26, 2025; Accepted: July 26, 2025; Published: 2025-12-30
Digital technology adoption among italian farmers: An extended technology acceptance model approach in the horticultural sector
1 Department of Food and Drug, University of Parma, Parma, Italy
2 Department of Agricultural and Food Sciences, Alma Mater Studiorum, Università di Bologna, Bologna, Italy
*Corresponding author. E-mail: davide.menozzi@unipr.it
Abstract. The adoption of digital technologies in agriculture is essential for enhancing sustainability, productivity, and resource efficiency. This study investigates the factors influencing Italian horticultural farmers’ adoption of innovative water-smart agricultural technologies using an extended Technology Acceptance Model (TAM3). The research employs a structured survey conducted with 251 Italian farmers, analysing their perceptions of technology usefulness, ease of use, social norms, and sustainability outcomes. Structural equation modelling (SEM) confirms that perceived usefulness significantly influences adoption intentions, while perceived ease of use plays a limited role. Social norms and sustainability-related benefits also emerge as critical determinants. Results also indicate the impact of farm size and workforce on adoption behaviour. These findings highlight the need for targeted policies, training programs, and financial incentives to overcome adoption barriers. The study provides insights for policymakers, technology developers, and agricultural stakeholders to foster digital innovation in the horticultural sector, contributing to sustainable water management practices.
Keywords: digital agriculture, farmer adoption, Technology Acceptance Model (TAM), horticultural sector, water-smart sustainable farming.
Index
2. Literature review and theoretical background
4.2. Drivers of digital innovation
– A structured survey conducted with 251 Italian horticultural farmers
– The extended TAM3 explains 18% of the variance in the behaviour (the adoption of water-smart technologies), and 65% of the variance in intention
– Behavioural intention is a significant predictor of the behaviour
– Perceived usefulness and social norms have a significant effect on adoption intention
– Perceived ease of use has no influence on adoption intentions
The agricultural sector is facing many unprecedented challenges. These include the need to develop sustainable resource management strategies to meet the growing demand for food and to reduce the environmental impact of agri-food production (Kapsdorferová, 2024). Given the increasing pressure on agricultural systems, in particular on natural resources, it is crucial to identify effective measures to mitigate these negative impacts in line with the European Green Deal and the United Nations 2030 Agenda (Montanarella and Panagos, 2021). In this context, the application of digital technologies and the development of smart solutions have emerged as key strategies to improve efficiency, productivity and sustainability in the agri-food sector (Yigezu et al., 2018). Among the various forms of agricultural innovation, practices related to irrigation are of particular importance today (Asadi et al., 2020). Water scarcity and drought are now considered a global problem of paramount importance, that is likely to be exacerbated by climate change, which is one of the greatest environmental, social and economic challenges facing the entire planet (Ermolieva et al., 2022; Ungureanu et al., 2020). Water-smart agricultural practices can be helpful in two ways: from an environmental perspective, they can reduce pressure on water resources, improve water use efficiency and reduce water waste. From an economic perspective, these solutions can lead to cost savings and productivity increases and contribute to overall profitability by maximizing crop yields per amount of water used (Gemtou et al., 2024). The use of specific innovations, such as soil moisture sensors, automatic irrigation systems and predictive models has the potential to address major challenges such as water scarcity and the impact of climate variability (Adeyemi et al., 2017), as well as energy savings (Patle et al., 2019). However, one of the biggest challenges facing smallholder agriculture is the low uptake of innovative technological solutions, which has led to relatively low technology penetration in the sector (Senyolo et al., 2018). In this context, it is crucial to gain insights into farmers’ behaviour, their willingness to adopt smart solutions and potential strategies to facilitate wider adoption of water technologies in the agricultural sector (Gemtou et al., 2024).
It is evident that despite the general focus on a fair transition from agricultural practices to digital technologies, the diffusion and adoption of smart technologies remains uneven and is influenced by a complex interplay of individual, technological and contextual factors (Shang et al., 2021). Previous studies have shown that there are significant differences in adoption rates among farmers (Paustian and Theuvsen, 2017).
Farmers’ decision-making processes, which are shaped by perceptions of benefits, ease of use and external pressures, are key to understanding the adoption landscape (Cimino et al., 2024; Schulze Schwering et al., 2022). Given the limited technological penetration of the agricultural sector and the potential benefits of digital technologies, it is crucial to investigate the factors influencing the adoption of smart technologies (Gemtou et al., 2024).
While previous research has investigated adoption patterns among farmers, it has often focused on large-scale farming operations or specific regions with advanced technological infrastructures (Paustian and Theuvsen, 2017). Additionally, studies have highlighted barriers such as limited digital literacy, financial constraints, and a lack of institutional support for small and medium-sized farms (Senyolo et al., 2018; Shang et al., 2021). Despite this growing body of work, several gaps in the literature remain. First, little research has focused on the adoption of water-smart technologies in the horticultural sector, which plays a crucial role in agricultural sustainability. Most studies on precision agriculture have examined large-scale cereal farming, neglecting horticultural systems where irrigation efficiency is a key factor (Adeyemi et al., 2017). Second, while research has investigated the impact of farm size and socio-demographic characteristics on technology adoption, the role of sustainability considerations and social norms remains underexplored. Previous studies have suggested that perceived usefulness and perceived ease of use drive adoption, but the extent to which sustainability motivations influence farmers’ decisions is not well understood (Gemtou et al., 2024). Finally, existing literature has rarely examined the adoption of digital technologies in Italian agriculture, a sector characterized by fragmented land ownership, diverse regional farming practices and different levels of technological readiness (Baldoni et al., 2018).
This study aims to address these gaps by analysing the factors influencing Italian farmers in the adoption of digital technologies for better water management and the barriers they face, with a focus on horticultural crops. Horticulture has been considered for some reasons: first, because of the importance of this sector in the Italian agricultural system; secondly, for the relevance of the irrigation in this cropping system (Patle et al., 2019); third because of the relevance of smart precision in horticulture (Adeyemi et al., 2017). The technologies studied relate to smart water management through a three-stage technology complexity: the first (basic) stage is represented by the introduction of soil moisture sensors, which proceeds to a system that combines sensors with an automatic irrigation system, and in the last stage the sensors are connected to an automated system, which in turn is connected to and dialogs with predictive models1. Understanding how these farmers perceive and adopt water-efficient innovations is crucial to develop targeted policies, design effective incentives, and promote sustainable agricultural practices. The results of this work can provide valuable insights to policymakers, technology providers, and other stakeholders (e.g., cooperatives, producers’ associations, etc.) seeking to promote sustainable and efficient agricultural practises through innovation.
2. Literature review and theoretical background
As the existing literature shows, the process of adopting new technologies is inherently complex and dynamic (Montes de Oca Munguia et al., 2021). In particular, the decision-making process is influenced by various factors that affect the rate of technology adoption by farmers (Gemtou et al., 2024; Osrof et al., 2023). Although the existing literature has explored the mechanisms of innovation diffusion, there does not seem to be a unified set of theories or models that could explain the phenomenon. Some authors have highlighted the specificity of theories in modelling different aspects of the technology adoption process (Dissanayake et al., 2022; Osrof et al., 2023), while others have expressed doubts about the generalist ability of theories to represent different technologies and practices (Montes de Oca Munguia et al., 2021). Indeed, there is still confusion about the methods of analysis and the choice of explanatory variables that should be used to model the adoption process (de Oca Munguia and Llewellyn, 2020). To illustrate, Shang et al. (2021) argue that the mechanisms of adoption and diffusion of digital agricultural technologies need to be understood at both the farm level and the system level. They also suggest that the focus in determining technology diffusion should be on system interactions in combination with individual characteristics. Given the evidence presented in the literature, it can be assumed that the categories of individual, technological, social and economic factors influencing technology adoption can describe the entire decision-making process (Dissanayake et al., 2022). There is a clear lack of convergence and consistency in the results regarding the impact and statistical significance of the individual factors assessed in the adoption models (de Oca Munguia and Llewellyn, 2020). This discrepancy can be attributed to the fact that most adoption studies do not include variables on technologies or practices. It is recognized that the use of multiple paradigms in modelling technology adoption and diffusion can increase the explanatory power of the models. However, it is important to consider the factors and their interactions in a way that is consistent with the objectives and context of the study within a specific food system (Dentoni et al., 2023).
In the present work we applied the Technology Acceptance Model (TAM) (Davis, 1989) for measuring the intention of Italian farmers to adopt innovative smart technologies. According to this paradigm, two dispositions towards a new technology (perceived usefulness and ease of use) determine a person’s attitude towards using that technology and influence their desire to use it. Perceived usefulness is the extent to which a person believes that job performance can be enhanced by using the new technology, whereas perceived ease of use is the extent to which a person believes that using the new technology is effortless. Some extensions of the original TAM conceptualization have been proposed, such as the TAM3 version (Venkatesh and Bala, 2008). The TAM3 extension introduces new constructs and determinants that affect the core variable perceived ease of use and proposes new relationships between the constructs. The factors influencing perceived ease of use in the TAM3 version are computer self-efficacy, perception of external control, computer anxiety, computer playfulness, perceived enjoyment, and objective usability, whereas perceived usefulness is affected by subjective norm, image, relevance to work, output quality and demonstrability of results. Other innovations introduced by this extension include: (i) the correlation between perceived ease of use and perceived usefulness, (ii) the correlation between perceived ease of use and intention, and (iii) the concept of anxiety. The latter factor, which expresses the degree of emotional fear, apprehension, nervousness, or stress experienced when interacting with a new technology, is supposed to negatively affect the perceived ease of use. The more anxiety a person feels, the less likely they are to perceive the technology as easy to use.
Some minor adjustments were made to the original TAM3 version by Venkatesh and Bala (2008) to better suit the purpose and context of the analysis. First, all constructs were considered in the context-specific environment, i.e. the adoption of new water-smart agricultural technologies by Italian horticultural farms. Moreover, some aspects were evaluated as very important and emerged explicitly from the exploratory phase with the participants, such as technology self-efficacy and quality of outcomes. Other characteristics, such as (computer) playfulness or perceived enjoyment, that are characteristic of the original conceptualization of the TAM3 model in relation to information technologies, do not apply to the context of the current research and were therefore excluded from the model design. Then, some variables were found to be significant when considering sustainability issues (Gemtou et al., 2024). Consequently, a category based on with the Sustainability Assessment of Food and Agriculture Systems (SAFA) (FAO, 2014) was included in the model. More specifically, the themes inspired by the FAO-indicators were (i) the reduced water-used thanks to the optimization of the irrigation system, (ii) the improved skills the employees and the holder/farmer need to reach to use the technology, and (iii) new employees recruited thanks to their technological skills. Therefore, we tested the following main hypotheses on the factors influencing the adoption of new water-smart agricultural technologies by Italian horticultural farms (Figure 1):
H1: perceived usefulness is positively affected by output quality (H1a), by sustainability outcomes measured by SAFA indicators (H1b), and by subjective norms (H1c);
H2: perceived ease of use is positively affected by technology self-efficacy (H2a), and is negatively affected by anxiety (H2b);
H3: perceived ease of use has a positive impact on farmers’ intention to adopt new technologies (H3a), and is positively affecting the perceived usefulness of new technologies (H3b);
H4: perceived usefulness has a positive impact on farmers’ intention to adopt new technologies;
H5: subjective norms have a positive impact on farmers’ intention to adopt new technologies;
H6: the farmers’ intention to adopt new technologies is positively affecting the behaviour, i.e. the new technology adoption.
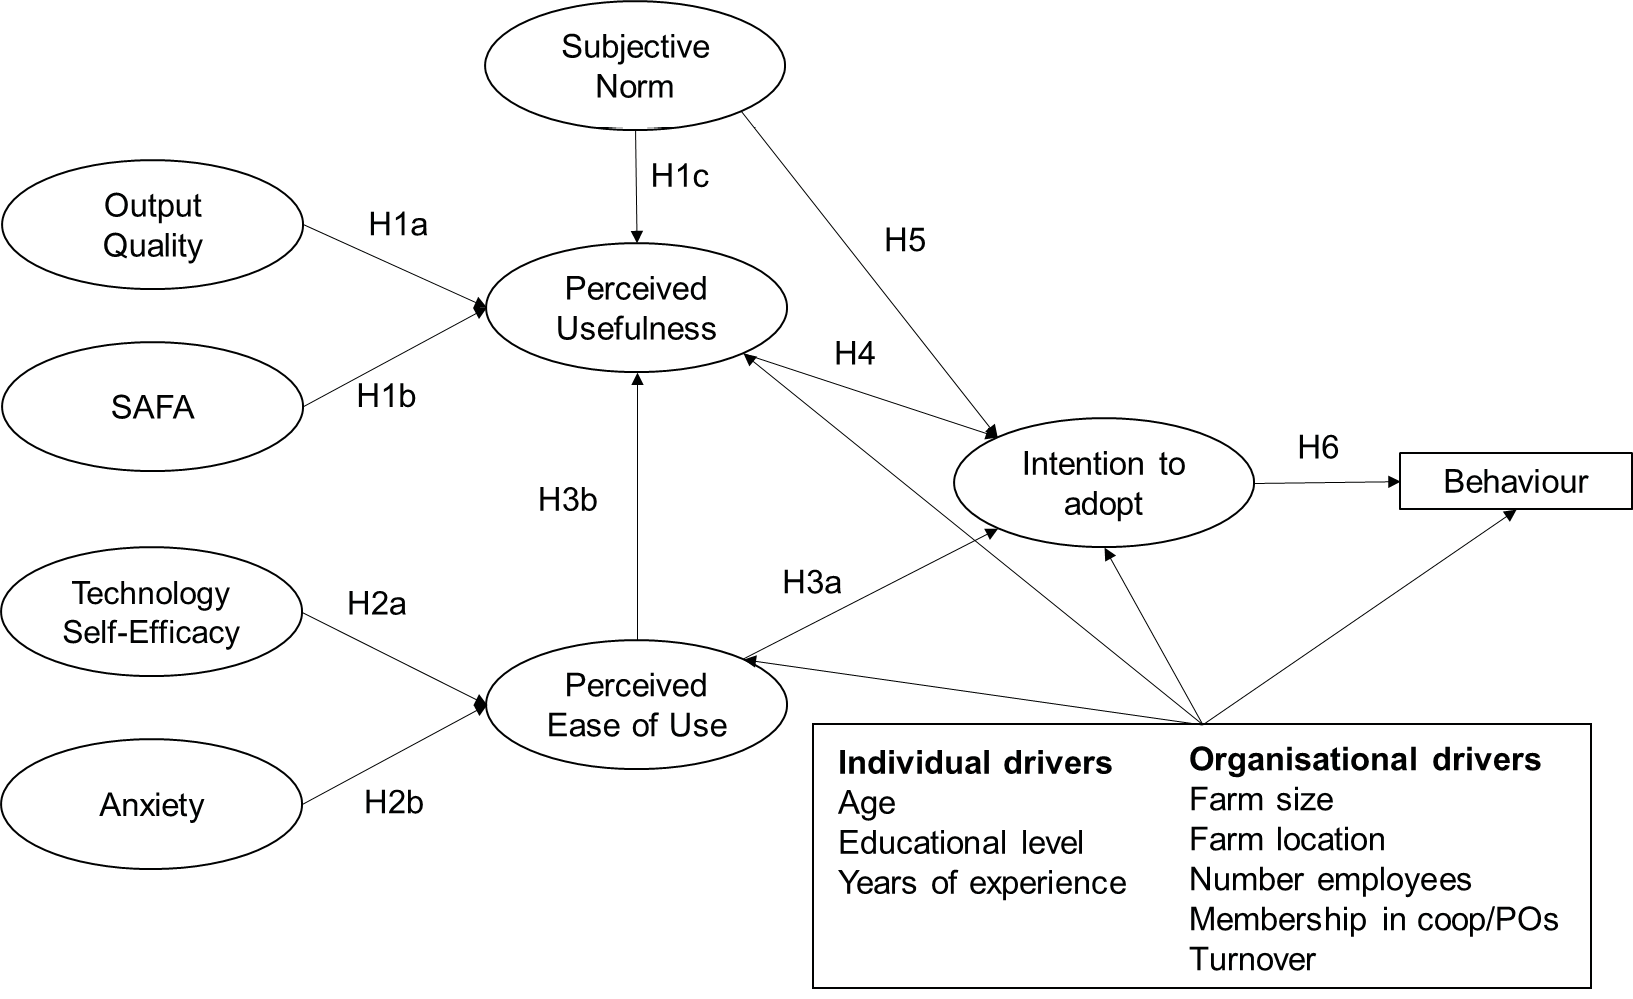
Moreover, individual factors, such as socio-demographic and organizational factors, which determine the natural and structural conditions of the farm, have been found to correlate with farmers’ decisions. In particular, farmers’ education level, gender, age, technology literacy, were among the individual drivers more frequently included in studies investigating the smart farming technologies adoption (Osrof et al., 2023). Farm size, mostly expressed in total acreage farmland, is a prominent factor among the organizational ones, since larger farm size is consistently seen as pivotal for achieving economies of scale when adopting smart farming technologies. Farm income is another key element, as farmers with a higher income are more willing to invest in new technologies (Osrof et al., 2023). Farm location is also a notable barrier within this theme, showing mixed effects in past studies. Some research indicates that it might negatively affects farmers’ motivation to adopt smart technology, particularly if farms face unfavourable climate conditions or soil quality (Paxton et al., 2011). In Italy, farms in the northern regions are generally more competitive, due to larger farm sizes, advanced mechanisation, and stronger market integration. In contrast, farms located in central and southern regions often face structural constraints, including smaller farms and lower productivity (Baldoni et al., 2018). Other studies emphasize the importance of social factors and access to information for the adopting of innovative smart technologies (Blasch et al., 2022). In this context, being a member of a farmers’ associations or a producer organizations (POs), where knowledge transfer is one of the main objectives, might facilitate adoption. Therefore, we controlled the main endogenous variables of the model, i.e. perceived usefulness, perceived ease of use, adoption intention and behaviour, with individual factors, namely farmers’ age, education level and years of experience in the agricultural sector, and organizational ones, including farm size, farm location (expressed by the latitude of the province where the farm is located), number of employees, membership in a cooperative or a producer organization, and farm turnover (Figure 1).
The data collection consisted in two phases: first we conducted a preliminary exploratory phase with qualitative, unstructured interviews. The aim of the exploratory interviews was to identify relevant aspects to be included in the final model and to highlight those that could be omitted. In this way, relevant points such as the quality of results and self-efficacy were included in the final surveys. The questions focused on previous experience with smart technologies, skills in using them, public financial support for the adoption of technical solutions and the farm structure, as well as farmers’ previous personal background. In the second phase, we conducted a survey among a sample of Italian horticultural farms. After an initial pilot phase (n=21 interviews) to test the questionnaire, the main study was conducted in the period from October to November 2024 by an international market research company using the CATI (Computer Assisted Telephone Interview) method. The survey lasted approximately 30 minutes. The total defined sample consisted of 251 Italian farmers.
The sample includes farmers who grow tomatoes (50% in northern Italy and 50% in the south), and those who grow fresh vegetables, such as carrots, peppers, eggplants, lettuce, etc., spread across northern, central and southern Italy (30%, 17%, and 53%, respectively).
The geographical breakdown was chosen to be representative of the horticultural farms according to the Italian National Institute of Statistics (ISTAT). The coverage of different administrative regions throughout Italy ensures a comprehensive understanding of cultivation practices across the country and also illustrates the different technological levels.
Together with the socio-demographic information and the descriptive indicators, the questionnaire was designed to test the model hypotheses. Overall, it included 14 constructs, with a total of 45 items. The constructs included in the final model (Figure 1) were aimed to understand the drivers for the adoption of innovative water-smart agricultural technologies by Italian horticultural farms. All TAM3 items were measured on a 7-point scale (from ‘strongly disagree’ to ‘strongly agree’) (see Annex Table A1).
Subjective norm, i.e. the perceived social pressure to adopt the new technology, was assessed by three items (e.g., “Many producers I know have already adopted this innovation”). We measured the perceived usefulness with four items (e.g., “This innovation could improve my productivity”). Output quality, i.e. the perception of the quality of the technology in performing the task, was measured by four items (e.g., “Using this technology will improve the quality of my products”), whereas SAFA-based aspects (i.e. the sustainability-related outcomes of the new technology adoption) were assessed by four items (e.g., “By using this innovation, I could help reduce water consumption”). We used two items for assessing the perceived ease of use (e.g., “This technology should be easy to use”). Technology self-efficacy, i.e. the belief in how well someone can perform actions to achieve performance outcomes, was measured by three items (e.g., “I would use this innovation easily if I had technical support”), whereas anxiety was assessed by three items (e.g., “New technologies make me feel uncomfortable”). We used three items to assess behavioural intention (e.g., “I intend to use this technology in the near future”).
The study focused on the three levels of water-smart technologies described above: Level 1) – soil moisture sensors, Level 2) – a system combining sensors with an automatic irrigation system, and Level 3) – sensors connected to an automated system, which in turn is connected to and interacts with predictive models. If a farmer indicated they have adopted a certain level of the technology, the items were framed for the next level. For instance, if a respondent have already adopted soil moisture sensors, we asked about the intention to adopt the sensors connected to an automated system. If no adoption was reported, we asked about their intention to adopt soil moisture sensors (Level 1), whereas when they reported the highest level of adoption, we asked about the intention to adopt more advanced predictive models. Therefore, the behaviour was assessed with a single item, ranging from 1 to 4, considering the different adoption levels (1=no technology; 2=Level 1; 3=Level 2; 4=Level 3).
We performed the statistical analysis using SPSS v.29.0 and AMOS v.29.0 statistical software (IBM Corporation, Armonk, NY, USA). Means, standard deviations, median and interquartile range (IQR) were calculated for each questionnaire item and its related construct. Structural equation modelling (SEM) was used to test hypotheses H1–H6 and the theoretical framework in Figure 1. SEM allows models to be specified with both latent (e.g., perceived usefulness) and observed variables (e.g., farmer’s age) (Kline, 2016). Specifically, we have considered two models: in Model 1 we included only the variables of the extended-TAM3 model (i.e. behaviour, behavioural intention, subjective norm, perceived usefulness, perceived ease of use, output quality, SAFA, technology self-efficacy and anxiety). Then, we controlled for the effects of individual factors (i.e., farmers’ age, educational level, and years of experience in the agricultural sector) and organizational factors (i.e., farm size, farm location, number of employees, membership in a cooperative or a producer organization, and farm turnover) on the endogenous variables (i.e., perceived usefulness, perceived ease of use, behavioural intention, and behaviour) by adding them step by step to Model 1. We then run Model 2 by adding to Model 1 the significant effects of the individual and organizational factors previously found. Convergent validity of the model variables was assessed using average variance extracted (AVE), Cronbach’s α coefficient, and composite reliability (CR). Discriminant validity was tested by comparing the square root of the AVE of each construct with the inter-construct correlation (Bagozzi and Yi, 2012). The goodness-of-fit of the models was assessed using the χ2 and their degrees of freedom (df), the Tucker-Lewis Index (TLI), the comparative fit index (CFI), the root mean square error of approximation (RMSEA) with a 90% confidence interval, and the standardised root mean square residual (SRMR) (Kline, 2016). The coefficient of determination (R2) was used to measure the explained variance of the endogenous variables. We applied the Maximum Likelihood estimation routine (Byrne, 2010).
The overall sample consisted of 251 respondents who were responsible for farm’s decisions (78% always, 14% often, and 8% sometimes). Most respondents were male (92%), had completed upper secondary education (53%), had an average age of 53 years, and a median of 30 years of experience in the agricultural sector (Table 1). Most farms were located in southern Italy and on the islands (51.4), had a median utilised agricultural area (UAA) of 15 ha, employed less than 10 people (68%), with a median turnover of €200.000. The most frequently cultivated vegetables were tomatoes, both for fresh consumption (44%) and for the processing industry (41%), followed by peppers (16%) and zucchinis (11%).
| Variables | Sample | ||||||||||||||||||
|---|---|---|---|---|---|---|---|---|---|---|---|---|---|---|---|---|---|---|---|
| N | % | ||||||||||||||||||
| Age of the respondent | |||||||||||||||||||
| Age (years, mean and SD) | 52.8 (11.9) | ||||||||||||||||||
| Gender | |||||||||||||||||||
| Male | 231 | 92.0 | |||||||||||||||||
| Female | 20 | 8.0 | |||||||||||||||||
| Others or prefer not to answer | 0 | 0.0 | |||||||||||||||||
| Educational level | |||||||||||||||||||
| Primary | 8 | 3.2 | |||||||||||||||||
| Secondary lower | 57 | 22.7 | |||||||||||||||||
| Secondary higher | 132 | 52.6 | |||||||||||||||||
| Tertiary | 54 | 21.5 | |||||||||||||||||
| Geographical area of the farm | |||||||||||||||||||
| North-West | 28 | 11.2 | |||||||||||||||||
| North-East | 66 | 26.3 | |||||||||||||||||
| Center | 28 | 11.2 | |||||||||||||||||
| South and Islands | 129 | 51.4 | |||||||||||||||||
| Farm size | |||||||||||||||||||
| UAA (ha, median and IQR) | 15.0 (4.0-60.0) | ||||||||||||||||||
| Farms by UAA classes | |||||||||||||||||||
| < 2 ha | 20 | 8.0 | |||||||||||||||||
| 2 – 4.99 ha | 47 | 18.7 | |||||||||||||||||
| 5 – 19.99 ha | 69 | 27.5 | |||||||||||||||||
| 20 – 49.99 ha | 45 | 17.9 | |||||||||||||||||
| > 50 ha | 70 | 27.9 | |||||||||||||||||
| Most cultivated vegetables | |||||||||||||||||||
| Tomato (for fresh consumption) | 110 | 43.8 | |||||||||||||||||
| Tomato (for the processed industry) | 104 | 41.4 | |||||||||||||||||
| Peppers | 40 | 15.9 | |||||||||||||||||
| Zucchinis | 27 | 10.8 | |||||||||||||||||
| Eggplants | 13 | 5.2 | |||||||||||||||||
| Lettuce | 13 | 5.2 | |||||||||||||||||
| Potatoes | 12 | 4.8 | |||||||||||||||||
| Melons | 9 | 3.6 | |||||||||||||||||
| Cauliflowers | 8 | 3.2 | |||||||||||||||||
| Enterprise n. employee category | |||||||||||||||||||
| Micro (1-9 employees) | 171 | 68.1 | |||||||||||||||||
| Small (10-49) | 64 | 25.5 | |||||||||||||||||
| Medium 1 (50-99) | 12 | 4.8 | |||||||||||||||||
| Medium 2 (100-249) | 4 | 1.6 | |||||||||||||||||
| Large (≥250) | 0 | 0.0 | |||||||||||||||||
| Farm’s turnover | |||||||||||||||||||
| Turnover (.000 euro, median and IQR) | 200 (90-650) | ||||||||||||||||||
| Farmer’s years of experience in agriculture | |||||||||||||||||||
| Years of experience (median and IQR) | 30 (20-40) | ||||||||||||||||||
| Levels of water-smart technologies a | |||||||||||||||||||
| No technological innovation | 175 | 69.7 | |||||||||||||||||
| Level 1 | 43 | 17.1 | |||||||||||||||||
| Level 2 | 16 | 6.4 | |||||||||||||||||
| Level 3 | 17 | 6.8 | |||||||||||||||||
| Notes: Data are presented as the mean (SD) for continuous variables for which the hypothesis of normal distribution cannot be rejected at p<0.05, as median (IQR) otherwise, or as number (%) for nominal variables. SD = Standard Deviation. IQR = Interquartile Range. UAA = Utilised Agricultural Area. a Levels of water-smart technologies: Level 1) – soil moisture sensors, Level 2) – a system combining sensors with an automatic irrigation system, and Level 3) – sensors connected to an automated system, which in turn is connected to and interacts with predictive models. | |||||||||||||||||||
Most of the sampled farmers had not yet adopted any of the proposed technologies (n=175, 69.7%). Those who have deployed any of these technologies relied on Level 1 (i.e. soil moisture sensors, n=43, 17.1%), and a few were already using automated irrigation systems (Level 2) or predictive models (Level 3), accounting for 6.4% (n=16) and 6.8% (n=17) respectively (Table 1). In light of these findings, it is important to understand the motivation for the adoption of new technologies and the factors that hamper their introduction.
Overall, the results in Table 2 show a moderately positive perceived usefulness of water-smart agricultural new technologies (mean score: 4.81), which means in particular that farmers moderately agree that by using this technology they could reduce water consumption and improve productivity. The results also show a moderately positive perceived ease of use (4.69) and output quality (4.59). Furthermore, important others had no significant influence (3.63), and there was relatively low anxiety about applying new technologies (3.16). The results indicated a positive evaluation of the sustainability aspects related to the new technology (e.g., reduced water consumption, enhanced technical skills, etc., mean score: 5.03), as well as positive technology self-efficacy (5.12). In particular, respondents stated that they would use this innovation easily if they had technical support. Furthermore, consumers exhibited a moderately positive intention to adopt innovative water-smart agricultural technologies (4.58).
| Mean (SD) | Median (IQR) | λ | CR | AVE | α | ||||||||||||||
|---|---|---|---|---|---|---|---|---|---|---|---|---|---|---|---|---|---|---|---|
| Perceived Usefulness | 4.81 (1.06) | 5.00 (4.25-5.25) | 0.84 | 0.56 | 0.84 | ||||||||||||||
| PU1 | 4.80 (1.25) | 5.00 (4.00-5.00) | 0.78 | ||||||||||||||||
| PU2 | 4.61 (1.34) | 5.00 (4.00-5.00) | 0.75 | ||||||||||||||||
| PU3 | 4.86 (1.20) | 5.00 (4.00-5.00) | 0.79 | ||||||||||||||||
| PU4 | 4.95 (1.37) | 5.00 (4.00-6.00) | 0.67 | ||||||||||||||||
| Perceived Ease of Use | 4.69 (0.92) | 4.50 (4.00-5.00) | 0.61 | 0.45 | 0.61 | ||||||||||||||
| PEU1 | 4.98 (1.06) | 5.00 (4.00-5.00) | 0.59 | ||||||||||||||||
| PEU2 | 4.40 (1.10) | 5.00 (3.00-5.00) | 0.75 | ||||||||||||||||
| Output Quality | 4.59 (0.98) | 4.75 (4.00-5.00) | 0.83 | 0.56 | 0.84 | ||||||||||||||
| OQ1 | 4.57 (1.15) | 5.00 (4.00-5.00) | 0.70 | ||||||||||||||||
| OQ2 | 4.52 (1.25) | 5.00 (4.00-5.00) | 0.78 | ||||||||||||||||
| OQ3 | 4.80 (1.16) | 5.00 (4.00-5.00) | 0.85 | ||||||||||||||||
| OQ4 | 4.48 (1.20) | 5.00 (4.00-5.00) | 0.64 | ||||||||||||||||
| SAFA | 5.03 (1.00) | 5.00 (4.67-5.67) | 0.78 | 0.55 | 0.79 | ||||||||||||||
| SAFA1 | 5.12 (1.21) | 5.00 (5.00-6.00) | 0.68 | ||||||||||||||||
| SAFA2 | 4.87 (1.17) | 5.00 (4.00-5.00) | 0.72 | ||||||||||||||||
| SAFA3 | 5.10 (1.20) | 5.00 (5.00-6.00) | 0.81 | ||||||||||||||||
| Anxiety | 3.16 (1.18) | 3.00 (2.67-3.67) | 0.85 | 0.66 | 0.85 | ||||||||||||||
| ANX1 | 3.28 (1.33) | 3.00 (3.00-4.00) | 0.74 | ||||||||||||||||
| ANX2 | 3.10 (1.33) | 3.00 (2.00-3.00) | 0.88 | ||||||||||||||||
| ANX3 | 3.10 (1.37) | 3.00 (2.00-3.00) | 0.81 | ||||||||||||||||
| Technology Self-Efficacy | 5.12 (1.11) | 5.00 (4.67-6.00) | 0.92 | 0.80 | 0.92 | ||||||||||||||
| TSE1 | 5.07 (1.22) | 5.00 (5.00-6.00) | 0.87 | ||||||||||||||||
| TSE2 | 5.20 (1.18) | 5.00 (5.00-6.00) | 0.93 | ||||||||||||||||
| TSE3 | 5.08 (1.18) | 5.00 (5.00-6.00) | 0.88 | ||||||||||||||||
| Subjective Norms | 3.63 (1.09) | 3.67 (3.00-4.33) | 0.76 | 0.53 | 0.74 | ||||||||||||||
| SN1 | 3.84 (1.31) | 4.00 (3.00-5.00) | 0.84 | ||||||||||||||||
| SN2 | 3.52 (1.41) | 3.00 (3.00-5.00) | 0.51 | ||||||||||||||||
| SN3 | 3.53 (1.31) | 3.00 (3.00-5.00) | 0.78 | ||||||||||||||||
| Behavioural Intention | 4.58 (1.35) | 4.67 (4.00-5.33) | 0.91 | 0.77 | 0.91 | ||||||||||||||
| BI1 | 4.41 (1.51) | 5.00 (4.00-5.00) | 0.93 | ||||||||||||||||
| BI2 | 4.54 (1.47) | 5.00 (4.00-5.00) | 0.89 | ||||||||||||||||
| BI3 | 4.80 (1.41) | 5.00 (4.00-6.00) | 0.80 | ||||||||||||||||
| Behaviour a | 1.50 (0.89) | 1.00 (1.00-2.00) | |||||||||||||||||
| Note: All items were measured on a 7-point scale (from ‘strongly disagree’ to ‘strongly agree’). a Behaviour was assessed with a single item, ranging from 1 to 4, considering the different adoption levels (1=No technological innovation; 2=Level 1; 3=Level 2; 4=Level 3). | |||||||||||||||||||
4.2. Drivers of digital innovation
Table 2 shows the descriptive statistics of the latent and observable variables, as well as the tests conducted on the constructs. The factor loadings of the variable items (λ) exceeded 0.50, the Cronbach’s α and CR values were above 0.70, and the AVE values exceeded 0.50; these results, with the only exception of perceived ease of use, demonstrated strong reliability, as well as convergent and discriminant validity of all factors in the measurement model. Discriminant validity was further confirmed by verifying that the square root of the AVE for each construct, as shown in Table 3, was greater than the correlations between the constructs (Bagozzi and Yi, 2012).
| PU | PEU | OQ | SAFA | ANX | TSE | SN | BI | BEH | |||||||||||
|---|---|---|---|---|---|---|---|---|---|---|---|---|---|---|---|---|---|---|---|
| PU | 0.75 | 0.31*** | 0.63*** | 0.52*** | -0.28*** | 0.40*** | 0.36*** | 0.57*** | 0.36*** | ||||||||||
| PEU | 0.67 | 0.24*** | 0.31*** | -0.17** | 0.34*** | 0.14* | 0.28*** | 0.15* | |||||||||||
| OQ | 0.75 | 0.46*** | -0.21*** | 0.34*** | 0.43*** | 0.60*** | 0.35*** | ||||||||||||
| SAFA | 0.74 | -0.23*** | 0.63*** | 0.16* | 0.39*** | 0.19** | |||||||||||||
| ANX | 0.81 | 0.16** | -0.15* | -0.29*** | 0.17** | ||||||||||||||
| TSE | 0.89 | n.s. | 0.39*** | n.s. | |||||||||||||||
| SN | 0.73 | 0.44*** | 0.36*** | ||||||||||||||||
| BI | 0.88 | 0.40*** | |||||||||||||||||
| Note: PU = Perceived Usefulness; PEU = Perceived Ease of Use; OQ = Output Quality; SAFA = Sustainability Assessment of Food and Agriculture Systems; ANX = Anxiety; TSE = Technology Self-Efficacy; SN = subjective norms; BI = Behavioural Intentions; BEH = behaviour; Sign.: *** p<0.001, ** p<0.01, * p<0.01, n.s. = not significant. | |||||||||||||||||||
Model 1 showed a good fit with the collected data: χ2 (df) = 461.975 (280), CFI = 0.950, RMSEA = 0.051 (90%CI 0.043 – 0.059), TLI = 0.942 and SRMR = 0.054. The standardized path coefficients and their significance levels are shown in Table 4, whereas the unstandardized coefficients and standard errors are shown in the Appendix Table A2.
| Model 1 | Model 2 | ||||||||||||||||||
|---|---|---|---|---|---|---|---|---|---|---|---|---|---|---|---|---|---|---|---|
| R2 | β | p | Hypotheses | R2 | β | p | Hypotheses | ||||||||||||
| PU | 0.791 | 0.811 | |||||||||||||||||
| PEU → PU | 0.133 | 0.044 | H3b accepted | 0.118 | 0.068 | H3b accepted | |||||||||||||
| OQ → PU | 0.658 | <0.001 | H1a accepted | 0.693 | <0.001 | H1a accepted | |||||||||||||
| SAFA → PU | 0.199 | 0.027 | H1b accepted | 0.172 | 0.052 | H1b accepted | |||||||||||||
| SN → PU | 0.045 | 0.512 | H1c rejected | 0.033 | 0.627 | H1c rejected | |||||||||||||
| EMP → PU | 0.157 | <0.001 | |||||||||||||||||
| PEU | 0.305 | 0.302 | |||||||||||||||||
| TSE → PEU | 0.487 | <0.001 | H2a accepted | 0.488 | <0.001 | H2a accepted | |||||||||||||
| ANX → PEU | -0.169 | 0.041 | H2b accepted | -0.161 | 0.051 | H2b accepted | |||||||||||||
| BI | 0.651 | 0.653 | |||||||||||||||||
| PU → BI | 0.601 | <0.001 | H4 accepted | 0.616 | <0.001 | H4 accepted | |||||||||||||
| PEU → BI | 0.069 | 0.295 | H3a rejected | 0.056 | 0.380 | H3a rejected | |||||||||||||
| SN → BI | 0.278 | <0.001 | H5 accepted | 0.261 | <0.001 | H5 accepted | |||||||||||||
| UAA → BI | 0.081 | 0.068 | |||||||||||||||||
| BEH | 0.164 | 0.178 | |||||||||||||||||
| BI → BEH | 0.404 | <0.001 | H6 accepted | 0.376 | <0.001 | H6 accepted | |||||||||||||
| UAA → BEH | 0.158 | 0.006 | |||||||||||||||||
| Model fit indices | |||||||||||||||||||
| χ2 (df) | 461.975 (280) | 510.533 (328) | |||||||||||||||||
| CFI | 0.950 | 0.950 | |||||||||||||||||
| TLI | 0.942 | 0.943 | |||||||||||||||||
| RMSEA (90% C.I.) | 0.051 (0.043 – 0.059) | 0.047 (0.039 – 0.055) | |||||||||||||||||
| SRMR | 0.054 | 0.062 | |||||||||||||||||
| Note: PU = Perceived Usefulness; PEU = Perceived Ease of Use; OQ = Output Quality; SAFA = Sustainability Assessment of Food and Agriculture Systems; ANX = Anxiety; TSE = Technology Self-Efficacy; SN = subjective norms; BI = Behavioural Intentions; EMP = number of employees; UAA = average farm size (Utilised agricultural area); BEH = Behaviour. | |||||||||||||||||||
Overall, the model shows R2 values of 0.65 for the intention and 0.16 for the behaviour in adopting a new water-smart technology. This means that, respectively, 65.1% of the variance in intention and 16.4% of the variance in behaviour can be explained by the tested variables. The results suggest that the intention to adopt an innovative water-smart technology significantly influences the actual behaviour (i.e., the adoption of the technology itself), as postulated by H6 (p<0.001). Behavioural intention, in turn, is positively influenced by perceived usefulness with p<0.001, which is one of the two core variables of the TAM3 (H4 accepted).
Perceived ease of use does not significantly affect the intention to adopt technologies, therefore not supporting H3a; however, it positively affects perceived usefulness of new technologies with p<0.05, confirming H3b. H5 is also supported since subjective norm has a positive effect on the intention to adopt a technology (p<0.001), showing that perceived social pressure has an influence on the farmers’ motivation to adopt a new technology. The construct of anxiety shows a negative effect on the perceived ease of use (p<0.05), a property that is stimulating and that could open up new ways of designing and conceptualizing modern technologies. Perceived ease of use, on the other hand, is positively influenced by the self-efficacy of the technology, with p<0.001. In turn, perceived usefulness is influenced by the quality of the output (i.e., the perceived quality of the effects achieved by using the technology, p<0.001) and by the SAFA-based items (p<0.05).
When controlling for individual and organizational factors we have found that, among all observed items, only the average farm size (expressed in hectares of utilised agricultural area, UAA) and the number of employees have an effect on the endogenous variables. In particular, the number of employees positively influences respondents’ perceived usefulness (p<0.001), indicating that decision-makers in larger farms, in terms of workforce, find the innovative technology capable of enhancing farm performance. In turn, the average farm size in UAA positively influences the behaviour (p<0.001) and behavioural intentions (p<0.10). In other words, respondents working in larger farms are more willing to adopt the new technologies, or have already adopted them. Overall, the Model 2 shows good fit with the data (χ2 (df) = 510.533 (328), CFI = 0.950, RMSEA = 0.047 (90%CI 0.039 – 0.055), TLI = 0.943 and SRMR = 0.062) while also improving the explained variance of behaviour, up to 17.8%. The overall path and the tested hypotheses are confirmed, albeit with some of them showing slightly lower significance levels (Table 4).
Our study found that approximately 70% of the farmers interviewed did not adopt any of the proposed digital technologies. This finding confirms the limited adoption of innovative water-smart solutions in the Italian horticultural sector, highlighting the need to thoroughly understand the barriers and the factors that could promote such adoption. Therefore, the results of this study represent an important step toward achieving this goal. The applied extended-TAM3 model consistently explains around 18% of the variance in the behaviour (the adoption of water-smart technologies), and 65% of the variance in individuals’ intention to adopt the new digital technologies. We confirm that behavioural intention is a significant predictor of the behaviour, indicating that farmers motivation in adopting the innovative technologies affect the actual adoption. The applied model further assumes that the effect of other variables (e.g., self-efficacy) on behavioural intention is mediated by perceived usefulness and perceived ease of use. The findings are consistent with previous literature, particularly in relation to the importance of perceived usefulness (Davis, 1989; Venkatesh and Davis, 2000). Perceived usefulness was found to be a strong determinant of farmers’ intention to adopt new water-smart technologies, highlighting its role in shaping the adoption behaviour. Other studies conducted using TAM demonstrate that perceived usefulness is a central aspect for technology adoption, provided that it do not cause a significant increase in the production costs (Pierpaoli et al., 2013). This supports the findings of Paustian and Theuvsen (2017) and Shang et al. (2021), who emphasize the importance of clear and tangible benefits for adoption of technologies in agriculture.
However, our results differ from the TAM3 model with respect to the role of perceived ease of use, which has no influence on adoption intentions. While TAM3 suggests that perceived ease of use is an important determinant (Venkatesh and Bala, 2008), the limited impact observed can be attributed to contextual factors, such as the different levels of digital literacy and prior experience with technology among Italian farmers. The not significant effect of this factor was also found in another studies (for a review, see Osrof et al., 2023). In another study carried out in the Italian fruit and grapevine sector, perceived ease of use was found to be insignificant when adopting variable rate irrigation (Canavari et al., 2021). Schulze Schwering et al. (2022) also found that perceived ease of use may become less important when end users rely more on external support or community recommendations, as social norms take precedence.
Social norms were another important factor that positively influenced adoption intentions in our study, which is consistent with the findings of Senyolo et al. (2018). The role of perceived social pressure in motivating farmers suggests that fostering a culture of innovation and demonstrating success among peers may be critical to increasing adoption rates. Furthermore, our findings echo the observations of Dissanayake et al. (2022) that contextual and cultural factors play a significant role in shaping individuals’ intention to adopt innovative technologies.
By demonstrating that sustainability-related factors, such as improved water management and workforce skills, influence perceived usefulness, our study confirms the potential of sustainability considerations to improve technology uptake. This result is in line with the research findings of Montes de Oca Munguia et al. (2021), who advocate the inclusion of sustainability goals in the technology adoption framework. This last point is thought-provoking when it comes to examining the role of farmers and their commitment to sustainability, as well as their awareness of the use of smart devices to promote more sustainable practices. In the face of climate change and the pressure that agriculture is putting on environmental resources, only the direct and committed involvement of farmers can promote a more conscious and widespread use of smart technologies with the aim of reaping their benefits (Menozzi et al., 2015). Furthermore, linking sustainability aspects to the concept of usefulness could also promote higher acceptance and adoption rate, which underpins the positive impact for farmers in terms of profitability. This is also confirmed by the correlation indices between the SAFA-inspired construct and the technology self-efficacy and output quality constructs, that are both high and significant, 0.74 and 0.70 respectively.
Technology self-efficacy strongly affects perceived ease of use, indicating that individuals who are more confident in their ability to use the technology are more likely to perceive it as an easy task. In other studies, perceived behavioural control has been found to predict intentions to adopt agricultural sustainability schemes (Menozzi et al., 2015). On the other hand, our results also suggest barriers to adoption, including lack of digital skills and limited access to information, which is consistent with the observations of other studies (Osrof et al., 2023; Sabbagh and Gutierrez, 2023; Yigezu et al., 2018). To address these barriers, targeted training programs and policies are needed to lower the entry threshold for farmers, especially for farmers in resource-poor regions. Interestingly, the negative correlation between anxiety and perceived ease of use highlights the importance of developing technologies that minimize cognitive and operational barriers. In our study, we controlled the endogenous variables of the model (i.e., perceived usefulness, perceived ease of use, intention to adopt, and behaviour) with individual and organizational factors. Only farm size and number of employees had a significant effect on these variables, while the other constructs showed no significant effect. Another review revealed that several of these factors showed inconsistencies across multiple studies (Osrof et al., 2023). For instance, the insignificance effect of farmers’ level of education on decision-making could be explained by the possibility that highly educated farmers might opt for careers outside farming (Michels et al., 2020) or show interest in basic technology features that do not require extensive education (Wachenheim et al., 2021). Similarly, although numerous studies have found that older farmers are less motivated to adopt smart technologies on their farms, Osrof et al. (2023) identified a large number studies with inconsistent results, where age did not affect farmers’ adoption decisions. For example, age did not influence farmers’ intention to use smart technologies such as yield monitors with GPS (García-Jiménez et al., 2022). Farm location is also a notable barrier that might hamper the adoption of smart technologies, in particular if farms face unfavourable conditions such as climate, rainfall, or poor soil quality (Osrof et al., 2023; Paxton et al., 2011). However, in our case farm location did not significantly affect the endogenous variables, as other factors associated with this variable (e.g., farm size) likely masked this effect.
On the contrary, our study indicated that larger farms, in terms of UAA acreage, are more likely to be motivated to adopt the innovative water-smart technologies or have already adopted them. This finding confirms that larger farm size is consistently seen as pivotal for achieving economies of scale when adopting smart technologies that entail high investments and initial costs (Osrof et al., 2023).
The significant effect of the number of employees on the perceived benefit indicates that farms with a large workforce are more likely to believe that the use of water-saving technologies will improve their performance. This result can be interpreted in different ways. On the one hand, it could indicate that the use of these technologies could reduce the need for farm labour and thus reduce labour costs. On the other hand, it could indicate that these technologies are perceived to improve the knowledge and technical skills of employees and thus increase the productivity of the workforce. This second interpretation seems more consistent with the positive effect of the SAFA-based construct on perceived usefulness.
In summary, this study enriches the understanding of technology adoption in agriculture by confirming the relevance of the key TAM3 constructs and also highlighting context-specific variations. By addressing the identified barriers and harnessing the drivers of adoption, policy makers, technology developers and stakeholders can promote greater technology adoption and thus contribute to more sustainable and efficient agricultural practices.
The integration of digital technologies in the Italian horticultural sector is a multifaceted challenge influenced by a variety of individual, technological, social and contextual factors. This study shows that individual intention is an important determinant of the actual adoption of innovative water-saving technologies and highlights the crucial role of farmer motivation in decision-making. Perceived usefulness of these technologies has a significant effect on adoption intention, while perceived ease of use requires further investigation due to its limited relevance in the current context. Social norms were identified as an important determinant of farmers’ intentions, highlighting the importance of community influence and external support in promoting the adoption of digital technologies. To close the observed adoption gap, targeted interventions should be developed to address barriers such as digital literacy, infrastructure and accessibility of technology. Furthermore, the regional and culture-specific nuances observed in this study should be taken into account when developing customised strategies.
The results highlight important policy and business implications, suggesting that government agencies, agricultural cooperatives, and technology developers should emphasize the economic and environmental benefits of digital irrigation technologies. Encouraging farmer networks and knowledge-sharing initiatives could also accelerate adoption. By addressing these research gaps, this study contributes to both the academic literature and practical policy making. It provides a refined theoretical model to understand technology adoption in small- and medium-sized farms and offers practical insights to promote sustainable and efficient water management in agriculture. Further exploration of constructs that have negative correlates, such as anxiety, could lead to more user-centred technology design that reduces barriers to technology adoption and improves usability.
Some limitations of this study should be mentioned. The study reflects not only a specific context, such as the horticultural sector, but also national characteristics, which can vary greatly from country to country due to different regulatory and incentive frameworks, cultural practises and, most importantly, technological infrastructures. Nevertheless, the sample is not representative of Italian farmers. This must be taken into account when interpreting the results and deriving consequences for corporate management. An extension of the sample and a repetition of the study in other countries could therefore be interesting to test the validity of all the hypotheses put forward in the original theory. Second, we did not consider prospective behaviour, i.e., we did not measure actual behaviour in the future (i.e., future adoption of the innovative technologies), but only current behaviour. Although this approach is quite common in similar studies, it might have limited the compatibility of behaviour with its antecedents (McEachan et al., 2011). Moreover, this study used self-report measures about the behaviour which may be subject to response biases. However, the CATI method can help with complex or sensitive questions by allowing the interviewer to clarify questions and guide the respondent, thus reducing misinterpretation and encouraging more accurate responses (Dillman et al., 2014).
Despite these limitations, this study is, to our knowledge, one of the first aimed at investigating the relative importance of behavioural precursors in explaining the intention to adopt innovative water-smart technologies in Italian horticultural farms.
This study was carried out within the Agritech National Research Center and received funding from the European Union Next-GenerationEU (Piano Nazionale di Ripresa e Resilienza (PNRR) – Missione 4 Componente 2, Investimento 1.4 – D.D. 1032 17/06/2022, CN00000022). This paper reflects only the authors’ views and opinions, neither the European Union nor the European Commission can be considered responsible for them.
Adeyemi, O., Grove, I., Peets, S., and Norton, T. (2017). Advanced Monitoring and Management Systems for Improving Sustainability in Precision Irrigation. In Sustainability (Vol. 9, Issue 3).
Asadi, E., Isazadeh, M., Samadianfard, S., Ramli, M. F., Mosavi, A., Nabipour, N., Shamshirband, S., Hajnal, E., and Chau, K.-W. (2020). Groundwater Quality Assessment for Sustainable Drinking and Irrigation. In Sustainability (Vol. 12, Issue 1).
Bagozzi, R. P., and Yi, Y. (2012). Specification, evaluation, and interpretation of structural equation models. Journal of the Academy of Marketing Science .
Baldoni, E., Coderoni, S., and Esposti, R. (2018). Immigrant workforce and labour productivity in Italian agriculture: a farm-level analysis. Bio-Based and Applied Economics 6: 259–278.
Blasch, J., van der Kroon, B., van Beukering, P., Munster, R., Fabiani, S., Nino, P., and Vanino, S. (2022). Farmer preferences for adopting precision farming technologies: a case study from Italy. European Review of Agricultural Economics 49: 33–81.
Byrne, B. M. (2010). Structural equation modeling with AMOS: Basic concepts, applications, and programming, 2nd ed. In Structural equation modeling with AMOS: Basic concepts, applications, and programming, 2nd ed. New York, NY, US: Routledge/Taylor & Francis Group.
Canavari, M., Medici, M., Wongprawmas, R., Xhakollari, V., and Russo, S. (2021). A Path Model of the Intention to Adopt Variable Rate Irrigation in Northeast Italy. In Sustainability (Vol. 13, Issue 4).
Cimino, A., Coniglio, I. M., Corvello, V., Longo, F., Sagawa, J. K., and Solina, V. (2024). Exploring small farmers behavioral intention to adopt digital platforms for sustainable and successful agricultural ecosystems. Technological Forecasting and Social Change 204: 123436.
Davis, F. D. (1989). Perceived Usefulness, Perceived Ease of Use, and User Acceptance of Information Technology. MIS Quarterly 13: 319–340.
de Oca Munguia, O. M., and Llewellyn, R. (2020). The Adopters versus the Technology: Which Matters More when Predicting or Explaining Adoption? Applied Economic Perspectives and Policy 42: 80–91.
Dentoni, D., Cucchi, C., Roglic, M., Lubberink, R., Bender-Salazar, R., and Manyise, T. (2023). Systems Thinking, Mapping and Change in Food and Agriculture. Bio-Based and Applied Economics 11: 277–301.
Dillman, D. A., Smyth, J. D., and Christian, L. M. (2014). Internet, phone, mail, and mixed mode surveys: The tailored design method, 4th ed. In Internet, phone, mail, and mixed mode surveys: The tailored design method, 4th ed. Hoboken, NJ, US: John Wiley & Sons Inc.
Dissanayake, C. A. K., Jayathilake, W., Wickramasuriya, H. V. A., Dissanayake, U., Kopiyawattage, K. P. P., and Wasala, W. M. C. B. (2022). Theories and Models of Technology Adoption in Agricultural Sector. Human Behavior and Emerging Technologies 2022: 9258317.
Ermolieva, T., Havlik, P., Frank, S., Kahil, T., Balkovic, J., Skalsky, R., Ermoliev, Y., Knopov, P. S., Borodina, O. M., and Gorbachuk, V. M. (2022). A Risk-Informed Decision-Making Framework for Climate Change Adaptation through Robust Land Use and Irrigation Planning. In Sustainability (Vol. 14, Issue 3).
García-Jiménez, C. I., Velandia, M., Lambert, D. M., and Mishra, A. K. (2022). Information sources impact on the adoption of precision technology by cotton producers in the United States. Agrociencia .
Gemtou, M., Guillén, B. C., and Anastasiou, E. (2024). Smart Farming Technologies and Sustainability BT - Digital Sustainability: Leveraging Digital Technology to Combat Climate Change , T. Lynn, P. Rosati, D. Kreps, & K. Conboy (eds.). Cham: Springer Nature Switzerland , 99–120.
Kapsdorferová, Z. (2024). Key Drivers and Innovative Approaches to Sustainable Management in the Agricultural and Food Sector BT - Consumer Perceptions and Food , D. Bogueva (ed.). Singapore: Springer Nature Singapore , 349–362.
Kline, R. B. (2016). Principles and practice of structural equation modeling, 4th ed. In Principles and practice of structural equation modeling, 4th ed. New York, NY, US: Guilford Press.
McEachan, R. R. C., Conner, M., Taylor, N. J., and Lawton, R. J. (2011). Prospective prediction of health-related behaviours with the theory of planned behaviour: A meta-analysis. In Health Psychology Review.
Menozzi, D., Fioravanzi, M., and Donati, M. (2015). Farmer’s motivation to adopt sustainable agricultural practices. Bio-Based and Applied Economics 4.
Michels, M., von Hobe, C.-F., and Musshoff, O. (2020). A trans-theoretical model for the adoption of drones by large-scale German farmers. Journal of Rural Studies 75: 80–88.
Montanarella, L., and Panagos, P. (2021). The relevance of sustainable soil management within the European Green Deal. Land Use Policy 100: 104950.
Montes de Oca Munguia, O., Pannell, D. J., and Llewellyn, R. (2021). Understanding the Adoption of Innovations in Agriculture: A Review of Selected Conceptual Models. In Agronomy (Vol. 11, Issue 1).
Osrof, H. Y., Tan, C. L., Angappa, G., Yeo, S. F., and Tan, K. H. (2023). Adoption of smart farming technologies in field operations: A systematic review and future research agenda. Technology in Society 75: 102400.
Patle, G. T., Kumar, M., and Khanna, M. (2019). Climate-smart water technologies for sustainable agriculture: a review. Journal of Water and Climate Change 11: 1455–1466.
Paustian, M., and Theuvsen, L. (2017). Adoption of precision agriculture technologies by German crop farmers. Precision Agriculture 18: 701–716.
Paxton, K. W., Mishra, A. K., Chintawar, S., Roberts, R. K., Larson, J. A., English, B. C., Lambert, D. M., Marra, M. C., Larkin, S. L., Reeves, J. M., and Martin, S. W. (2011). Intensity of Precision Agriculture Technology Adoption by Cotton Producers. Agricultural and Resource Economics Review 40: 133–144.
Pierpaoli, E., Carli, G., Pignatti, E., and Canavari, M. (2013). Drivers of Precision Agriculture Technologies Adoption: A Literature Review. Procedia Technology 8: 61–69.
Sabbagh, M., and Gutierrez, L. (2023). Farmers’ acceptance of a micro-irrigation system: A focus group study. Bio-Based and Applied Economics 12: 221–242.
Schulze Schwering, D., Bergmann, L., and Isabel Sonntag, W. (2022). How to encourage farmers to digitize? A study on user typologies and motivations of farm management information systems. Computers and Electronics in Agriculture 199: 107133.
Senyolo, M. P., Long, T. B., Blok, V., and Omta, O. (2018). How the characteristics of innovations impact their adoption: An exploration of climate-smart agricultural innovations in South Africa. Journal of Cleaner Production 172: 3825–3840.
Shang, L., Heckelei, T., Gerullis, M. K., Börner, J., and Rasch, S. (2021). Adoption and diffusion of digital farming technologies - integrating farm-level evidence and system interaction. Agricultural Systems 190: 103074.
Ungureanu, N., Vlăduț, V., and Voicu, G. (2020). Water Scarcity and Wastewater Reuse in Crop Irrigation. In Sustainability (Vol. 12, Issue 21).
Venkatesh, V., and Bala, H. (2008). Technology Acceptance Model 3 and a Research Agenda on Interventions. Decision Sciences 39: 273–315.
Venkatesh, V., and Davis, F. D. (2000). A Theoretical Extension of the Technology Acceptance Model: Four Longitudinal Field Studies. Management Science 46: 186–204.
Wachenheim, C., Fan, L., and Zheng, S. (2021). Adoption of unmanned aerial vehicles for pesticide application: Role of social network, resource endowment, and perceptions. Technology in Society 64: 101470.
Yigezu, Y. A., Mugera, A., El-Shater, T., Aw-Hassan, A., Piggin, C., Haddad, A., Khalil, Y., and Loss, S. (2018). Enhancing adoption of agricultural technologies requiring high initial investment among smallholders. Technological Forecasting and Social Change 134: 199–206.
| Codes | Items | ||||||||||||||||||
|---|---|---|---|---|---|---|---|---|---|---|---|---|---|---|---|---|---|---|---|
| Perceived Usefulness | |||||||||||||||||||
| PU1 | This innovation would make my work easier | ||||||||||||||||||
| PU2 | This technology would make my work faster | ||||||||||||||||||
| PU3 | This innovation could improve my productivity | ||||||||||||||||||
| PU4 | By using this technology, I could reduce water consumption in my company | ||||||||||||||||||
| Perceived Ease of Use | |||||||||||||||||||
| PEU1 | This technology should be easy to use | ||||||||||||||||||
| PEU2 | Using this technology will not require much effort | ||||||||||||||||||
| Output Quality | |||||||||||||||||||
| OQ1 | I expect that the results of using this technology will be excellent | ||||||||||||||||||
| OQ2 | Using this technology will improve the quality of my products | ||||||||||||||||||
| OQ3 | By using this system, I would increase the efficiency of my work | ||||||||||||||||||
| OQ4 | By using this innovation, I would increase the quantity of product in the field | ||||||||||||||||||
| SAFA | |||||||||||||||||||
| SAFA1 | By using this innovation, I could help reduce water consumption | ||||||||||||||||||
| SAFA2 | With the introduction of this technology, employees could receive training and enhance their knowledge and technical skills | ||||||||||||||||||
| SAFA3 | By introducing this innovation, I could receive training and improve my technical skills | ||||||||||||||||||
| Anxiety | |||||||||||||||||||
| ANX1 | I get nervous when working with new technologies | ||||||||||||||||||
| ANX2 | New technologies make me feel uncomfortable | ||||||||||||||||||
| ANX3 | I am afraid of applying new technologies | ||||||||||||||||||
| Technology Self-Efficacy | |||||||||||||||||||
| TSE1 | I would use this technology easily if someone showed me how to use it | ||||||||||||||||||
| TSE2 | I would use this innovation easily if I had technical support | ||||||||||||||||||
| TSE3 | I would use this innovation easily if I were familiar with the system | ||||||||||||||||||
| Subjective Norms | |||||||||||||||||||
| SN1 | People whose opinions matter to me think that I should use this technology | ||||||||||||||||||
| SN2 | Many producers I know have already adopted this innovation | ||||||||||||||||||
| SN3 | My customers think that I should use this technology | ||||||||||||||||||
| Behavioural Intention | |||||||||||||||||||
| BI1 | I will definitely use this technology in the near future | ||||||||||||||||||
| BI2 | I intend to use this technology in the near future | ||||||||||||||||||
| BI3 | If there were no significant barriers, I would use this system in the near future | ||||||||||||||||||
| Note: All items were measured on a 7-point scale (from ‘strongly disagree’ to ‘strongly agree’). | |||||||||||||||||||
| Model 1 | Model 2 | ||||||||||||||||||
|---|---|---|---|---|---|---|---|---|---|---|---|---|---|---|---|---|---|---|---|
| Beta | S.E. | Beta | S.E. | ||||||||||||||||
| PU | |||||||||||||||||||
| PEU → PU | 0.202* | 0.100 | 0.176# | 0.097 | |||||||||||||||
| OQ → PU | 0.796*** | 0.136 | 0.824*** | 0.134 | |||||||||||||||
| SAFA → PU | 0.236* | 0.106 | 0.200# | 0.103 | |||||||||||||||
| SN → PU | 0.040 | 0.060 | 0.028 | 0.059 | |||||||||||||||
| EMP → PU | 0.249*** | 0.068 | |||||||||||||||||
| PEU | |||||||||||||||||||
| TSE → PEU | 0.308*** | 0.064 | 0.307*** | 0.064 | |||||||||||||||
| ANX → PEU | -0.098* | 0.048 | -0.093# | 0.047 | |||||||||||||||
| BI | |||||||||||||||||||
| PU → BI | 0.862*** | 0.110 | 0.890*** | 0.110 | |||||||||||||||
| PEU → BI | 0.149 | 0.142 | 0.121 | 0.138 | |||||||||||||||
| SN → BI | 0.351*** | 0.082 | 0.324*** | 0.080 | |||||||||||||||
| UAA → BI | 0.000# | 0.000 | |||||||||||||||||
| BEH | |||||||||||||||||||
| BI → BEH | 0.256*** | 0.039 | 0.240*** | 0.039 | |||||||||||||||
| UAA → BEH | 0.000** | 0.000 | |||||||||||||||||
| Note: PU = Perceived Usefulness; PEU = Perceived Ease of Use; OQ = Output Quality; SAFA = Sustainability Assessment of Food and Agriculture Systems; ANX = Anxiety; TSE = Technology Self-Efficacy; SN = subjective norms; BI = Behavioural Intentions; EMP = number of employees; UAA = average farm size (Utilised agricultural area); BEH = Behaviour. Sign.: *** p<0.001, ** p<0.01, ** p<0.05, # p < 0.10. | |||||||||||||||||||
1 Specifically, automatic irrigation systems are connected to sensors that monitor soil moisture and activate valves wirelessly; instead, predictive modelling integrates the first two solutions (soil moisture sensors and automatic irrigation systems) into predictive models that merge real-time data with historical data, analyse it, and make autonomous irrigation decisions thanks to water delivery schedules that optimize dosing based on specific crop requirements and environmental conditions.