Valuing cultural ecosystem services: an application to forest areas in Marche Region, Italy
Department of Agricultural, Food and Environmental Sciences (D3A), Università Politecnica delle Marche, Italy
*Corresponding author
E-mail: d.gambelli@univpm.it; alice@agrecon.univpm.it; andrea.cameli08@gmail.com; c.urbinati@univpm.it; a.vitali@univpm.it
Abstract. This article investigates the perceived relevance of cultural ecosystem services (ES) in two forest areas in the Marche region (Italy) and how users, tourists and locals value them economically. Two surveys were used to collect data from visitors to the two areas. Through Importance Performance Analysis (IPA), we assessed visitors’ satisfaction with cultural ES in the two areas under investigation. The economic appraisal of the ecosystem services in the two forest areas was based on a contingent valuation method (CVM) using a double-bounded approach to estimate visitors’ willingness to pay (WTP). This type of research, merging qualitative and monetary evaluation of ES can contribute to defining policy management by identifying aspects and activities in natural areas that require specific intervention. Evidence for the economic value delivered by a broader range of ES may support the definition of more effective policy measures for forest areas and create the basis for the definition of payment schemes for ES.
Keywords: cultural ecosystem services, contingent valuation, importance-performance analysis.
JEL codes: Q26, Q50, Q57, Z32.
Index
2.1 Areas of the study: Monte Nerone and Cesane Regional Forest
2.2 CICES V 5.1 classification for the identification of ecosystem services
2.3 Importance- performance-analysis
2.4 Contingent Valuation Method
2.5 Structure of the conducted survey at both study sites
3.1 Identification of Cultural Ecosystem Services
3.2 Main visitors’ characteristics and features of the visits
3.3 Importance Performance Analysis (IPA)
Global interest in the study of ecosystem services (ES) is increasing constantly. ES are defined as benefits people obtain from ecosystems and are generally classified into four main categories: supporting, provision, regulation and cultural, beyond the encompassing supporting category (Millenium Ecosystem Assessment, 2005). The most common examples are protection from hydrogeological instability, pollination, atmospheric regulation, wood supply and all recreational activities. The basic concept behind ES is that human well-being depends on the services provided by nature, and they, in turn, depend on the correct functioning of ecosystems (Haines-Young, 2010). For economists, the term “benefit” refers to an economic advantage provided by an environmental good or service obtained from the sum of what all members of society would be willing to pay for its use (Barbier et al., 2011). Regardless of the valuation methods, cultural ES often provide the highest monetary value compared to all other services. Cultural services account for about 40% of the total monetary value of ecosystem services at the European level, with a total value of about 50 million euros, of which 62% are from forests (Vallecillo et al., 2019). Forest management, maintenance of accessibility conditions to natural areas, dedicated facilities, etc., are essential for the fruition of ES (Boyd and Banzhaf, 2007) and may represent costs for society and policy. However, economic benefits are difficult to quantify as most ES are public goods without a proper market and explicit monetary value. Consolidated environmental economics approaches for the appraisal of the total economic value of public goods refer to direct and indirect methods. These methods may provide a solution for the monetary value of a natural area but cannot provide a qualitative evaluation of the ecosystem services delivered. In this paper, we follow an integrated approach joining a formal evaluation of qualitative assessments of visitors to two forest areas based on an Importance-Performance Analysis (IPA) (Martilla and James, 1977), together with a contingent valuation method (CVM) using a double bounded model to economically value the willingness to pay (WTP) for cultural services. While CVM is an established approach for evaluating forest ecosystem services (Di Franco et al., 2021), few studies have used a double-bounded model to estimate environmental value in forest areas (Chatterjee, 2019).
The two forest areas, Monte Nerone and the Cesane Regional Forest are in the Marche region (Central Italy). Due to the high recreational attractivity of both sites, we evaluated the cultural ecosystem services identified according to the CICES classification. The two studies were carried out in the year 2022 for MN and in the year 2023 for CRF. The study at MN was part of the BIOSEIFORTE research program (financed by the Rural Development Plan of Marche Region). The study at CRF is part of a Research Agreement between UNIVPM and the local administration (Unione Montana Alta Valle del Metauro).
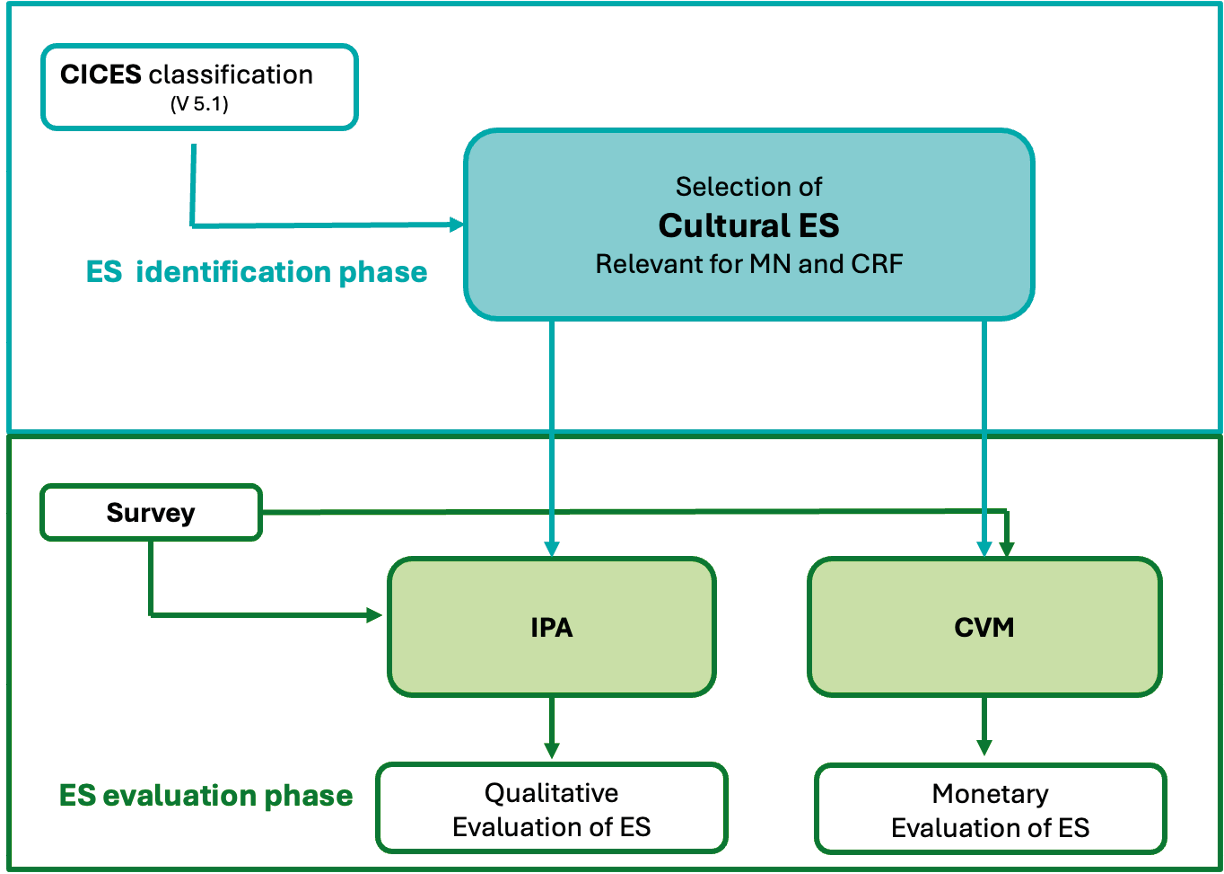
The first part of the study is concerned with identifying the primary cultural ecosystem services in the two areas studied. In this phase, the CICES V5.1 hierarchical classification was applied to determine which services would be analyzed in the second phase. The next part of the study focused on qualitative and monetary evaluation of these services. Data were collected through a survey distributed to visitors of the two areas, gathering information to i) classify ecosystem services (ES) according to the Importance-Performance Analysis (IPA) methodology and ii) determine visitors’ willingness to pay for the conservation of cultural services. This approach allowed us to assess tourists’ satisfaction with ES and the economic value they assign to maintaining these services. Figure 1 presents a schematic overview of the ES selection and evaluation procedure implemented in this study.
2.1 Areas of the study: Monte Nerone and Cesane Regional Forest
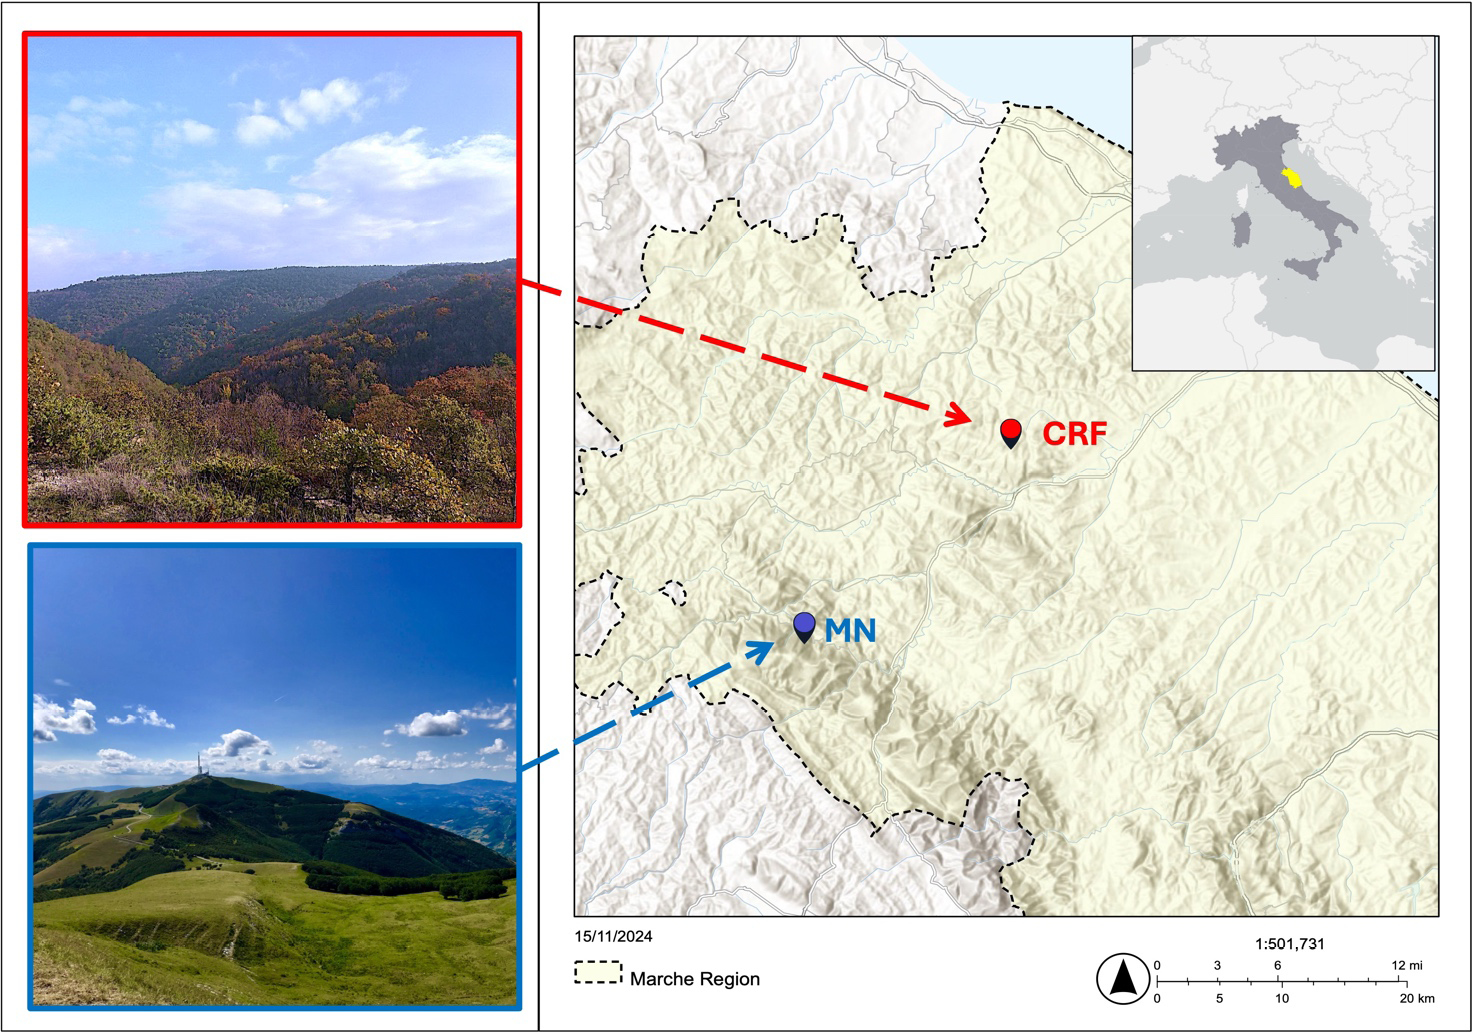
The study involved two large forest areas in the province of Pesaro and Urbino (Marche Region, Central Italy): the Monte Nerone area (MN) and the Cesane Regional Forest (CRF). The two forests are respectively in the Apennines and pre-Apennines areas (Figure 2). Nevertheless, they have different characteristics due to their natural context, extension, and forest type, and they may be attractive to different cultural and recreational activities. MN is located at a higher altitude, is a broader area, and features a more diversified orographic structure, ecotypes, and landscape. MN is characterized by a forest mosaic and secondary grasslands intended for semi-wild grazing of native cattle and horses of the Catria breed. The MN area covers approximately 1800 hectares with a maximum altitude of 1525 m asl. MN is a typical semi-natural landscape of the central Apennines and represents a destination for hiking and speleological activities. The ownership of most forests and pastures in MN belongs to local rural communities. CRF extends for 1500 hectares at a lower altitude (max 650 m asl). It is mainly a coniferous evergreen forest, and in 2017, it was affected by a severe forest fire. CRF offers an unusual alpine forest landscape in rural farming surroundings. This specific characteristic is due to an extensive conifer plantation (mainly black pine) that was begun by the World War One Austrian prisoners and ended in the 1950s. The CRF was a State property until the 1970s, then attributed to the Marche Region and managed by the Unione Montana Alta Valle del Metauro (a consortium of municipalities in mountain areas) through a 10-year Forest Management Plan. The CRF territory is suitable for mountain biking, trekking and mushroom picking. Wildlife is present and very diverse in both areas, especially in the MN due to its higher naturalness. MN hosts the Natura 2000 Network sites, particularly a Special Area of Conservation (SAC) and a Special Protection Area (SPA)1. CFR has lower wildlife potential, being primarily a conifer plantation, but its main high forest structure enhanced the occurrence of important species such as the forest diurnal raptors. In both areas, the presence of the wolf is well documented.
2.2 CICES V 5.1 classification for the identification of ecosystem services
The classification divides ecosystem services into three categories: provisioning, regulating and cultural with a hierarchical structure, which is then divided into divisions, class groups and class types. The hierarchical structure allows users to identify the most appropriate level of detail required for identifying relevant ES. Given our interest in cultural ES, we used the CICES V.5.1 classification because, among other acknowledged schemes (FAO, TEEB and IPBS2), it explicitly defines boundaries between ecosystem and society, describing cultural ecosystem services as “all the non-material and normally non-rival and non-consumptive, outputs of ecosystems (biotic and abiotic) that affect physical and mental states of people” (Haines-Young and Potschin, 2018, p. 10) For example, a recreational activity such as an excursion is not considered an ecosystem service but a final service such as a benefit from the landscape amenity or specific geomorphological layout. The V5.1 version is the most recent classification formulated by the European Environment Agency and the “System of Economic and Environmental Accounts (SEEA)” working group of the United Nations Statistics Division.
The hierarchical structure of CICES classification allows the adaptation of ES selection to the specific characteristics, exploiting specific and detailed information available for the two study sites.
2.3 Importance- performance-analysis
IPA (Martilla and James, 1977) is based on the theory of customer satisfaction and compares measures of importance and performance for a set of indicators within a two-dimensional space. Due to its simplicity and practical result interpretation, IPA is widely applied in various sectors such as tourism and leisure, banking, healthcare, etc. (Boley et al., 2017). Fan et al. (2023) assessed cultural ecosystem services in different forest areas in China using IPA to compare ES classification across different natural areas. Other recent IPA applications in the field of environmental studies and the definition of management strategies in recent years refer to Chen et al. (2021), Gambelli et al. (2021), Wu et al. (2022), Suryan and Lee (2024). Deng (2007) discusses how IPA may contribute to supporting tourist attraction managers in making decisions on allocating scarce resources more efficiently and ensuring the highest level of tourist satisfaction. Boley et al. (2017) provide a study to evaluate sustainable tourism initiatives.
In our context, importance refers to the relevance that visitors assign to an ES according to their values and preferences, and performance refers to the degree of satisfaction for visitors related to the actual ES enjoyment in the MN or CSRF they visit. For instance, a visitor may consider the availability of tourist services as an essential feature but may find the actual availability of these services unsatisfactory when visiting a specific site. Scores for the importance and performance of specific ES are elicited through a 5-degree Likert scale.
IPA compares measures of importance (I) and performance (P) for the set of selected ES in a two-dimensional space. Each ES is uniquely placed in an orthogonal axis diagram by its coordinates, which refer to the average scores for importance and performance. The origin of the orthogonal axis, or crossing point (CP), may refer to the sample mean (or median) of the importance and performance scores of the selected ES or to the Likert scale mean (Sever, 2015). Martilla and James (1977) suggest using the sample mean replaced by the sample median in cases of low variance. Oh (2001) recommends the scale mean, which facilitates result interpretation and comparison, but also considers the sample means as a possible alternative. The sample mean allows for a more effective ES classification. Our study considered the sample mean a crossing point as the output variance was relatively high, and the scale mean did not offer an adequate ES classification.
We have adapted the standard IPA classification to the context of ES valuation and defined the four IPA categories as follows:
“Satisfactory”: ES with both importance (I) and performance (P) scores higher than their respective crossing points (CP). This category identifies ES that are satisfactory for visitors, as the experienced performance matches the importance they assign to that ES.
“Unsatisfactory”: ES with I > CP and P < CP. This is the most critical category as it highlights where performance is inadequate compared to the importance attributed to the ES, indicating a need for intervention where possible.
“Redundancy”: ES with I < CP and P > CP. This category indicates ES where performance exceeds importance, indicating a sort of “oversupply” for an ES with respect to the visitors’ preferences.
“Low relevance”: ES with I < CP and P < CP. This category pertains to ES, where both importance and performance are low; hence, ES may be considered irrelevant for visitors.
2.4 Contingent Valuation Method
The cultural ES considered in this study are non-market goods not subject to tariffs and are, therefore, typically pure public goods. These have no exclusive ownership and no rivalry among consumers (Tuati et al., 2022) and, therefore, escape the supply and demand laws regulating the market and generating a price. The contingent valuation method (CVM) (Alberini and Kahn, 2006; Mitchell and Carson,1989; Carson, 2012) is a widely used direct method for estimating the monetary value of environmental goods without an associate market price. CVM is based on determining people’s willingness to pay (WTP) to obtain an environmental good or to accept compensation for not obtaining it (WTA) using a questionnaire compiled by a random sample of respondents (Hanemann, 1991).
The CVM is a direct method for assessing WTP because it involves people stating directly the values they ascribe to environmental goods (Turner et al., 1993). The main advantages of CVM are that it provides estimates independent of the actions taken, captures the value individuals place on environmental assets, and assesses the natural resources that people consider essential even if they have never visited them (Bateman and Turner, 1992). Furthermore, CVM takes into consideration non-use values. The quality of results from a CVM is conditional on how the survey or questionnaire is defined and distributed and on the attitude of respondents (Arrow et al., 1993; Bateman and Willis 2001; Carson et al., 2001, 2003; Mitchell and Carson, 1989; Portney, 1994; Sajise et al., 2021; Whittington, 2002).
Errors and biases related to the survey design can be summarized as follows:
Information bias arises if respondents do not entirely understand the good or service being valued. Inadequate or misleading information can lead to incorrect valuations. The survey must be designed so that responses are informed, not forced, and accurately reflect respondents’ interests.
Starting point bias occurs due to an inappropriate (i.e. too low or too high) initial value suggested as a bid in a survey influencing respondents’ valuations.
Payment vehicle bias arises when the payment method suggested in the survey (e.g., taxes, donations, payments for a service) can affect respondents’ stated WTP. Some payment vehicles might be more acceptable or realistic to respondents than others. It is therefore important to clearly describe the payment arrangements and the hypothetical market, including the responsible parties and the expected benefits: the survey must simulate a satisfactory transition.
General biases related to the survey administration may refer to design and sampling biases. The first arises due to poor survey design, such as confusing or leading questions, that can influence respondents’ answers. The second one arises when the sample of respondents is not random, is very small, or is affected by low response rates. This could skew CVM results, e.g. if some strongly involved respondents are over-represented in the sample.
Errors and biases that the attitude and stance of respondents may introduce can be summarized as follows.
Hypothetical bias occurs when respondents do not take the valuation scenario seriously because it is hypothetical. As a result, their stated WTP or WTA might differ from what they would pay or accept in a real-world situation.
Strategic bias arises from respondents’ “free riding” attitudes, which might intentionally misstate their WTP or WTA to influence the outcome. For example, respondents might understate their WTP to avoid higher costs or overstate their WTA to receive more compensation.
Moral effects may skew CVM results if respondents express a WTP that reflects their general goodwill or moral satisfaction from contributing to a cause rather than the actual value they place on the specific good or service being valued or if they give socially desirable answers if they feel judged by the interviewer.
These errors and biases can be mitigated mainly for those relating to the survey design and distribution. Errors related to respondents’ attitudes are more elusive and may be controlled to some extent by trained interviewers. Table 1 summarizes the solution adopted to take the errors and biases of our CVM under control.
| Limits of CVM | Solutions adopted |
|---|---|
| Information bias | Description of the environmental area: its potential and limits (example: fires). Description of possible scenarios with or without economic participation of tourists. |
| Starting point bias | A wide range of random values was chosen from 5 euros to 20 euros for MN and from 10 to 30 euros for CRF. |
| Payment vehicle bias | Pre-testing for different payment vehicles to check for ease of understanding and applicability to the context of the two areas |
| Sampling bias | Selection of a random sample and random initial bids. Compilation of survey with Qualtrics software with mandatory responses. |
| Hypothetical bias | Pilot administration as a pre-test. Detailed description of the current state of environmental assets and the possible future scenario. |
| Strategic bias | It was specified that the sum declared by the interviewee would have created a hypothetical market for research purposes and that they would not have to support any actual payments. |
| Moral effects | Survey administrators were trained in neutrality. Administration of the questionnaire to several interviewees that could make the sample statistically significant. |
There are three primary approaches for eliciting WTP using contingent valuation. The first approach utilizes open-ended questions, where respondents are directly asked how much they are willing to pay for a described good or service within a hypothetical scenario. The second method utilizes payment cards, presenting respondents with a range of possible payment amounts from which they select the one closest to their valuation. The third method employs dichotomous choice questions. Here, respondents are presented with a hypothetical scenario and asked whether they would be willing to pay a specified amount (X), to which they may respond with either “yes” or “no”. Our analysis followed a double-bounded dichotomous choice approach. The method was initially proposed by Hanemann et al. (1991). For applications and discussions of this method in environmental studies, see also Hanemann (1994), Batemann and Willis (1994), and Carson Hand Hanemann (2005). The double-bound method asks respondents to accept paying an initial sum of money (bid). If the interviewee accepts the initial bid, a higher bid is proposed, which can be accepted or rejected. If the initial bid is rejected, a lower bid is proposed, which can be accepted or rejected. Initial bids cover increasing monetary values, and respondents for each initial bid are selected randomly. The advantages of the double-bounded approach can be summarized as follows. By asking a follow-up question with a different bid amount (higher or lower, based on the respondent’s initial answer), double-bound models gather more information from each respondent while providing a lower and upper boundary to WTP, which cannot be considered in open-ended, payment card or standard dichotomous choice models. As a result, double-bound models reduce the variance of the WTP estimates, improving their statistical efficiency and leading to more precise estimates of willingness to pay (WTP). Also, they can mitigate the hypothetical bias as the second question in double-bounded models can help respondents think more carefully about their WTP, potentially reducing hypothetical bias. Finally, double-bound models mitigate the issue of starting point bias, as the second bid may “adjust” the initial response.
2.5 Structure of the conducted survey at both study sites
The survey for both MN and CRF was based on questionnaires sharing the same structure. These questionnaires were extensively pre-tested before distribution. An introductory section provided details about the general type of research, its authors, and its aims, namely, the evaluation of ES in forest areas. The second section of the questionnaire concerned the personal and demographic data of the interviewee. The third section of the questionnaire concerned questions about the characteristics of the visit (motivation, vehicles used, distance, etc.). The fourth and fifth sections hold questions for eliciting IPA and WTP assessment data, respectively. The questions for the WTP were explicitly adapted to MN and CRF. Questions concerning WTP analysis were asked after the interviewees answered those concerning the importance and performance of the various ES. In this way, we expect their statements about WTP to be expressed after a cognitive evaluation of the areas, hence providing more reliable evaluations.
For MN, we considered the purchase of a car parking ticket for access to different car parking areas as a payment vehicle. The initial bids were 5, 10, 15, or 20 euros per daily ticket that could be used in different sites of the broad mountain area. The unique payment for parking in different areas was used as a payment vehicle due to the simplicity and intuitiveness of payment and the extension of the MN area.
In CRF, we instead asked for the willingness to pay money to contribute to wildfire prevention actions within the sustainable forest management framework. The reason for this payment vehicle was that in the summer of 2017, 150 ha were burned in the CRF. The fire had a considerable emotional impact on visitors and seriously compromised the accessibility to the area for various years. In the CRF questionnaire, we provided information about possible forest disturbances (e.g., fires, frost, wind, insect epidemics) that could have reduced services offered by the forest. For CRF, the initial bids were set as 10, 20, or 30 euros annual payments.
Qualtrics software was used to manage questionnaire distribution and data collection. Questionnaires were distributed face-to-face to visitors for MN and CRF and online. Social media were used for online distribution in collaboration with outdoor and cultural associations. Only respondents who visited the study sites at least once were considered. Consent for data processing according to European data regulation was requested as a necessary condition for compiling the questionnaire. We excluded incomplete questionnaires from the analysis. After removing cases with incomplete responses, we selected and processed 88 questionnaires for MN and 114 for CRF. The samples of visitors for MN and CRF cannot be considered representative of the population, and some differences are presented in Fig 5 and discussed in section 3.2. Also, questionnaires were distributed in the summer months, when the number of visitors was higher. The seasonal bias of data collection should be taken into consideration when interpreting the results of the analysis.
3.1 Identification of Cultural Ecosystem Services
The selection of the relevant Cultural ES for MN and CRF was managed mainly through the collaboration with local stakeholders involved in preliminary ES selection in the BIOSEIFORTE research project for MN and in the Research Agreement for the CRF. On-site inspections and participatory meetings with local stakeholders were used as the basis for the final ES selection.
The services identified are listed in Table 2. Exploiting the possibility of including non-listed ES in CICES V5.1 protocol (identified by generic ES service with two last digits “xx” code), we added “refreshment opportunities”, “environmental education activities”, “guided nature tours”, and the “presence of historic sites” to the standard CICES classification (Table 2).
| Section | Division | Group | Class | Class type | Code | MN cultural ES | CRF cultural ES | Reclassification of ES for IPA |
|---|---|---|---|---|---|---|---|---|
| Cultural | Direct, in-situ and outdoor interactions with living systems that depend on presence in the environmental | Physical and experiential interactions with natural environment | Characteristics of living systems that enable activities promoting health, recuperation or enjoyment through active or immersive interactions | By type of living system or environmental setting | 3.1.1.1 | MTB trails, 39 CAI trails, horse trails, silvoterapic trail (CNR). | MTB trails, 16 CAI trails, horse trails | Hiking trails variety. Usability for disabled people. Usability for children |
| Physical and experiential interactions with natural abiotic components of the environment | Natural, abiotic characteristics of nature that enable active or passive physical and experiential interactions | 6.1.1.1 | 11 underground cavities for speleological activities | Special surface geological formations | Hiking trails variety. Usability for disabled people. Usability for children |
|||
| Intellectual and representative interactions with natural environment | Characteristics of living systems that enable scientific investigation or the creation of traditional ecological knowledge | 3.1.2.1 | 3 floristic areas, 3 sites Nature 2000 network: SPA, SAC and SPA/SAC | 3floristic areas | Richness of flora and fauna | |||
| Characteristics of living systems that enable education and training | 3.1.2.2. | Martelloscopes | Martelloscopes | Richness of flora and fauna | ||||
| Other characteristics of nature that have cultural significance | Other | Other | Use nested codes to allocate other cultural services from living systems to appropriate Groups and Classes | 6.3.1.1 | Presence of historical cultural sites. Tourist accommodation services |
|||
The final selection of ES is common for both MN and CRF. The satisfaction of visitors for these ES were analyzed in the IPA.
3.2 Main visitors’ characteristics and features of the visits
The second and third sections of the questionnaire referred to the visitor’s demographic data and the features of the visits for the MN and CRF (Figure 3). A chi-squared test was performed to check for statistical differences between the distribution of the various variables in the two samples. The two samples are statistically different for all variables except gender; therefore, we separated MN and CRF for IPA and WTP estimation.
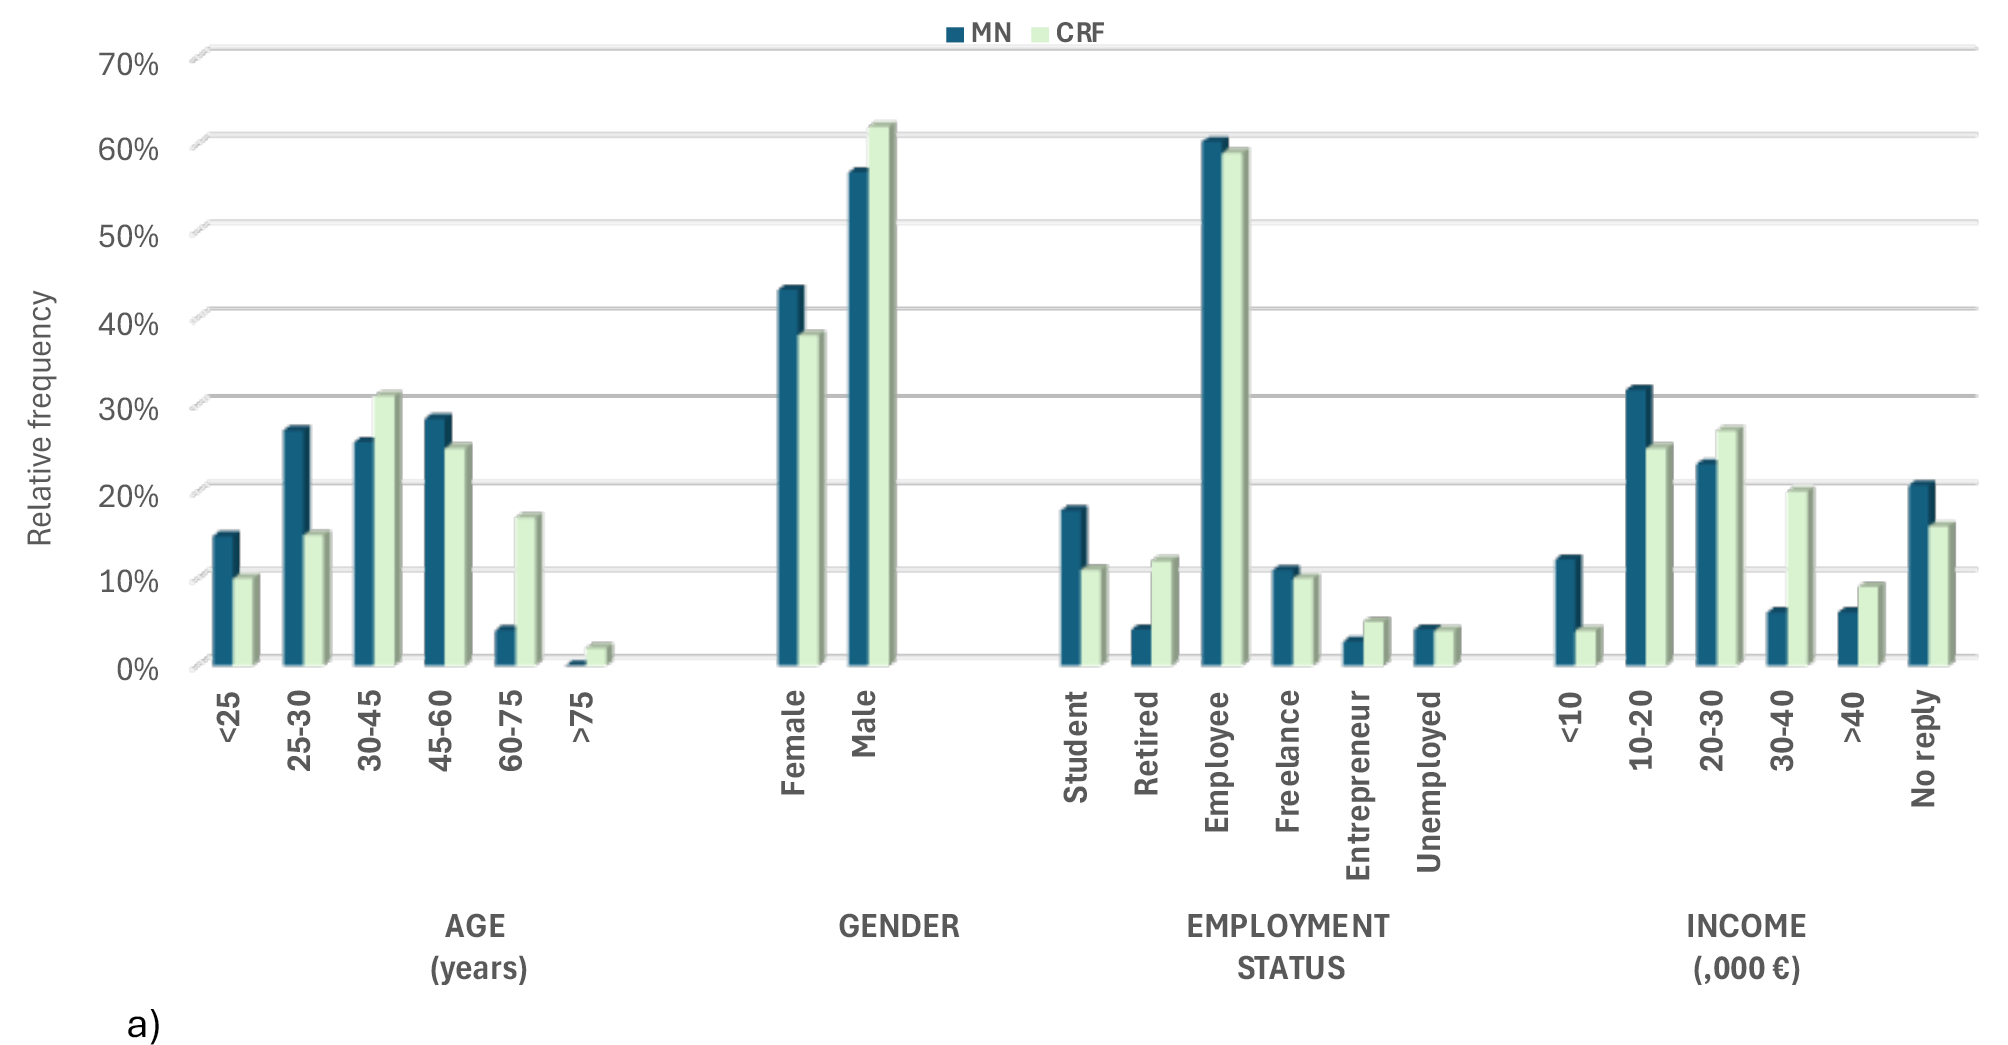
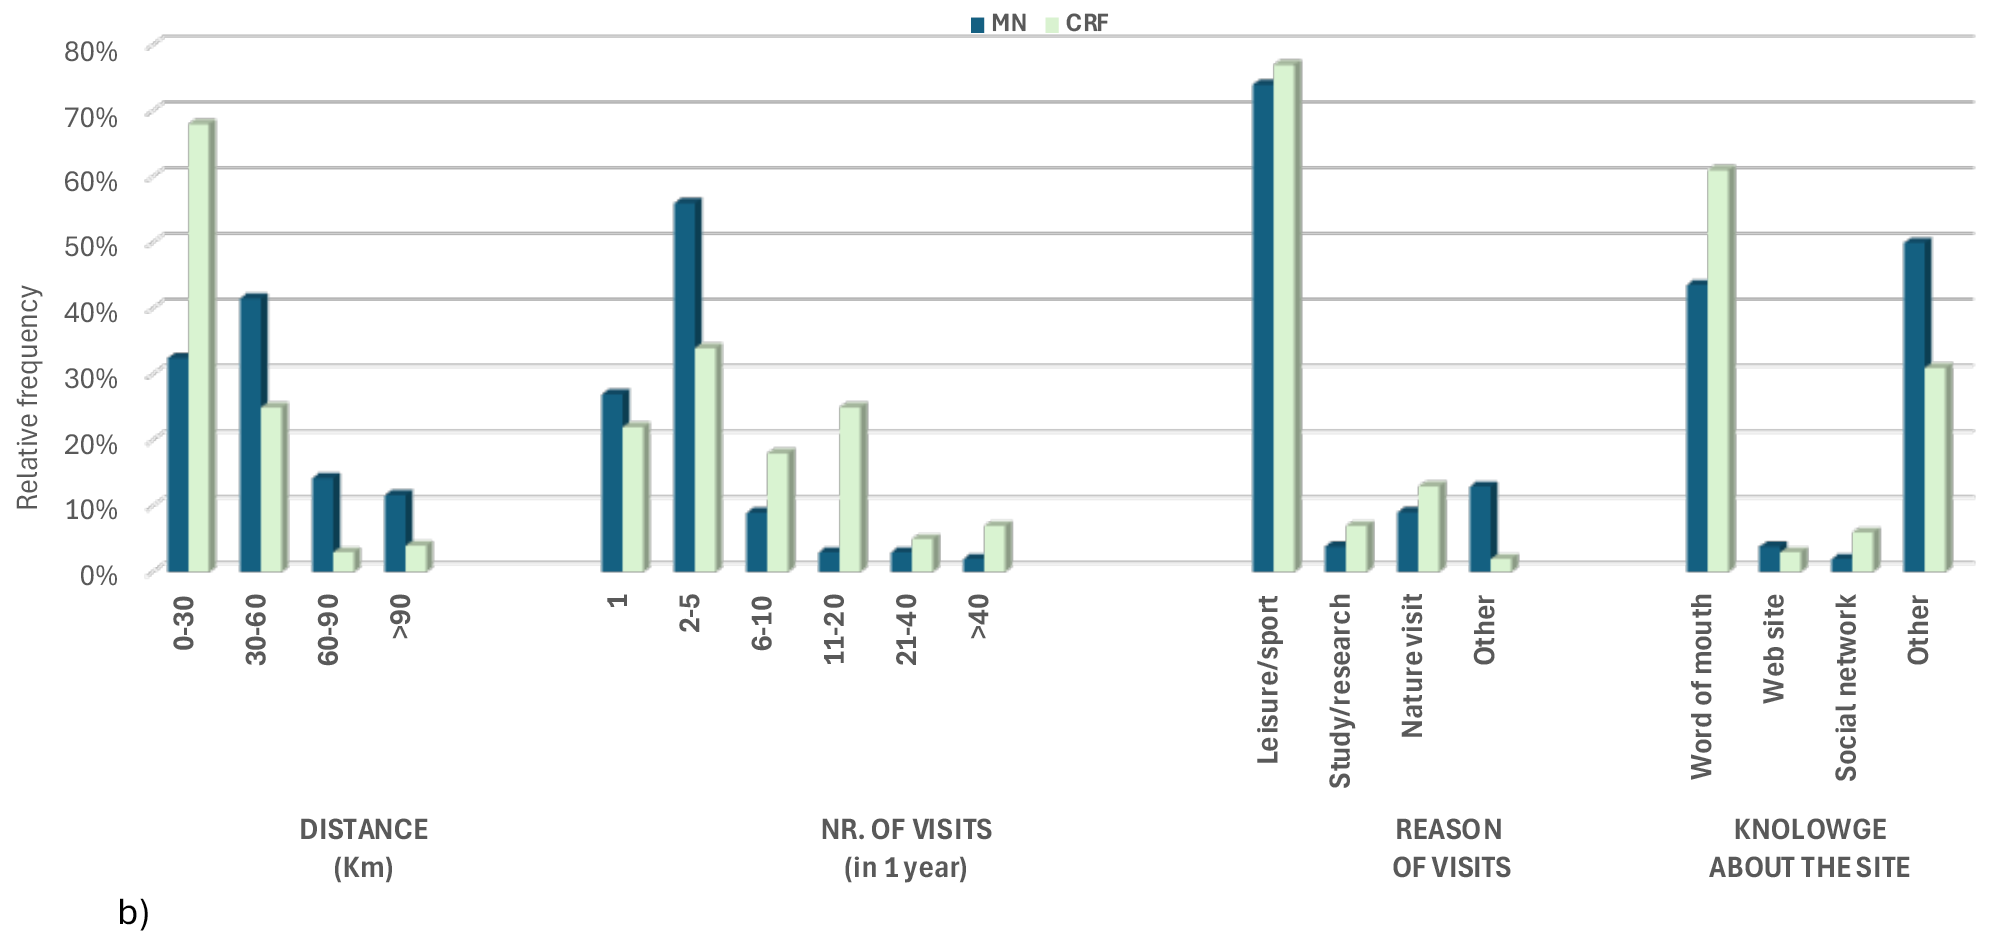
For both areas, the share of male visitors is relatively higher than that of females. The most represented employment category is “employee”, followed by a significant amount of “student” for both samples. Age distribution is more uniform for MN due to a large share of students visiting, while older visitors are more common at CRF. These data might explain why high-income visitors are more frequent at CRF. Concerning the general features of the visits, the average distance in CRF is shorter than in MN, with nearly 70% of visitors from less than 30 km. The short distance covered by visitors of CRF may be the reason for the higher number of visits per year in this area, even if for both areas, the interviewee mostly visits the place 2 to 5 times per year. Short distances may also be the reason for “word of mouth” as the primary source of information for the visit. Finally, “leisure” (walking, sport, and relaxation) is the most relevant reason for visiting both MN and CRF, confirming cultural ES’s relevance at both sites.
3.3 Importance Performance Analysis (IPA)
According to Martilla and James (1997), interviewee satisfaction is a function of two components: the importance of the product or service and the performance of the system that provides it. Importance and performance were rated by interviewees in both MN and CRF using a 5-point Likert scale. The results of the IPA are shown in Figure 4, where the selected cultural ES are placed in the four quadrants according to the average scores for importance and performance. Sample means were used as crossing point coordinates (Silva et al., 2011; Martilla and James, 1977). The overall outcome from IPA is that ES are broadly distributed on the bisector of the Satisfactory and Low Relevance quadrants. This result indicates that visitors’ expectations are met in MN and CRF: the performance of ES (which indicates how much visitors have enjoyed the ES) is proportional to the importance they give to the ES. A second general result is that the number of ES classified as Satisfactory is higher for MN.
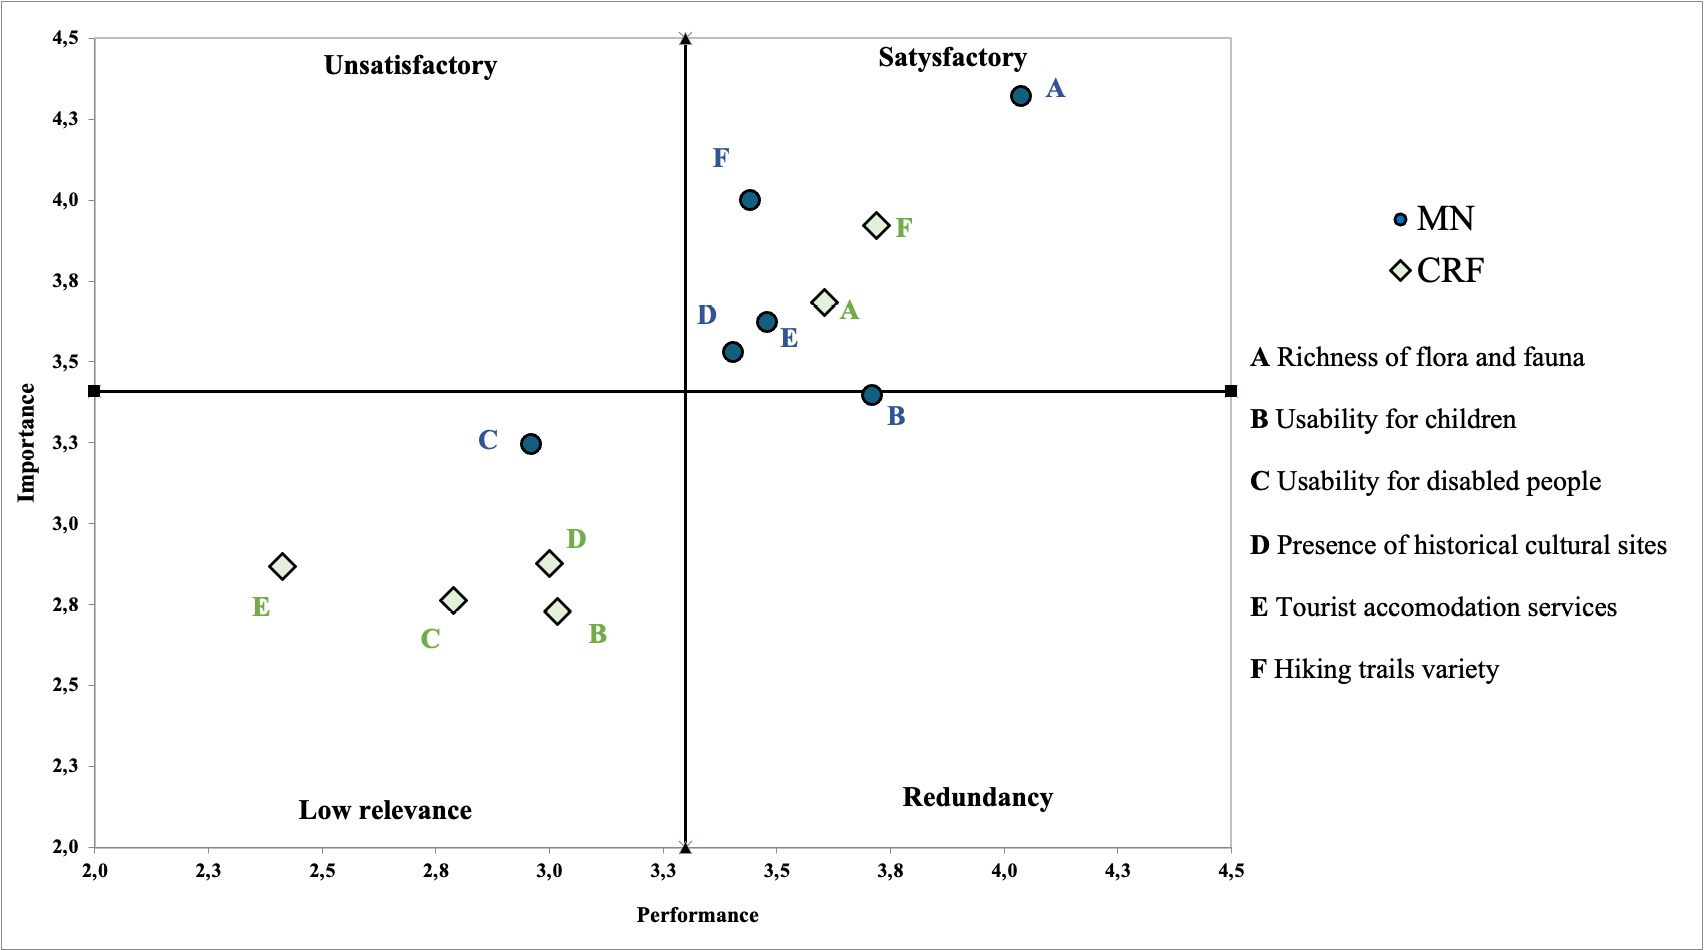
The “richness of flora and fauna” and the “hiking trails variety” are the two ES with the highest Satisfactory scores for both MN and CRF. However, some differences may be identified between the two areas. Given its wider environmental and ecosystem diversity (different forest types, grasslands, pastures, mountain peaks, etc.) MN has a higher animal biodiversity that hikers perceive better. CRF not only features a lesser landscape heterogeneity but also hikers perceive biodiversity mainly within the forest. The outcomes of “tourist accommodation services” are controversial. Accommodation services are available in MN and are more relevant here due to the larger size of the area and the longer travel distances for visitors.
On the other hand, the “low priority” classification of this ES for CRF may be due to the large percentage of visitors from neighbouring areas and the scarcity of local overnight accommodation. “Usability for children” was classified as Satisfactory for MN and Low Relevance for CRF. This result is related to the environmental features of the two areas. In MN, meadows become outdoor destinations for family, even in winter, and allow leisure and sports activities in the snow, which is unusual in the Marche region. Closed forests entirely cover the CRF area with some steep slopes, which may be unsuitable for children. Usability for people with disabilities was classified as Low Relevance for CRF and MN. This result might be conditioned by the lack of respondents with disabilities in the sample. Finally, visitors’ satisfaction with the “presence of historical sites” in MN reflects the availability of heritage sites due to the broader area that includes villages and other historically relevant sites. The proximity of Urbino, a UNESCO heritage site, is not considered a relevant aspect for visitors to CRF.
For MN and CRF, final samples of 88 and 113 interviewees, respectively, were available for estimating WTP. For MN, 66% of interviewees stated that they would accept in principle to pay a sum for accessing the area (regardless of the payment vehicle); the percentage drops to 61% for CRF. Respondents who stated they would pay to access MN or CRF were asked to participate in the bidding procedure. WTP in the two areas was estimated using two payment vehicles (see section 2 for details). Initial bids were different for MN (5€, 10€, 15€, 20€) and CRF (10€, 20€, 30€) and were proposed randomly to interviewees. The distribution of acceptance and refusal for the different initial bids are shown in Table 3.
| MN Bid1 | MN Bid2 | |||
|---|---|---|---|---|
| 5 euro | No (0%) | 3 euro | - | - |
| Yes (100%) | 7 euro | Yes (43%) | No (57%) | |
| 10 euro | No (23%) | 7 euro | Yes (67%) | No (33%) |
| Yes (77%) | 13 euro | Yes (40%) | No (69%) | |
| 15 euro | No (61%) | 10 euro | Yes (27%) | No (73%) |
| Yes (39%) | 20 euro | Yes (43%) | No (57%) | |
| 20 euro | No (54%) | 10 euro | Yes (43%) | No (57%) |
| Yes (46%) | 30 euro | Yes (17%) | No (83%) | |
| CRF Bid1 | CRF Bid2 | |||
| 10 euro | No (46%) | 5 euro | Yes (100%) | No (0%) |
| Yes (54%) | 15 euro | Yes (58%) | No (42%) | |
| 20 euro | No (39%) | 15 euro | Yes (25%) | No (75%) |
| Yes (62%) | 25 euro | Yes (57%) | No (43%) | |
| 30 euro | No (42.5%) | 25 euro | Yes (11%) | No (89%) |
| Yes (57.5%) * | 35 euro | Yes (53%) | No (47%) |
The bidding acceptance frequencies for MN show an overall inverse proportionality to bid level, except for the 20€ bid, showing an acceptance rate slightly higher than the 15€ bid. Bidding acceptance frequencies for CRF show a different pattern, where acceptance frequencies are almost uniform across the three bid levels, with the 20€ bid receiving the highest score. This result is not straightforward, and the reasons could be related to the relatively higher income levels of visitors, the local residence of most visitors, and the high frequency of visits in this area. All these aspects might lead to a firm commitment to protecting the CRF through the proposed payment for forest management and fire prevention purposes.
The estimation of WTP using the double-bound approach was performed with the doubleb command for STATA. Based on maximum likelihood estimation and developed by Lopez-Feldman (2012), the command allows for the direct estimation of the WTP value for double-bound models. Table 4 shows the results of the WTP, where Beta is the estimate of WTP and Sigma is the estimate of the model’s variance. For both MN and CRF, the model coefficients are statistically significant. We also considered including explanatory control variables, such as demographic variables of visit features. Still, their contribution was not statistically significant and provided no improvement in the explanatory power of the models.
| Coef. | Std. Err | z | P> [z] | [95% Conf. Interval] | ||
|---|---|---|---|---|---|---|
| MN | ||||||
| Beta | 7.446355 | 1.408938 | 5.29 | 0.000 | 4.684887 | 10.20782 |
| Sigma | 10.74857 | 1.549162 | 6.94 | 0.000 | 7.712271 | 13.78487 |
| Nr of obs: 88 >Log-likelihood: -115.23535 |
||||||
| CRF | ||||||
| Beta | 13.69401 | 2.343849 | 5.84 | 0,000 | 9.100147 | 18.28787 |
| Sigma | 20.08853 | 2.888438 | 6.95 | 0,000 | 14.4273 | 25.74977 |
| Nr of obs: 113 >Log-likelihood: -144.56443 |
||||||
This study demonstrates that it is possible to analyze the valorization of services and environmental benefits linked to forests, considering the wide range of ecosystem services beyond the wood product supply. Today’s forests, especially in the Apennines, are no longer used solely for timber harvesting, which remains a significant opportunity for local owners if practised through adequate forest management plans. Several forests today have lost their production functions and became suitable sites for enhancing other utilities such as outdoor recreation, environmental education, etc. Therefore, public and private forest management should consider providing products and services as society requests today (Mammuccini, 2004; Suryawan and Lee, 2024).
Based on the CICES classification, this study identified various cultural ecosystem services provided by the MN and CRF areas. Through empirical assessment of user evaluations of the area, most respondents appreciate these services; many are willing to pay sums of money to maintain these services through measures oriented towards sustainable forest management.
IPA results show a generally satisfactory valuation of ES, particularly for MN. Visitors’ expectations are generally met in both areas, but the satisfaction is higher for MN. The “richness of flora and fauna” and “hiking trail variety” obtained the highest satisfaction scores in both areas. Only the “accessibility for disabled people” is critical for MN.
The WTP values, namely 7.50 euros for MN and 13.70 euros for CRF, cannot be directly matched as different payment vehicles were considered according to the different characteristics of the two areas. However, studies concerning WTP related to forest areas in Italy, though if using different estimation methods, provide quite similar results. Riccioli et al. (2020) investigated the WTP for the potential income deriving from the tourist-recreational value of the forest divided into management methods, coppice, tall trees and free evolution. They used the open method and identified an average WTP of 7.70 euros for tall trees. Sgroi et al. (2016) assessed payments for ecosystem services for Mediterranean forests in Sicily, identifying a WTP between 10 and 12 euros. Dimonopolous et al. (2022) estimated WTP based on CVM to protect a national forest area in Greece with a mean willingness to pay per household between 5.5-9.5 euros per semester. Paletto et al. (2015) estimated tourists’ WTP for visiting the Austrian Alps to be around 10.7 euros.
Except for the payment of a mushroom picking permit in CRF, there is no remuneration for Services, such as landscape and recreation analyzed in this study, as well as the slope erosion risk reduction or climate mitigation provided by the forests or are particularly relevant for society. There is an apparent contradiction between the presence of significant positive externalities produced by the forest regarding society benefits and the absence of adequate remuneration or public financial coverage capable of ‘internalizing’ at least partially the generated benefits. The lack of adequate support for ES might jeopardize the stability of ecosystem service provision through adequate forest management measures. Our study may provide a basis for the definition of supporting policies for the two forest areas, which could also consider introducing some form of payment for ecosystem services (PES). Regional forest laws and regulations should be revised and promoted, as suggested by European directives (Forest Strategy 2030) and National laws (TUFF 2018); the valorization of forest utilities such as forest and ecosystem biodiversity, both very sensitive to climate changes. PES (Wunder, 2018; Muradian et al., 2010) are financial incentives for maintaining or enhancing ecosystem services. Payments are based on private agreements or may consider the participation of public local authorities. The general aim would be to align economic benefits to environmental conservation for forest areas, encouraging sustainable practices by compensating landowners or resource managers for their activities’ positive impacts on ecosystem functions and services.
This study assessed only a specific type of ES offered by CRF and MN forests. It would be interesting to reiterate the analysis in different seasons to check for possible differences in the evaluation of ES due to different seasonal contexts of the forest areas. Also, extending the analysis to the other ES categories, namely provisioning and regulating, would provide a more comprehensive framework of the overall benefits in the two areas. Finally, surveys for collecting data concerning the number of visitors per year in the two areas would allow a comprehensive estimation of the economic value of MN and CRF.
Alberini, A., & Kahn, J. R. (2006). Handbook on Contingent Valuation. Cheltenham, Edward Elgar Publishing.
Arrow, K., Solow, R., Portney, P. R., Leamer, E. E., Radner, R., & Schuman, H. (1993). Report of The NOAA Panel on Contingent Valuation. Federal Register, 58(10), 4601–4614.
Barbier, E. B., Hacker, S. D., Kennedy, C., Koch, E. W., Stier, A. C., & Silliman, B. R. (2011). The value of estuarine and coastal ecosystem services. Ecological Monographs, 81, 169–193. https://doi.org/10.1890/10-1510.1
Bateman, I. J., & Turner, R. K. (1992). Evaluation of the environment: the contingent valuation method (working paper GEC 92-18). Norwich, UK, Centre for Social and Economic Research on the Global Environment.
Bateman, I., Willis, K., & Garrod, G. (1994). Consistency between contingent valuation estimates: a comparison of two studies of UK National Parks. Regional Studies, 28, 457–474. https://doi.org/10.1080/00343409412331348396
Bateman, I., & Willis, K. G. (2001). Valuing environmental preferences: theory and practice of the contingent valuation method in the US, EU, and developing countries. New York, Oxford University Press.
Boyd, J., & Banzhaf, S. (2007). What are ecosystem services? The need for standardized Environmental accounting units. Ecological Economics, 63(2–3), 616–626. https://doi.org/10.1016/j.ecolecon.2007.01.002
Boley, B. B., McGehee, N. G., & Tom Hammett, A. L. (2017). Importance-performance analysis (IPA) of sustainable tourism initiatives: the resident perspective. Tourism Management, 58, 66–77. https://doi.org/10.1016/J.TOURMAN.2016.10.002.
Carson, R. T., Flores, N. E., & Meade, N. F. (2001). Contingent Valuation: controversies and evidence. Environmental and Resource Economics, 19, 173–210. https://doi.org/10.1023/A:1011128332243
Carson, R. T., Mitchell, R. C., Hanemann, M., Kopp, R. J., Presser, S., & Ruud, P. A. (2003). Contingent valuation and lost passive use: damages from the Exxon Valdez oil spill. Environmental and Resource Economics, 25, 257–286. https://doi.org/10.1023/A:1024486702104
Carson, R. T., & Hanemann, W. M. (2005). Contingent Valuation. In Mler, K.G., & Vincent, J. R. (Eds). Handbook of Environmental Economics. Vol. 2, pp. 821–936. Amsterdam, Elsevier.
Carson, R. T. (2012). Contingent Valuation: a practical alternative when prices aren’t available. Journal of Economic Perspectives, 26(4), 27–42. doi: 10.1257/jep.26.4.27
Chatterjee, N. (2019). Valuation of forestry in selected dryland areas of West Bengal: a contingent valuation approach. Economic Affairs (New Delhi), 64(1), 173–183. https://doi.org/10.30954/0424-2513.1.2019.21
Chen, H. C., Tseng, T. P., Cheng, K., Sriarkarin, S., Xu, W., Ferdin, A. E., Nguyen, V. V., Zong, C., & Lee, C. H. (2021). Conducting an evaluation framework of importance-performance analysis for sustainable forest management in a rural area. Forests, 12(10), 1357. https://doi.org/10.3390/f12101357
Deng, W. (2007). Using a revised importance-performance analysis approach: the case of Taiwanese hot springs tourism. Tourism Management, 28(5), 1274–1284. https://doi.org/10.1016/j.tourman.2006.07.010.
Di Franco, C. P., Lima, G., Schimmenti, E., & Asciuto, A. (2021). Methodological approaches to the valuation of forest ecosystem services: an overview of recent international research trends. Journal of Forest Science, 67(7), 307–317. https://doi.org/10.17221/13/2021-JFS
Dimopoulos, V., Tourkolias, C., & Mirasgedis, S. (2022). Valuing natural ecosystems: the case of National Park Kotychi-Strofilia in Peloponnese, Greece. IOP Conference Series: Earth and Environmental Science, 1123, 012090. https://doi.org/10.1088/1755-1315/1123/1/012090
Fan, Y., Wu, H., Jin, H., Lu, L., Zhao, Y., & Wang, Y. (2023). Evaluation of cultural ecosystem services in mountain-type scenic areas: an importance-performance analysis of the Road of Tang Poetry in Eastern Zhejiang, China. Journal of Asian Architecture and Building Engineering, 23(5), 1735–1755. https://doi.org/10.1080/13467581.2023.2270031
Gambelli, D., Solfanelli, F., Orsini, S., & Zanoli, R. (2021). Measuring the economic performance of small ruminant farms using balanced scorecard and importance-performance analysis: a European case study. Sustainability, 13(6) 3321, https://doi.org/10.3390/su13063321
Haines-Young, R., & Potschin, M. (2010). The links between biodiversity, ecosystem services and human well-being. Ecosystem Ecology: a new synthesis, 1, 110–139. https://doi.org/10.1017/CBO9780511750458.007
Haines-Young, R., & Potschin, M. (2018). Common international classification of ecosystem services (CICES) V5.1 and Guidance on the application of the revised structure. Available at: www.cices.eu (accessed 19 November 2024).
Hanemann, M., Loomis, J., & Kanninen, B. (1991). Statistical efficiency of double‐bounded dichotomous choice contingent valuation. American Journal of Agricultural Economics, 73(4), 1255–1263. https://doi.org/10.2307/1242453
Hanemann, W. M. (1991). Willingness to pay and willingness to accept: how much can they differ?. The American Economic Review, 81(3), 635–647. https://www.jstor.org/stable/2006525
Hanemann, W. M. (1994). Valuing the environment through contingent valuation. Journal of Economic Perspectives, 8(4), 19–43. doi: 10.1257/jep.8.4.19
Lopez-Feldman, A. (2012). Introduction to contingent valuation using Stata. MRPA. Paper No. 41018. Available at: https://mpra.ub.uni-muenchen.de/id/eprint/41018 (accessed 19 November 2024).
Mammuccini, M. G. (2004). Multifunzionalità del bosco: nuovi scenari per la ricerca e l’innovazione. L’Italia Forestale e Montana, 59(3), 189–212.
Martilla, J. A., & James, J. C. (1977). Importance-performance analysis. Journal of Marketing, 41(1), 77–79. https://doi.org/10.1177/002224297704100112
Millenium Ecosystem Assessment (2005). Ecosystems and human well-being: wetlands and water. World Resources Institute, Washington, DC.
Mitchell, R. C., & Carson, R. T. (1989). Using surveys to value public goods: the Contingent Valuation Method. Resources for the Future. New York, RFF press. https://doi.org/10.4324/9781315060569
Muradian, R., Corbera, E., Pascual, U., Kosoy, N., & May, P. H. (2010). Reconciling theory and practice: an alternative conceptual framework for understanding payments for environmental services. Ecological Economics, 69(6), 1202–1208. https://doi.org/10.1016/J.ECOLECON.2009.11.006
Oh, H. (2001). Revisiting importance-performance analysis. Tourism Management, 22(6), 617–627. https://doi.org/10.1016/S0261-5177(01)00036-X
Paletto, A., Geitner, C., Grilli, G., Hastik, R., Pastorella, F., & Garcìa, L. R. (2015). Mapping the value of ecosystem services: a case study from the Austrian Alps. Annals of Forest Research, 58(1), 157–175. https://doi.org/10.15287/afr.2015.335
Portney, P. R. (1994). The contingent valuation debate: why economists should care. Journal of Economic Perspectives, 8(4), 3–17. https://doi.org/10.1257/jep.8.4.3
Riccioli, F., Fratini, R., Fagarazzi, C., Cozzi, M., Viccaro, M., Romano, S., Rocchini, D., Espinosa Diaz, S., & Tattoni, C. (2020). Mapping the recreational value of coppices’ management systems in Tuscany. Sustainability, 12(19), 8039. https://doi.org/10.3390/su12198039
Sajise, A. J., Samson, J. N., Quiao, L., Sibal, J., Raitzer, D. A., & Harder, D. (2021). Contingent valuation of nonmarket benefits in project economic analysis: a guide to good practice. Asian Development Bank. https://doi.org/10.22617/TCS210514-2
Sever, I. (2015). Importance-performance analysis: a valid management tool? Tourism Management, 48, 43–53. https://doi.org/10.1016/j.tourman.2014.10.022
Silva, F. H., & Fernandes, P. O. (2011). Importance-performance analysis as a tool in evaluating higher education service quality: the empirical results of ESTiG (IPB). In The 17th International Business Information Management Association Conference, University of Pavia. Milan, Italy, 306–315. http://hdl.handle.net/10198/7120
Sgroi, F., Foderà, M., Dana, L. P., Mangiapane, G., Tudisca, S., Di Trapani, A. M., & Testa, R. (2016). Evaluation of payment for ecosystem services in Mediterranean forest: an empirical survey. Ecological Engineering, 90, 399–404. https://doi.org/10.1016/j.ecoleng.2016.02.004
Suryawan, I. W. K., & Lee, C. H. (2024). Importance-performance dynamics and willingness to pay in coastal areas for climate-adaptive Marine Debris Management. Regional Studies in Marine Science, 77, 103596. https://doi.org/10.1016/j.rsma.2024.103596
TEEB (2010). The Economics of Ecosystems and Biodiversity Ecological and Economic Foundations. Edited by Pushpam Kumar. New York, Routledge.
Tuati, H., Farida, N., & Manuain, D. W. (2022). Analysis of the Economic Value of Tourism Tablolong Contingent Valuation Method Approach in West Kupang. In Proceedings of the International Conference on Applied Science and Technology on Social Science 2021 (ICAST-SS 2021), 647, 833–839. https://doi.org/10.2991/assehr.k.220301.137
Turner, R. K., Pearce, D. W., & Bateman, I. (1993). Environmental economics: an elementary introduction. Baltimore, Johns Hopkins University Press.
Vallecillo, S., La Notte, A., Ferrini, S., & Maes, J. (2019). How ecosystem services are changing: an accounting application at the EU level. Ecosystem Services, 40, 101044. https://doi.org/10.1016/j.ecoser.2019.101044
Wu, S. T., Hsieh, Y. T., Huang, S. C., Wei, C. H., Chen, C. T., & Chen, J. C. (2021). Perceptions of tourists of the resources, ecological service functions and recreation value of the Guanwu National Forest Recreation Area. Plos one, 16(9), e0257835. https://doi.org/10.1371/journal.pone.0257835
Whittington, D. (2002). Improving the performance of contingent valuation studies in developing countries. Environmental and Resource Economics, 22, 323–367. https://doi.org/10.1023/A:1015575517927
Wunder, S., Brouwer, R., Engel, S., Ezzine-De-Blas, D., Muradian, R., Pascual, U., & Pinto, R. (2018). From principles to practice in paying for nature’s services. Nature Sustainability, 1(3), 145–150. https://doi.org/10.1038/s41893-018-0036-x
1 https://www.regione.marche.it/natura2000/index-home.html (accessed 18 November 2024); https://www.unionemontana.altavalledelmetauro.pu.it/uffici/area-agricola-forestale-ambientale/rete-natura-valutazione-di-incidenza/piani-di-gestione-dei-siti-natura-2000 (accessed 18 November 2024).
2 https://www.fao.org/fao-italy/it (accessed 18 November 2024); https://teebweb.org (accessed 18 November 2024); https://www.ipbes.net/global-assessment (accessed 18 November 2024).