Evaluating progress in achieving the SDGs at sub-national level in Spain: a multicriteria analysis
1 Department of Agricultural, Food and Environmental Sciences, University of Perugia, Italy
2 Department of Agrochemistry and Environment, Miguel Hernández University of Elche, Spain
3 Department of Agri-environmental Economics, Miguel Hernández University of Elche, Spain
*Corresponding author
E-mail: luisa.paolotti@unipg.it; imelendez@umh.es; elena.ricciolini@studenti.unipg.it; lucia.rocchi@unipg.it; asuncion.agullo@umh.es; antonio.boggia@unipg.it
Abstract. The UN 2030 Agenda is the current reference point for achieving sustainable development at the international level. Focusing on the implementation effort and monitoring the progress of SDGs are crucial aspects for achieving the Goals by 2030. The evaluation and achievement of sustainability at the sub-national level is fundamental, as sustainable development is considered achievable if it originates on the local level. Given that, the objective of this research was to assess sustainable development related to the 2030 Agenda considering the 17 regions (autonomous communities) of Spain. The analysis was carried out through the Spatial Sustainability Assessment Model (SSAM), set up as a plug-in of QGIS, which integrates multi-criteria analysis with the geographical tool. The region datasets referred to years 2019 and 2020 to observe a comparison of pre and post-COVID framework and to assess possible changes due to pandemic impacts. Results showed that, both in 2019 and 2020, for the environmental dimension the majority of the regions obtained very low or low results, showing a generally scarce environmental situation. A general decline for the majority of the indices was observed and a decrease in sustainability from north to south was detected, both for the social and the global sustainability dimensions. The social dimension in most cases was the one marking the global ordination of the communities.
Keywords: Sustainable Development Goals, sustainability assessment, multicriteria analysis, MCDA-GIS integration, COVID pandemic, 2030 Agenda.
JEL code: Q01.
1. Introduction
Since the 1990s, the international community has been committing to several principles and declarations for implementing sustainable development (Carrillo, 2022). The most recent took effect in September 2015 when the 193 United Nations (UN) Member States adopted the 2030 Agenda for Sustainable Development, an ambitious, transformative action plan aimed at “achieving sustainable development in its three dimensions – economic, social and environmental – in a balanced and integrated manner” (UN General Assembly, 2015).
The UN Agenda 2030 is the current reference point for achieving sustainability in policies and territorial planning at the international level. The Agenda is based on 17 Sustainable Development Goals (SDGs), which follow and expand the prior United Nations Millennium Development Goals (MDGs), including the results of Rio+20 (Ricciolini et al., 2022). The 17 goals, organized into 169 targets, identify global development priorities, effectively defining sustainable development through the three pillars: economic, environmental, and social (Stevens et al., 2016). In particular, they address unfulfilled issues related to extreme poverty, inequality, social injustice, and the protection of the environment by 2030.
Consequently, the Agenda and its goals have given a new impetus to global efforts for achieving sustainable development (Rocchi et al., 2022). Governments and researchers are currently facing the challenge of measuring and monitoring progress towards the SDGs. This crucial task must be rigorously undertaken to evaluate the outcomes of the actions already implemented and address the next decade’s unfulfilled goals (Carrillo, 2022). Moreover, in the unprecedented global context caused by the pandemic, an assessment of progress towards the SDGs agenda is even more important, as for many countries the achievement of targets by 2030 has become out of reach (Benedek et al., 2021).
Since 2018, the UN Sustainable Development Solutions Network (SDSN) has produced the Sustainable Development Report (SDR), which includes the SDG Index and Dashboards that ranks countries on goal attainment. This annual report, and regional editions, have become world-leading references for monitoring progress on the SDGs. Every year, the report provides the most comprehensive assessment of the performance of all 193 UN Member States on the 17 SDGs. Governments and civil society alike use the SDR to identify priorities for action, understand key implementation challenges, track progress, ensure accountability, and identify gaps that must be closed to achieve the SDGs by 2030 and beyond (Sachs et al., 2023).
The Europe Sustainable Development Report provides an annual independent quantitative assessment of the progress by the European Union, its member states, and partner countries towards the Sustainable Development Goals (Lafortune et al., 2024). In particular, the report highlights areas of success as well as opportunities for further improvement and uses the data to compare the progress of European sub-regions. The data and findings build on several rounds of consultations with scientists, experts, and practitioners from across Europe, made possible largely through the strong cooperation between the UN Sustainable Development Solutions Network and the European Economic and Social Committee (EESC).
Several studies have been performed at the national level, performing analysis within a specific country, or making comparisons in terms of SDGs among different countries. Great attention in the literature has been given to the European context in particular, thanks to its leading role in the application of the Agenda (D’Adamo et al., 2022). For instance, Ricciolini et al. (2022) used two multicriteria composite indicators to evaluate the sustainability, in terms of SDGs achievement, of the 28 Members of the European Union (pre-Brexit), considering three reference years: 2007, 2012, and 2017. Also Carrillo (2022) developed a composite indicator to evaluate the SDGs’ progress using the Eurostat SDG dataset, but considering the 2010–2020 period. Rocchi et al. (2022) measured the Progress of the European Union Countries through the so-called SDGs Achievement Index, a multicriteria-based index, including six different dimensions. Miola and Schiltz (2019) reviewed three common methods to measure the SDGs performance of EU28 countries, illustrating the sensitivity of rankings to the choice of indicators and methodological assumptions. D’Adamo et al. (2022) monitored the progress of Member States (MSs) towards achieving the SDGs, using MCDA but focusing on five economic SDGs only, while Tóthová and Heglasová (2022) concentrated the attention on environmental achievement. In such studies, it is possible to identify some common trends. There are several discrepancies in sustainability level across the member states, with the middle-east and Mediterranean nations usually showing a gap in comparison to Northern Europe (D’Adamo et al., 2022; Kiselakova et al., 2020; Ricciolini et al., 2022; Rocchi et al., 2022). Moreover, for the member states with the highest level of sustainable development is more difficult to improve their performance, while the more backward nations have made considerable progress that, however, has not yet allowed them to close the gaps present (D’Adamo et al., 2022; Rocchi et al., 2022). Finally, studies show that a good level of economic and social development is often associated with a lower level of environmental sustainability, and vice versa (Kiselakova et al., 2020; Ricciolini et al., 2022; Rocchi et al., 2022; Tóthová and Heglasová, 2022).
The practice of ranking countries can be a way to stimulate decision-makers to improve their position (Dahl, 2012) and therefore their national levels of sustainability. However, the evaluation cannot be solely at a national level, although it is perhaps the most significant one (Dahl, 2012) and the most applied in international fora (Canavese et al., 2014). The main aim of the European Union is to set common objectives of sustainable development at the Union level, to be calibrated and adjusted based on the different countries’ situation and, within each country, on the basis of the composite territorial areas and local characteristics. It is clear, therefore, that there could exist common measures for the totality of Member Countries, as well as specific territorial measures, tailored based on sustainable development needs, strengths and weaknesses of the different subareas within a country (Paolotti et al., 2019).
Therefore, systems at a local level must be investigated in order to have effective and realistic evaluations of specific territorial contexts, and to determine sound planning actions (Boggia et al., 2018). Sustainable development is considered achievable if it originates on the local level; a bottom-up approach from local to supra-national (Ravetz, 2000), complying with the EU subsidiarity principle.
In particular, in the distribution of funds for the growth of territories decision-makers should sustain those areas having difficulties in reaching an equilibrium between economic wealth, social equality, and environmental preservation, and therefore need more immediate incentives towards sustainability (UNCTAD, 2015). To do this, local systems must be analyzed to have actual and accurate evaluations of specific territorial situations and to determine thorough planning strategies to adopt (Ravetz, 2000).
Recently, several studies have been conducted to analyse the achievement of SDGs at the local level. Diaz-Sarachaga et al., 2018 examined the SDG index (Schmidt-Traub et al., 2017), highlighting the need for developing regional SDG Indices to enhance the appraisal of specific regions, and to emphasize the achievement of lower performing goals. Rocchi et al. (2023) proposed an evaluation framework for assessing the progress of the Italian regions in terms of SDGs, within the strategic borders provided by the Italian National Sustainable Development Strategy. The different regions were evaluated concerning a set of indicators associated with SDGs and complying with the strategic objectives of the national strategy, for assessing the relative level of sustainable development reached by each region.
The importance of the diffusion of sustainable development at the local level was recognised by Farnia et al. (2019), who addressed the issue of measuring the Agenda 2030 goals at the urban level in Italy. They used 53 economic, social, and environmental indicators to analyse 98 Italian municipalities and built a composite index by combining the data into two levels. The results showed geographical and demographic heterogeneity within the country when considering each of the Goals, but also underlined how complex phenomena are due to the multidimensional aspects of Agenda 2030.
Xu et al. (2020) conducted a spatio-temporal analysis of progress towards the 17 SDGs in China, at national and sub-national levels (Chinese provinces) using a systematic method. They referred to a series of data from 2000 to 2015, using 119 indicators to calculate the “SDG Index score” (0-100), which represented China’s overall performance in achieving all 17 SDGs. This index increased at the national level over the 15 years examined, and each province also increased its SDG Index score over this period; more specifically, scores for 13 of the 17 SDGs improved over time.
The importance of measuring progress at the local level in the context of the SDGs was also investigated by Nagy et al. (2018), who measured the sustainability of the Cluj Metropolitan Area (CMA) located in the northwest region of Romania. Using the simple arithmetic mean of the normalized values, they calculated a score for each of the Sustainable Development Goals (except the 14th goal “life below water”). They then aggregated the results and determined the overall SDG index for each district of the CMA and, finally, for the entire metropolitan area. Finally, they generated a single map representing the entire metropolitan area of Cluj for a visualization of the SDG index for each individual district. Also, Saiu et al., 2022 analyzed the potentials and limitations of three different “neighborhood sustainability assessment tools” for contributing useful guidelines toward urban sustainability assessment.
In order to assess the performance of the cities in Brazil towards the SDGs, the Sustainable Cities Development Index of Brazil (IDSC-BR) was developed as part of the Sustainable Cities Programme (PCS), promoted by the Sustainable Cities Institute (ICS) (ICS and SDSN, 2021). The IDSC-BR provides a comprehensive assessment of the distance between each of the 5,570 Brazilian municipalities and the achievement of SDGs. Using updated data from public and official sources in Brazil, the index is composed of a total of 100 indicators, covering various areas of public administration activities. The methodology for constructing this index was developed by the SDSN. The IDSC score, varying between 0 and 100, represents the percentage of optimal performance; in particular, the difference between the score obtained and 100 indicates the distance in percentage points a city must overcome to achieve optimal performance. In addition to the score and ranking of each city, the index presents SDG Panels, offering a visual representation of the performance of municipalities in the 17 SDGs; these panels use a colour classification system (green, yellow, orange, and red) to indicate how far a municipality is from achieving each target.
To contribute to the sustainable development of Spanish cities, the report ‘Sustainable Development Objectives in 100 Spanish Cities’ was presented in 2018 by the Spanish Network for Sustainable Development (REDS) (Sánchez de Madariaga et al., 2018). The municipalities analyzed in the report include 21.5 million inhabitants, constituting almost 50 per cent of the Spanish population. The objective was to help local governments to keep a picture of the achievement of the SDGs, but also to facilitate the exchange of good practices between different Spanish cities. The report measured the level of the 17 SDGs (considering 85 indicators) to highlight the challenges that cities have to face in relation to transport, health, inequality or climate change. Unlike other reports, this one did not rank or compare results, but rather offered a general overview of the state of the goals at the local level in Spain and provided a scorecard for each city. It was not intended to report better or worse performance with the targets, but to offer instruments for local policymakers to define actions to be taken.
Finally, Mascarenhas et al. (2010) emphasized how it is widely recognized that action towards sustainable development is most effective at the local scale, but that there are common resources for which efficient management occurs at a supra-municipal scale, i.e. at the regional level. Indeed, they argued that the regional scale is a good level of governance for planning, coordination, and evaluation of action towards sustainable development.
Following these principles, the objective of this work is to carry out a sub-national assessment of the Agenda 2030, by means of an already tested model, found very suitable for territorial sustainability assessment, i.e. the model SSAM (Spatial Sustainability Assessment Model – Rocchi et al., 2022), for evaluating the progress in terms of SDGs achievement of the 17 autonomous communities belonging to Spain. According to previous studies (Ricciolini et al., 2022; Rocchi et al., 2022), at the national level, Spain has a sufficient level of sustainability with specific shortcomings in some areas. Therefore, it is needed to better understand the situation at the regional level. It was the first evaluation in terms of SDGs, at this territorial level.
The model SSAM is based on spatial MCDA, i.e. Multi-Criteria Spatial Decision Support Systems (for general information about spatial MCDA see Malczewski, 2010). It can be used at local, regional, and national levels, for comparing the sustainability of different territorial areas considering multiple dimensions/criteria. Some applications of SSAM (and of its previous version) at the territorial level can be found in Ottomano Palmisano (2016), Boggia et al. (2018), Paolotti et al. (2019), Rocchi et al. (2022), De Toro et al. (2023), where it proved to be a useful tool integrating Multi-Criteria analysis with Geographic Information Systems for sustainability evaluations. In particular, these last two works analysed SDGs in relation to EU countries in one case, and peri-urban areas in the other.
Therefore, this multi-criteria model seems to be a suitable tool for this type of territorial analysis – i.e. a multidimensional study, since it deals with the Sustainable Development Goals (SDGs) – analysing in this case the supra-communal level. Furthermore, the model allows for a simple and intuitive visualisation of the results, and this can certainly help decision-makers in the definition of policies.
As the main objective of the work was to perform an assessment of Agenda 2030 at the sub-national level, the research steps that were implemented can be synthetized as follows:
–Criteria selection through the choice of a specific set of indicators for the case study analysed (i.e. 17 autonomous communities belonging to Spain) and building of a specific framework for sub-national level assessment of SDGs.
–Application of SSAM – Spatial Sustainability Assessment Model, using the set of indicators previously identified, and of Multi Criteria Decision Analysis, to the 17 autonomous communities.
–Computation of the three basic Sustainability Indices – EnvIdeal, EcoIdeal, SocIdeal – plus the aggregated SustIdeal index.
–Ranking of 17 Spanish autonomous communities before the irruption of the global COVID pandemic (2019 – Pre-COVID) and just after that (2020 – COVID Pandemic).
This study, through its results, could act as an impulse for local sustainability initiatives and, above all, could outline guidelines to be followed at the institutional level; there is also a need for better coordination between authorities to pursue the targets to be achieved, and this is possible with a vision of the situation as clear as possible.
Even if the assessment was applied as a case study to the autonomous communities of Spain, it is designed to be applied in any other territorial context (sub-national or national), as the reference units object of the analysis (through GIS) are homogeneous territorial areas, that can be for example countries, regions, or sub-regions.
2. Materials and methods
This section provides details about the case study selection and the framework construction, including both the indicators selection and the description of the method applied within SSAM plugin. In particular, the framework construction is a key step to understand the results and their possible shortcomings.
2.1 Case study
The sub-national SDGs assessment was applied to the 17 autonomous communities belonging to Spain (Figure 1). These regions have notable differences in extension and number of inhabitants (Table 1). The largest region is Castilla y León, the most populated is Andalucía, and the most densely populated is Comunidad de Madrid (INE, 2023). A general pattern of low population density in inland regions is observed, except for Comunidad de Madrid, where the capital Madrid is located.
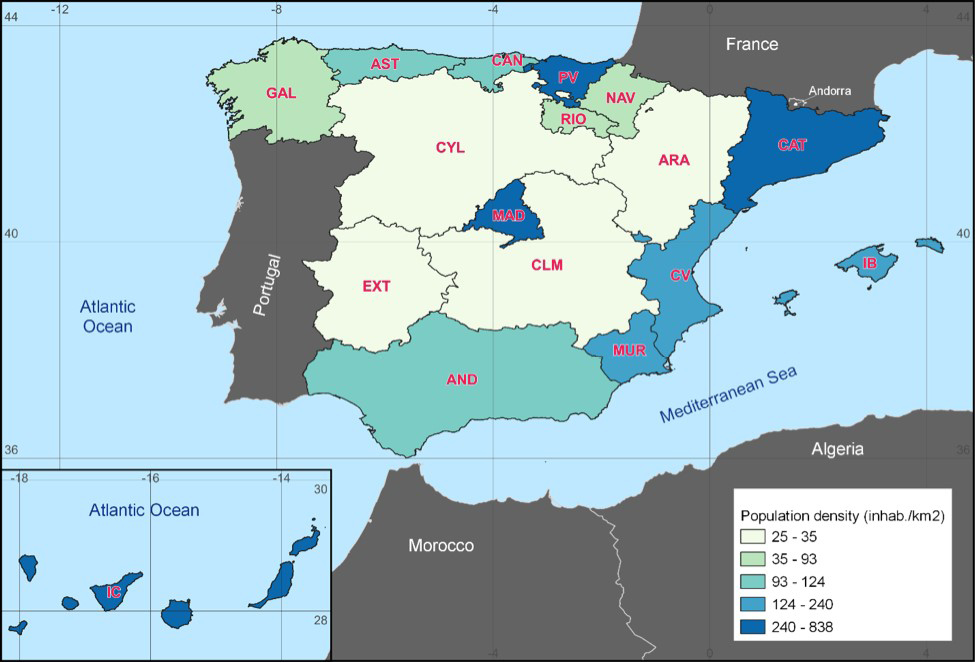
| Region | Abbreviation | Area (km2) | Population (inhab.) | Density (inhab/km2) |
|---|---|---|---|---|
| Andalucía | AND | 87,599 | 8,484,804 | 96.9 |
| Aragón | ARA | 47,720 | 1,331,938 | 27.9 |
| Asturias | AST | 10,604 | 1,012,117 | 95.4 |
| Islas Baleares | IB | 4,992 | 1,183,415 | 237.1 |
| Islas Canarias | IC | 7,447 | 2,178,924 | 292.6 |
| Cantabria | CAN | 5,321 | 584,708 | 109.9 |
| Castilla y León | CYL | 94,224 | 2,385,223 | 25.3 |
| Castilla – La Mancha | CLM | 79,461 | 2,052,505 | 25.8 |
| Cataluña | CAT | 32,113 | 7,749,896 | 241.3 |
| Comunidad Valenciana | CV | 23,255 | 5,067,911 | 217.9 |
| Extremadura | EXT | 41,634 | 1,061,636 | 25.5 |
| Galicia | GAL | 29,575 | 2,698,177 | 91.2 |
| Comunidad de Madrid | MAD | 8,028 | 6,726,640 | 837.9 |
| Región de Murcia | MUR | 11,314 | 1,518,279 | 134.2 |
| Comunidad Foral de Navarra | NAV | 10,391 | 662,032 | 63.7 |
| País Vasco | PV | 7,234 | 2,212,628 | 305.9 |
| La Rioja | RIO | 5,045 | 319,444 | 63.3 |
2.2 Criteria selection and reference framework
The selection of indicators for performing the analysis is a crucial step in the study as they are a key tool for monitoring and evaluating different sectors and levels of governance. In particular, the indicators of the Sustainable Development Goals can be seen as a potential beacon to guide humanity on the right path towards sustainability (Lyytimäki et al., 2020).
It is also important to understand the context in which the study is being carried out, to be able to find the indicators that best fit the object of the research, which is in this case the sustainability of Spanish regions concerning the Agenda 2030 Sustainable Development Goals. The choice of indicators should therefore be based on their reliability, relevance and ability to fit the concept being studied, but of course data availability should always be checked. The aim was to outline a possible pathway to support the processes of evaluating the performance of Spanish regions in achieving the Sustainable Development Goals, through the creation of a proper assessment framework.
At the methodological level, assessing Spain’s confluence with Europe seems a good quantitative technique to investigate the achievement of the SDGs at the national level (Boto-Álvarez and García-Fernández, 2020). Following this idea, we applied the same methodology for investigating the SDGs achievement at the local level. In particular, we started from the structure of Agenda 2030 in a more comprehensive form, analyzing the policies at the European Union level and the indicators provided by Eurostat and then examining the specific Spanish indicators, with a focus on the various regions, finding a correspondence with the Eurostat data. Therefore, a basic principle for choosing the indicators has been to define a set of specific indicators for Spanish regions in line with those proposed by Eurostat, the Statistical Office of the European Union, in its specific section on Agenda 2030 and the SDGs.
Through these selection parameters, it was therefore possible to study the progress of Spain at a supra-communal level but at the same time to be completely in line with the European Union indicators. This correspondence with the EU is very important because it makes the work comparable with possible other studies carried out on a different local scale or for a different territorial area. Indeed, having a common and reusable set of indicators is crucial for the reliability of the work.
For the search of the indicators, initially, the Spanish National Institute of Statistics (INE) was analyzed; in 2018 INE launched the statistical operation “Agenda 2030 for Sustainable Development Indicators”, constituting a framework of statistical indicators that would serve for the monitoring of the Goals and Objectives of the 2030 Agenda in Spain. The indicators for monitoring the SDGs are very complex as they cover the economic, social, environmental, and institutional dimensions; for this reason, in addition to the INE, 16 ministerial departments and the Bank of Spain participated in their preparation. The indicators included in the set of SDGs proposed by INE were selected directly from this source (19 out of a total of 25). Given the difficulties in collecting data for the autonomous cities of Melilla and Ceuta, it was decided to exclude them from the research. Then, other indicators were selected from the databases provided by the official Spanish statistical offices, again following Eurostat’s 2030 Agenda indicators guidelines.
Based on these guidelines and analyzing the different databases available, which contain statistical measures useful for monitoring the SDGs of the 2030 Agenda, a careful selection was made to identify the indicators that best represented the 17 Spanish autonomous communities.
The criteria that were considered in the selection process are:
–representativeness of the theme, in relation also to the coverage of the majority of SDGs;
–avoidance of redundant or overlapping indicators.
–availability of data at the regional territorial level; data for monitoring the 2030 Agenda are not always easily accessible, especially when individual regional units are to be evaluated, although within the EU they are more available than in other geographical contexts;
–availability of data for the years under analysis and the possibility of updating the data over the years;
The years covered in the study were 2019 and 2020, to include a comparison of the pre-COVID situation and how it changed in the first year of the pandemic.
For some indicators data were not available for the years under analysis, so the nearest available years were selected. In particular, the indicator “Research and development expenditure as a share of GDP” was not available for 2019 and 2020, so the analysis took into consideration 2018 data; for “Per capita growth rates of household expenditure and income of total population households”, “Healthy life years at birth”, “Share of forest area”, “Recycling rate of municipal waste”, “Urban waste generated per capita”, “Soil erosion by water” indicators, the analysis took into account 2019 data, because 2020 data were not available.
In order to make a more intuitive assessment of the SDGs, it was decided to divide the total number of selected indicators (25) into the 3 spheres of sustainability, environmental, social, and economic, to obtain a more easily comprehensible set for decision-makers.
These three dimensions were carefully examined while in this case the institutional dimension was not included. Within the 2030 Agenda, the institutional dimension is primarily conceived as a partnership for the goals of various states and actors. Therefore, this aspect was not included in this study, which deals with a more local territorial level.
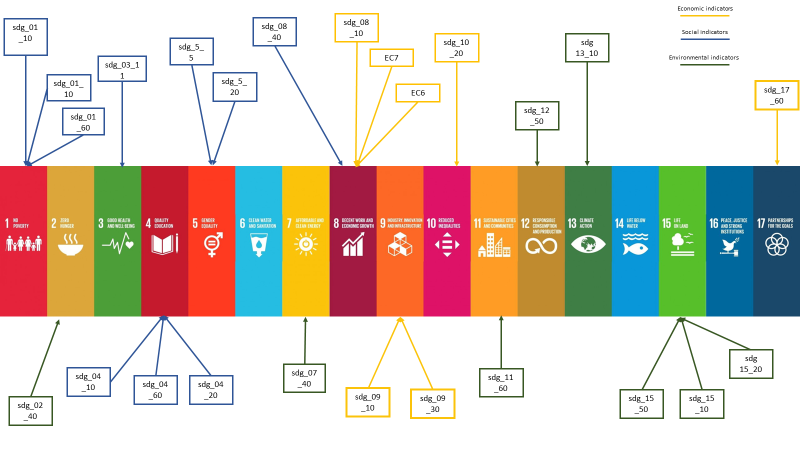
In the social sphere there were 10 indicators, in the economic one 7 and in the environmental one 8. Table Table 2, Table 3, and Table 4 show the list of all the indicators divided by dimension, together with the description of the indicators, the unit of measurement in which they are expressed, and the statistical source; moreover, the eventual absence of the data in the INE’s 2030 Agenda for Sustainable Development database is indicated with an asterisk. If available, the homologous indicator among the European Statistical Office SDGs Indicators was also specified. This could also be useful for future studies, for comparison with other research pertaining to equivalent geographical areas in other European countries or different geographical levels. Figure 2 identifies the contribution of each indicator to the various SDGs. Environmental indicators cover the largest number of objectives (SDG2, SDG7, SDG6, SDG11, SDG12, SDG13, SDG15), followed by Social (SDG 1, SDG3, SDG4, SDG5, SDG8) and Economic (SDG8, SDG9, SDG10, SDG17). Globally, 14 out of 17 SDGs are measured at least by one indicator.
| Social indicators | |||||||||||||||||||
|---|---|---|---|---|---|---|---|---|---|---|---|---|---|---|---|---|---|---|---|
| Indicators | Description | Source | Eurostat Indicator | ||||||||||||||||
| Population aged 25 to 34 years old with a Higher Education level * | Population aged 25-34 with tertiary education is the percentage of the population aged 25-34 who have completed the tertiary and doctoral level of education Unit of measure: % |
Explotación de las variables educativas de la Encuesta de Población Activa (INE). Ministerio de Educación y Formación Profesional | Tertiary educational attainment by sex (sdg_04_20) | ||||||||||||||||
| Early leavers from education and training * | Percentage of the population aged 18-24 who do not complete upper secondary education and do not attend any type of education-training Unit of measure: % |
Explotación de las variables educativas de la Encuesta de Población Activa (INE). Ministerio de Educación y Formación Profesional | Early leavers from education and training by sex (sdg_04_10) | ||||||||||||||||
| Percentage of the adult population (15-64 years) studying education or training in the last four weeks | Proportion of 15-64 years old in education or training (formal or non-formal) in the last four weeks as a percentage of all 15-64 years old Unit of measure: % |
INE | Adult participation in learning by sex (sdg_04_60) | ||||||||||||||||
| People at risk of poverty or social exclusion | The population at risk of poverty or social exclusion is defined as those who are in one of the following situations: – At risk of poverty (60% median income per consumption unit); – In severe material deprivation (with deprivation on at least 4 concepts from a list of 9); – In jobless households or households with low employment intensity (households in which their members in working age worked less than 20% of the total of their working potential during the reference year) Unit of measure: % |
INE. Encuesta condiciones de vida | People at risk of poverty or social exclusion (sdg_01_10) | ||||||||||||||||
| Severely materially deprived people | People in severe material deprivation (with deprivation in at least 4 items out of a list of 9) Unit of measure: % |
INE. Encuesta condiciones de vida | Severely materially deprived people (sdg_01_30) | ||||||||||||||||
| Population living in households with certain housing deficiencies | Proportion of people living in dwellings with problems of leaks, dampness in walls, floors, roofs or foundations, or rotting of floors, window frames or doors Unit of measure: % |
INE. Encuesta condiciones de vida | Population living in a dwelling with a leaking roof, damp walls, floors or foundation or rot in window frames of floor by poverty status (sdg_01_60) | ||||||||||||||||
| Healthy life years at birth | Healthy life years is defined as the average number of years expected to live without activity limitation at current observed mortality and activity limitation rates Unit of measure: Years |
INE Encuestas de salud por entrevista | Healthy life years at birth by sex (sdg_03_11) | ||||||||||||||||
| Unemployment rate | Proporción de personas paradas respecto a las personas económicamente activas (Total) Unit of measure: Rate |
INE. Encuesta de población activa | Long-term unemployment rate by sex (sdg_08_40) | ||||||||||||||||
| Participation of women in regional parliaments * | The indicator measures the proportion of women in each of the regional parliaments Unit of measure: % of women |
Elaboración del Instituto de la Mujer y para la Igualdad de Oportunidades a partir de las páginas web de los Parlamentos Autonómicos | Seats held by women in national parliaments (and governments) (sdg_5_5) | ||||||||||||||||
| Women’s normal hourly wage earnings compared to men’s earnings * | The indicator measures the percentage of women’s wages compared to men’s wages Unit of measure: % of women’s wages compared to men’s wages |
INE. Encuestas de Estructura Salarial | Gender pay gap in unadjusted form (sdg_5_20) | ||||||||||||||||
| Note (*): indicator not reported in INE (Instituto Nacional de Estadistica) database related to “Indicadores de la Agenda 2030 para el Desarrollo Sostenible”. | |||||||||||||||||||
| Economic indicators | |||||||||||||||||||
|---|---|---|---|---|---|---|---|---|---|---|---|---|---|---|---|---|---|---|---|
| Indicators | Description | Source | Eurostat Indicator | ||||||||||||||||
| Annual growth rate of real GDP per capita | Annual growth rate of real GDP per capita (chain-linked volume index) Unit of measure: % |
INE Contabilidad nacional anual de España | Real GDP per capita (sdg_08_10) | ||||||||||||||||
| Research and development expenditure as a share of GDP | Expenditure on internal R&D as a percentage of GDP at market prices Unit of measure: % |
INE | Gross domestic expenditure on R&D by sector (sdg_09_10) | ||||||||||||||||
| Number of researchers (in full time equivalent) per million inhabitants | Number of full-time equivalent research personnel per million inhabitants Unit of measure: Researchers (FTE) per million inhabitants |
INE | R&D personnel by sector (sdg_09_30) | ||||||||||||||||
| Per capita growth rates of household expenditure and income of total population households | Average annualised growth rate over a five-year period of household income per person in the total population Unit of measure: % |
INE Encuesta de condiciones de vida | Adjusted gross disposable income of households per capita sdg_10_20 | ||||||||||||||||
| Proportion of 16-74 years old using Internet in the last three months | Proportion of 16-74 years old who have used Internet in the last three months (preceding the survey) Unit of measure: % |
INE Encuesta sobre equipamiento y uso de tecnologías de información y comunicación en los hogares | High-speed internet coverage, by type of area (sdg_17_60) | ||||||||||||||||
| Average hourly wage | Gross earnings per normal hour of work of salaried employees Unit of measure: Euro |
INE Encuestas de estructura salarial | |||||||||||||||||
| Manufacturing value added as a share of GDP | Ratio of persons employed in the manufacturing sector to the total number of persons employed Unit of measure: % |
INE Contabilidad nacional anual de España: principales agregados | |||||||||||||||||
| Note: The indicators “Average hourly wage” and “Manufacturing value added as a share of GDP” are not included in the Eurostat database, but they were included in the analysis because considered relevant for the Spanish economic context. | |||||||||||||||||||
| Environmental indicators | |||||||||||||||||||
|---|---|---|---|---|---|---|---|---|---|---|---|---|---|---|---|---|---|---|---|
| Indicators | Description | Source | Eurostat Indicator | ||||||||||||||||
| Area under organic farming | Agricultural area, in which organic farming is practiced, in the first year of practice, in conversion and qualified in organic farming Unit of measure: % |
Producción Ecológica 2020. Ministerio de Agricultura, Pesca y Alimentación. Secretaría General Técnica. Centro de Publicaciones | Area under organic farming (sdg_02_40) | ||||||||||||||||
| Renewable energies in the Spanish electricity system | Proportion of renewable energy in gross final energy consumption. Renewable generation of each autonomous community over national renewable generation Unit of measure: % |
Red Eléctrica de España. Las energías renovables en el sistema eléctrico español | Share of renewable energy in gross final energy (sdg_07_40) | ||||||||||||||||
| Share of forest area | Forest area as a percentage of the total area. Unit of measure: % |
Ministerio de Agricultura, Pesca y Alimentación | Share of forest area (sdg_15_10) | ||||||||||||||||
| Surface of terrestrial sites designated under Natura 2000* | Area of protected terrestrial areas included in the Natura 2000 Network ((the data on the surface area of the Natura 2000 network does not correspond to the sum of the surface areas of SCIs and SPAs, as there are overlaps between the two types of sites that should not be counted twice) Unit of measure: % |
Ministerio para la Transición Ecológica y el Reto Demográfico. Red Natura 2000 | Surface of terrestrial sites designated under Natura 2000 (sdg 15_20) | ||||||||||||||||
| Urban waste generated per capita | Proportion of municipal solid waste collected and managed in controlled facilities with respect to the total municipal waste generated, broken down by autonomous community. Unit of measure: tonnes per capita |
INE y Ministerio de Agricultura, Alimentación y Medio Ambiente | Generation of waste excluding major mineral wastes by hazardousness(sdg_12_50) | ||||||||||||||||
| Recycling rate of municipal waste | Proportion of recycled municipal waste with respect to the total waste generated Unit of measure: % |
INE y Ministerio de Agricultura, Alimentación y Medio Ambiente | Recycling rate of municipal waste (sdg_11_60) | ||||||||||||||||
| Total greenhouse gas emissions | Total Greenhouse Gas (GHG) Emissions and other air pollutants from resident units per capita Unit of measure: tonnes of CO2 equivalent per capita |
Ministerio para la Transición Ecológica y el Reto Demográfico. | Net greenhouse gas emissions (sdg 13_10) | ||||||||||||||||
| Soil erosion by water* | Average soil losses, due to water erosion, according to erosive levels >10 (t.ha-1.year-1) Unit of measure: % |
Ministerio para la transición ecologíca y el reto demográfico | Estimated soil erosion by water – area affected by severe erosion rate (sdg_15_50) | ||||||||||||||||
| Note (*): indicator not reported in INE (Instituto Nacional de Estadistica) database related to “Indicadores de la Agenda 2030 para el Desarrollo Sostenible”. | |||||||||||||||||||
2.3 Sustainability Indices construction using MCDA
The analysis was made using SSAM – Spatial Sustainability Assessment Model (Rocchi et al., 2022). SSAM is an evaluation tool, aimed at defining a simplified procedure for monitoring the territorial dynamics in progress within a certain area, which allows an integrated reading of social, environmental, and economic issues. Therefore, it is useful for territorial planning activities in compliance with the sustainability principle.
The whole process of SSAM is run in a well-known open-source GIS environment called QGIS (GIS Development Team, 2017). Practically, SSAM is configured as a plugin, written in Python language, which uses the libraries made available by QGIS to perform the processing requested by the user. Being a plugin inside QGIS, in addition to performing the calculations foreseen by the evaluation algorithm – more specifically TOPSIS (Hwang and Yoon, 1981) – the input and output data can be managed like any other geographical data and the user is free to carry out further geostatistical analyses, geoprocessing, or reporting operations. It represents, in fact, a perfect integration of a multi-criteria analysis procedure with the geographical tool.
When we speak of multi-criteria methods, we refer to a family of different methods. As reported, SSAM applies a specific multi-criteria method called TOPSIS (Technique for Order of Preference by Similarity to Ideal Solution) developed by Hwang and Yoon in 1981. The concept at the basis of the method is that, in a group of alternatives, the one being at the minimum distance from the ideal solution (best score in each criterion) and the maximum distance from the worst one (worst score in each criterion) is the best alternative. In particular, the method defines a ranking based on several criteria, setting an objective to aim for (ideal point) and one to move away from (worst point), for each evaluation criterion. The ideal solution therefore represents a hypothetical alternative that optimizes the value of each criterion and can be found within the range of the proposed indicators or outside of it.
The distance measured in TOPSIS is used as a proxy for human preference. Alternatives can be ranked on the grounds of the values assumed by the criteria, which are considered as monotonically increasing or decreasing and therefore to be maximized or minimized (Kalbar et al., 2012). The choice of TOPSIS within SSAM deals with the type of criteria used (generally cardinal) and its good performance in case of a large number of alternatives (Kalbar et al., 2012); moreover, it was chosen because its logic is rational and understandable, and also the computation processes are straightforward (García-Cascales and Lamata, 2012).
The final product of the processing is represented by numerical outputs, but also graphics and maps are produced. By default, SSAM produces three different indices and relative cartographic representations: EcoIdeal (Index of Economic sustainability), EnvIdeal (Index of Environmental sustainability), and SocIdeal (Index of Social sustainability).
The steps of the indices construction are described in the following, using SocIdeal as a reference for all three ones.
STEP 1: Establish a performance matrix
The finite set of criteria for the SocIdeal can be described as: , (n=10 in this case) while is the discrete set of feasible alternatives, representing the seventeen Spanish autonomous communities. Each alternative is evaluated with respect to the criteria, whose values constitute a decision matrix denoted by:
where represents the performance value of the Spanish autonomous community concerning the criterion described in paragraph 2.2.
STEP 2. Normalize the decision matrix
In the classical TOPSIS approach, the normalized performance matrix can be obtained using the following transformation formula:
(2)
where is the normalized value of the performance value of the autonomous community with respect to the criterion. Consequently, after normalization, each attribute has the same unit scale.
STEP 3. Calculate the weighted normalized decision matrix
In MCDA a crucial phase is the definition of the weights, used to quantify the relevance of the selected criteria. The definition of the weights can be grounded on subjective user-defined weighting methods or objective weighting procedures. Although subjective weights are usually preferred, in complex scenarios they can be too difficult to apply and may lead to unsatisfactory results. For this reason, the application of objective methods, based on statistical approaches, random weighting procedures, or information theory, can be a valid alternative.
In the present paper, we calculated weights through a statistical method, the Coefficient of Variation (COV) (El Santawy and Ahmed, 2012). The method calculates the weights considering the COV of performance of all the criteria for each autonomous community. For the COV-based weight calculation the first step is the calculation of another normalized criteria matrix, using the equation:
(3)
is the matrix after range standardisation; and are the maximum and the minimum values of the criterion respectively; all values in are .
Then, we calculate the Standard Deviation of the normalised matrix . The Standard Deviation is calculated for every indicator as shown in equation below:
(4)
where is the mean of the values of the indicator after the normalization and . After calculating the Standard Deviation for all the indicators the COV of indicator i will be calculated as follows
(5)
The weight for each indicator is then calculated using the equation:
(6)
STEP 4. Determine the positive ideal and negative ideal solutions
The positive ideal value set ( and the negative ideal value set ( are determined as follows:
(7)
i= 1,2, …, 10
(8)
i= 1,2, …, 32
where I is associated with benefit criteria, and is associated with cost criteria.
STEP 5. Calculate the separation measures
The separation of each alternative (i.e.: Spanish autonomous communities) from the positive ideal solution is given as follows:
(9)
while the separation of each alternative from the negative ideal solution is given as follows:
(10)
TOPSIS can be applied using different types of distances: we used the Euclidean distance.
STEP 6. Calculate the relative closeness to the ideal solution
The relative closeness to the ideal solution can be expressed as follows:
i=1, …, 17(11)
If
If
where the value lies between 0 and 1. The closer the value is to 1, the higher the priority of the alternative.
STEP 7. Rank the preference order
With this passage we rank the best alternatives according to in descending order, which mean to rank the Spanish autonomous communities according to the social dimension. Therefore, the value of is the SocIdeal. The same steps allow the assessment of the other two indices, EnvIdeal and EcoIdeal.
Along with the calculation of the three separated indices, SSAM permits to have an additional global sustainability index, through the weighting summation of the dimensional indices, following the (12):
(12)
where represents the weight of the pillar and the index of the pillar (Economic, Environmental, Social) for the Communities.
All the described steps are handled by SSAM, which needs to work a geographical file as an information base, in particular a GeoPackage format, where the graphic part represents the study area with the single units to be evaluated (in our case study the Spanish autonomous communities), while the alphanumeric part (table of attributes), describes the aspects of the individual territorial units to be analyzed, through the set of selected indicators (in our case study ).
2.4 Statistical methods
SSAM results were statistically analysed with several methods, with the aim of assessing the relationships between the indices and the temporal changes experienced in the autonomous communities. Basic descriptive statistics of the indices (i.e., mean, standard deviation, minimum, maximum, and coefficient of variation) were computed in order to summarize the main features of the SSAM input variables and modelling results. Then, the Shapiro–Wilk (S-W) test of normality was computed to determine the distribution of the variables. The s-W test was used to assess if SSAM input variables and modelling results were well-modelled by a normal distribution or not. The s-W test was computed along with the descriptive statistics. Due to the limited number of variables that fitted a normal distribution, non-parametric tests were preferably adopted for further analyses.
The correlations among the values of each index for the 17 regions were analysed with the Spearman rank correlation test (Spearman, 1904). Spearman test is a non-parametric method used to assess the rank correlation between pairs of variables. It is a non-parametric method that employs a monotonic function (instead of a linear relationship) to describe the relationship among a pair of variables. It was used to compare the modelling results obtained for 2019 (Pre-COVID) against 2020 (COVID pandemic). Spearman rank correlation (rho) values allowed the identification of significant (or not) relationships between the pairs of indices.
For a better visual inspection of these results, boxplots for each index were created. Extreme values in the boxplots were highlighted according to the procedure proposed by McGill et al. (1978). Additionally, Dunn’s test (Dunn, 1964) was used for pairwise multiple comparison of Pre-COVID indices (2019) against COVID Pandemic indices (2020). Dunn’s test results were used to identify homogeneous subgroups of variables, including these subgroups as letters in the boxplots. Dunn’s test was computed using the dates as factor (i.e., 2019 vs. 2020), with a significant level of p < 0.05. All statistical analyses and boxplots of the SSAM results were conducted with the R programming language (R Core Team, 2023).
3. Results
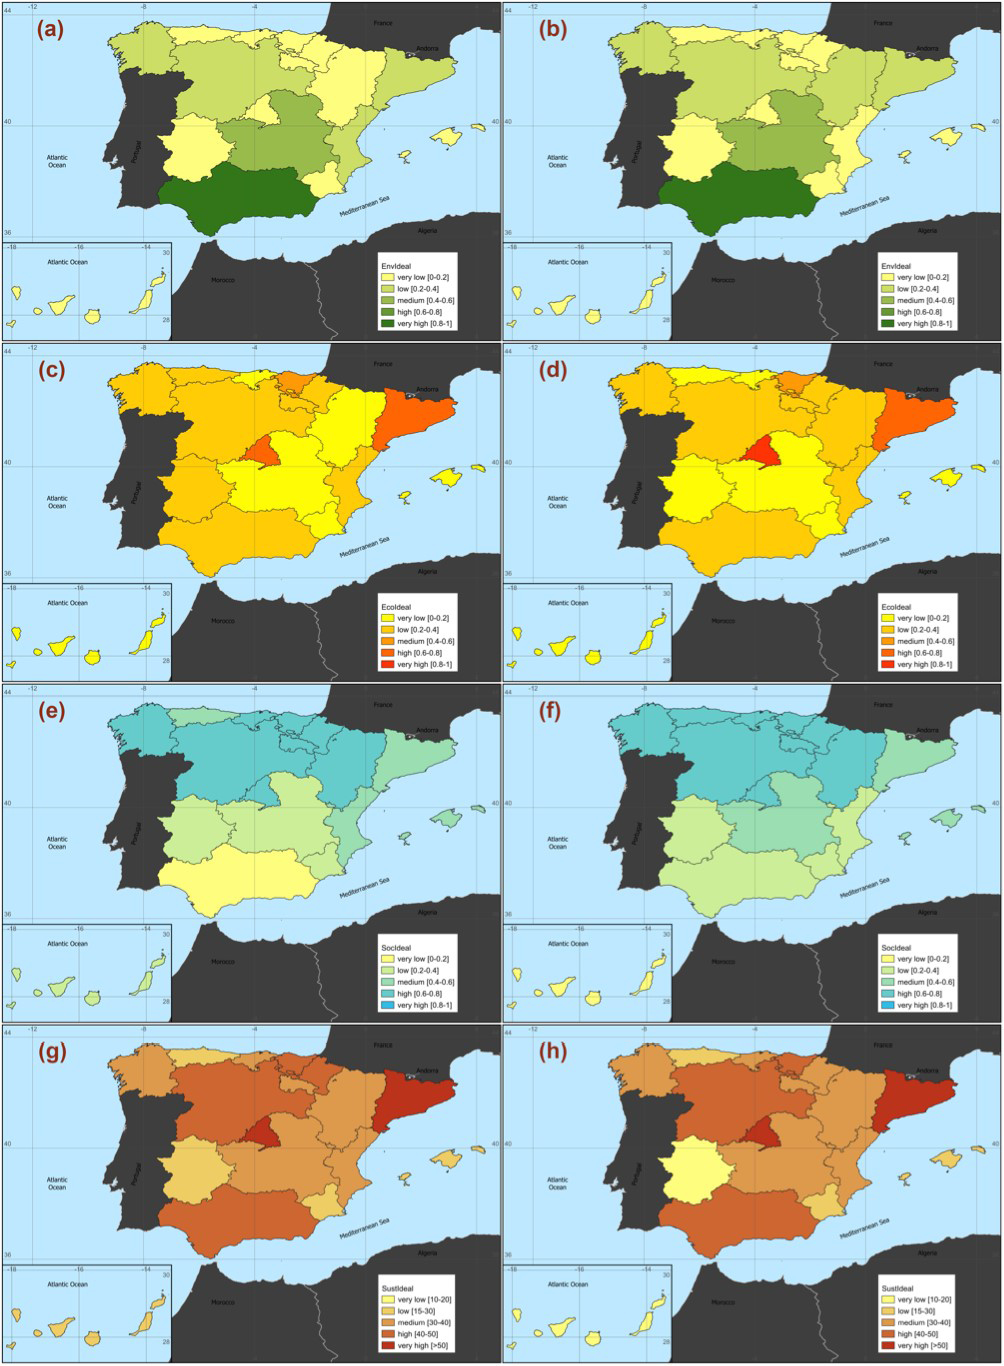
The application of SSAM allowed the computation of the three basic indices EnvIdeal, EcoIdeal, SocIdeal, plus the aggregated SustIdeal index for 17 Spanish regions (Figure 3), before the irruption of the global COVID pandemic (2019; Pre-COVID) and after that (2020; COVID Pandemic).
For Pre-COVID indices (Table 5), the regions that reached a maximum value in each of the indices were Andalucía for the environmental dimension (EnvIdeal = 0.857), Comunidad de Madrid for the economic dimension (EcoIdeal = 0.791), Comunidad Foral de Navarra for the Social dimension (SocIdeal = 0.779), and Comunidad de Madrid again for the global sustainability index (SustIdeal = 54.613). Minimum values for the indices were reported for Asturias (EnvIdeal = 0.102), Islas Baleares (EcoIdeal = 0.101), Andalucía (SocIdeal = 0.190) and Islas Canarias (SustIdeal = 20.640). Inter-region variability was notable for all the indices, especially from the point of view of the environmental (CV = 72.893%) and economic (CV = 66.718%) dimensions.
| Region | 2019 (Pre-COVID) | 2020 (COVID Pandemic) | ||||||
|---|---|---|---|---|---|---|---|---|
| EnvIdeal | EcoIdeal | SocIdeal | SustIdeal | EnvIdeal | EcoIdeal | SocIdeal | SustIdeal | |
| Andalucía | 0.857 | 0.390 | 0.190 | 47.870 | 0.823 | 0.395 | 0.245 | 48.757 |
| Aragón | 0.188 | 0.188 | 0.743 | 37.297 | 0.205 | 0.206 | 0.737 | 38.260 |
| Asturias | 0.102 | 0.213 | 0.482 | 26.543 | 0.102 | 0.181 | 0.605 | 29.587 |
| Islas Baleares | 0.143 | 0.101 | 0.579 | 27.423 | 0.138 | 0.080 | 0.419 | 21.243 |
| Islas Canarias | 0.165 | 0.114 | 0.340 | 20.640 | 0.143 | 0.097 | 0.125 | 12.193 |
| Cantabria | 0.117 | 0.182 | 0.728 | 34.237 | 0.101 | 0.180 | 0.667 | 31.623 |
| Castilla y León | 0.295 | 0.263 | 0.719 | 42.550 | 0.284 | 0.272 | 0.661 | 40.577 |
| Castilla-La Mancha | 0.427 | 0.142 | 0.372 | 31.380 | 0.401 | 0.168 | 0.517 | 36.220 |
| Cataluña | 0.292 | 0.758 | 0.504 | 51.797 | 0.303 | 0.791 | 0.518 | 53.753 |
| Comunidad Valenciana | 0.214 | 0.361 | 0.489 | 35.490 | 0.193 | 0.367 | 0.351 | 30.357 |
| Extremadura | 0.191 | 0.226 | 0.245 | 22.063 | 0.168 | 0.180 | 0.222 | 18.997 |
| Galicia | 0.268 | 0.265 | 0.637 | 38.983 | 0.252 | 0.253 | 0.600 | 36.857 |
| Comunidad de Madrid | 0.193 | 0.791 | 0.654 | 54.613 | 0.172 | 0.801 | 0.625 | 53.250 |
| Región de Murcia | 0.166 | 0.186 | 0.327 | 22.657 | 0.141 | 0.193 | 0.371 | 23.513 |
| Comunidad Foral de Navarra | 0.175 | 0.304 | 0.779 | 41.913 | 0.180 | 0.296 | 0.679 | 38.477 |
| País Vasco | 0.169 | 0.452 | 0.729 | 45.007 | 0.181 | 0.456 | 0.768 | 46.847 |
| La Rioja | 0.160 | 0.201 | 0.763 | 37.463 | 0.137 | 0.205 | 0.738 | 36.013 |
| Mean | 0.242 | 0.302 | 0.546 | 36.349 | 0.231 | 0.301 | 0.521 | 35.090 |
| Std. deviation | 0.177 | 0.202 | 0.194 | 10.315 | 0.171 | 0.211 | 0.198 | 11.815 |
| Minimum | 0.102 | 0.101 | 0.190 | 20.640 | 0.101 | 0.080 | 0.125 | 12.193 |
| Maximum | 0.857 | 0.791 | 0.779 | 54.613 | 0.823 | 0.801 | 0.768 | 53.753 |
| CV (%) | 72.893 | 66.718 | 35.616 | 28.378 | 74.183 | 70.031 | 38.076 | 33.672 |
In 2020, during the COVID Pandemic (Table 5), Andalucía also reached the maximum environmental dimension index value (EnvIdeal = 0.823) and Comunidad de Madrid the maximum economic dimension index (EcoIdeal = 0.801). Unlike the previous period, the maximum social dimension index value was for País Vasco (SocIdeal = 0.768) and maximum global sustainability was for Cataluña (SustIdeal = 53.753). For minimum values, some changes were also reported. Cantabria (EnvIdeal = 0.101), Islas Baleares (EcoIdeal = 0.080), and Islas Canarias (SocIdeal = 0.125 and SustIdeal = 12.193) were the regions in which the lowest values were obtained for any of the indices. Additionally, inter-region variability increased for all the indices, especially for SustIdeal which exhibited an increase in the coefficient of variation from 28.378% to 33.672%.
3.1 Temporal changes during the first year of the COVID Pandemic
To analyse the global dynamic of the different dimensions, several graphical and statistical methods were used. Spearman rank correlation test was computed for each index comparing their values before and after COVID irruption (2019 vs. 2020). High Spearman’s rho values and significant correlations (p-value ≤ 0.05) were observed for the four indices. Spearman’s rho values were 0.94 for the EnvIdeal and EcoIdeal, 0.91 for SocIdeal, and 0.97 for SustIdeal.
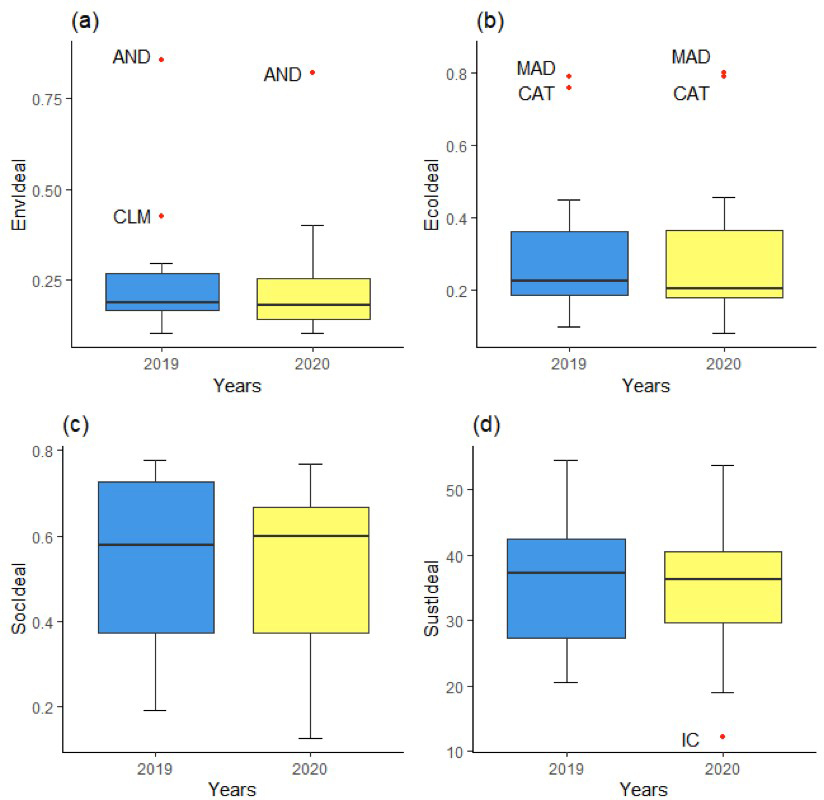
Additionally, boxplots allowed a visual comparison of the evolution of the indices during COVID pandemic (Figure 4). Subtle overall change for all the indices was observed by comparing the Pre-COVID situation (2019) against COVID-Pandemic (2020) boxplots. To analyse the magnitude of these changes, the nonparametric pairwise multiple comparisons Dunn’s test was computed. It revealed non-significant differences for any of the indices (p-value ≤ 0.05). However, some outstanding values were identified for the environmental dimension (Andalucía for both years and Castilla La Mancha in 2019), and the economic dimension (Comunidad de Madrid and Cataluña for both years). On the contrary, the global sustainability index exhibited an extremely low value for Islas Canarias in 2020. These results suggest that it is necessary to carry out a more detailed analysis (region by region) to understand the particularities of the temporal evolution of the different dimensions.
Thematic maps of the four indices (class thresholds developed for equal intervals) provided a visual analysis of the global results. In general, both in 2019 and 2020, for the environmental dimension (EnvIdeal; Figure 2a and 2b) 11 regions obtained very low results, showing a generally scarce environmental situation; 4 regions obtained low results, just one had intermediate ones, and one region (Andalucía) had the best – very high – results. For the economic dimension (Ecoideal; Figure 2c and 2d), both in 2019 and 2020, a total of 14 regions had low or very low results, also showing a rather negative and uneven economic situation across regions. As mentioned, Comunidad de Madrid and Cataluña were the regions with the highest values (both exhibited high values in 2019, and even Madrid very high values in 2020), while País Vasco had intermediate performances. For the social dimension (SocIdeal; Figure 2e and 2f), in general, the north had better outcomes than the south, having 8 regions with high results. From 2019 to 2020, there was an improvement in Andalucía (very low to low), Asturias (medium to high), and Castilla-La Mancha (low to medium) results and a worsening for Islas Canarias (low to very low), Comunidad Valenciana (medium to low) and Galicia (high to medium). The global sustainability maps (SustIdeal; Figure 2g and 2h) showed a generally good situation, with medium, high, and even very high indexes, especially in the centre-north of Spain. We only observed negative changes in the SustIdel index category for Islas Canarias (low to very low), Extremadura (also low to very low), and Comunidad Foral de Navarra (high to medium).
For a more quantitative analysis of the temporal changes, the percentage of change for each index and region was computed (Table 6). The most remarkable improvements of the indices were for Aragon with the EnvIdeal index (+9.1%), and Castilla-La Mancha for the other three indices (EcoIdeal: +18.4%; SocIdeal: + 39.0%; SustIdeal: +15.4%). On the contrary, the highest declines of the indices were for Región de Murcia with the EnvIdeal index (-15.1%), Extremadura with the EcoIdeal (-20.3%), and Islas Canarias for the two remaining indices (SocIdeal: -63.1%; SustIdeal: -40.9%). This kind of analysis confirmed the impression given by the maps (in particular the decline of Islas Canarias and the improvement of Castilla-La Mancha detected within the social dimension).
| Region | EnvIdeal | EcoIdeal | SocIdeal | SustIdeal |
| Andalucía | -3.9 | 1.4 | 28.9 | 1.9 |
| Aragón | 9.1* | 9.6 | -0.8 | 2.6 |
| Asturias | 0.2 | -15.2 | 25.6 | 11.5 |
| Islas Baleares | -3.4 | -20.2 | -27.7 | -22.5 |
| Islas Canarias | -13.2 | -14.9 | -63.1# | -40.9# |
| Cantabria | -13.7 | -0.6 | -8.4 | -7.6 |
| Castilla y León | -3.7 | 3.5 | -8.0 | -4.6 |
| Castilla-La Mancha | -6.1 | 18.4 | 39.0 | 15.4 |
| Cataluña | 4.0 | 4.4 | 2.7 | 3.8 |
| Comunidad Valenciana | -10.2 | 1.5 | -28.1 | -14.5 |
| Extremadura | -12.2 | -20.3# | -9.3 | -13.9 |
| Galicia | -6.0 | -4.3 | -5.7 | -5.5 |
| Comunidad de Madrid | -11.2 | 1.3 | -4.5 | -2.5 |
| Región de Murcia | -15.1# | 3.6 | 13.5 | 3.8 |
| Comunidad Foral de Navarra | 3.0 | -2.6 | -12.9 | -8.2 |
| País Vasco | 7.0 | 1.0 | 5.3 | 4.1 |
| La Rioja | -14.3 | 2.1 | -3.3 | -3.9 |
4. Discussion
The implementation of SDGs in Spain is a very complex task that should take into consideration the socioeconomic and environmental context of the population and requires the implication and coordination of national, regional, and local authorities along with social actors. In a country with half of all municipalities at risk of extinction (FEMP, 2017), the differences between the countryside vs large cities and coastal areas are remarkable. This is a consequence of a very acute rural population exodus to cities with the consequent rural economy decline which has triggered the emergence of multiple rural development strategies and projects driven by public institutions that barely consider social engagement and integration of sustainable development goals together (Diaz-Sarachaga, 2020). Unfortunately, institutional decision-making mechanisms are based on consultative approaches that do not favour the effective involvement of social actors in decisions leading to sustainability (López-Rodríguez et al., 2024). This means that the degree of implementation of the SDGs at the national level is deficient at the economic, social, and environmental levels (Boto-Álvarez y García-Fernández, 2020). For this reason, remarkable inter-region differences are expected.
From the point of view of the environmental dimension, Andalucía always reached a very high value in the EnvIdeal index. This outcome may be explained by the high proportion of the agricultural land devoted to ecological agriculture. According to the official values of this indicator, about 45% of Andalucía’s agricultural land is cultivated using some kind of ecological agriculture practices. This value is much higher than the average value for Spain (less than 6%), only followed in a long distance by Castilla La Mancha with 17% of ecological agricultural land.
Comunidad de Madrid reached the highest values of the economic dimension for both years. It performed very well for all the economic indicators, but the most remarkable one was the number of researchers per million inhabitants (more than 35,000 for both years), four times higher than the national average. After Comunidad de Madrid, Cataluña also had a powerful economic dimension, with a lower number of researchers but higher values of the manufacturing indicator. On the contrary, Islas Baleares obtained the lowest value of the EcoIdeal. Its economic dimension is very linked with tourism industry while the importance of academic activities (number of researchers) and manufacturing is really poor.
Although boxplots revealed no outliers for the SocIdeal index (see Figure 3), central-north regions consistently exhibited highest values of the social dimension. Their good results are a combination of a reduced unemployment rate and a low proportion of population living in households with certain housing deficiencies.
4.1 Temporal changes
The higher increase in EnvIdeal index was for the Aragón region (+9.1%). This was mainly due to the increase in the renewable energy production indicator. In 2020, 68.3% of all energy generation in this region came from renewable sources, with an increase of 48.6% over the previous year (REE, 2021). On the opposite, Region de Murcia exhibited a notable reduction of this index (-15.1%), related to lower values of the renewable energy production indicator. The achievement for Aragon is very positive for reducing energy production carbon footprint, but various controversies are arising as a result of how these energy production facilities are planned and implemented in the territory. There is great social concern in rural areas due to the long-term (positive and negative) impacts on the territory (Duarte et al., 2022). In some regions, especially low population density inland autonomous communities, the generation of electricity is significantly higher than consumption (i.e., Galicia, Castilla y León, Castilla-La Mancha, Extremadura, Aragón, and Asturias), promoting spatial inequalities in the distribution of energy production across regions (Perez-Sindin et al., 2022). This problem may negatively affect the consecution of SDGs in rural areas, where small farms, enterprises, and a significant portion of the population don’t perceive the environmental benefits of the implementation of new renewable energy infrastructures. In this sense, planning instruments should take into consideration pre-existing activities to ensure compatibility with new renewable energy developments (Prados et al., 2021).
From the point of view of the other dimensions of our sustainability analysis, Castilla La Mancha experienced the most positive increase in the EcoIdeal and SocIdeal. This region experienced the lowest reduction of the GDP during COVID Pandemic, resulting in an improvement of the EcoIdeal index as compared with the other regions. In this sense, autonomous communities whose economies are the most dependent on the tourism-related sector, such as Islas Canarias and Islas Baleares, suffered the biggest impact on their GDP (Pinilla et al., 2021), and consequently, their economic dimension was severely affected. Reinforcing this good resilience to COVID pandemic, Castilla La Mancha obtained a notable reduction of the population with severe material deprivation indicator, which changed from 7.4 to 3.1 (-58%). The improvement of the economic and social dimensions led to a 15.4% increase in the SustIdeal index for Castilla La Mancha.
On the contrary, Islas Canarias experienced the worst change in the global sustainability indicator during COVID Pandemic. Before the pandemic, their values for the three indices were low (SocIdeal = 0.340) or very low (EnvIdeal = 0.165; EcoIdeal = 0.114). During the pandemic, the scenario is worse (all the indices are in the very low range), standing out above all due to the abrupt increase in the population living in homes with certain housing deficiencies (from 15.15% in 2019 to 33.1% in 2020) that promoted a dramatic decrease in the social dimension index (SocIdeal was 0.125 in 2020).
The study of Paolotti et al., 2019 investigated the sustainability of the Spanish autonomous communities, applying the preceding version of SSAM (i.e. GeouUmbriaSUIT). The study had as a reference basis the Europa 2020 context and not the more recent Sustainable Development Goals framework. Therefore, although the aim of the work was to evaluate the sustainability at the territorial level of those areas, the premises for the choice of the indicators to be used were different. Anyway, some interesting correlations between the results of the two studies could be found. In particular, in the previous study a decrease of sustainability from north to south was detected, both for the social and for the global sustainability dimensions. Here we can confirm the same tendency, especially for the social dimension, where the central-north regions exhibited the highest values of the SocIdeal; for global sustainability the trend could be generally confirmed, except for Andalucía, which reached the highest values of global sustainability, showing a sensitive improvement within the ranking in comparison to the previous study. The results reached by Andalucía in terms of global sustainability could be connected to its good outcomes in the environmental dimension.
Another analogy found with the previous study could be that the social dimension is the one that seems to mark the ordination of most of the communities for sustainability. Regarding the economic index results, as in Paolotti et al. (2019), the majority of the regions belong to the low and very low classes, while only a few regions have medium or high class/very high class, and they are located in the most economic developed areas of Spain (Comunidad de Madrid, Cataluña, followed by País Vasco, which are also the most densely populated areas).
Moreover, in both studies the environmental dimension seems to be quite independent of the economic and social situations, as the richest regions have also good social results but are not at all the most environmentally sustainable. Also, the study of Delli Paoli and Addeo (2019), which aimed to propose a method for comprehensively assessing SDGs, showed that generally the social and economic pillars are quite aligned whereas the environmental pillar is disconnected from them. This may indicate a misalignment between socio-economic and environmental policies that need further investigation.
Spain has a long way to go to fulfil its commitment to the 2030 Agenda and meet EU standards (Boto-Álvarez and García-Fernández, 2020). This process must be developed by understanding the different realities of the population (rural vs urban pollution), the economic disparities between regions, and the problems closest to people’s daily lives (e.g., unemployment, access to housing). This study highlights the different response capacities at a regional level to a negative event such as the COVID-19 pandemic. It is therefore necessary to develop a more comprehensive, integrative, and resilient SDG implementation strategy against possible future events.
5. Conclusion
With this work, we tried to evaluate the progress in achieving the Sustainable Development Goals of the autonomous communities belonging to Spain. The UN Agenda 2030 and its SDGs are the current benchmarks for achieving sustainability in policies and territorial planning at the international level. However, the evaluation cannot be solely at a national level, and it is particularly urgent in all cases, as for Spain, where there are gaps in specific dimensions. Systems at a local level must be investigated in order to have effective and realistic evaluations of specific territorial contexts, for evaluating the real level of sustainable development, to calibrate specific policy measures on the basis of the composite territorial areas and local characteristics. For this reason, the regional dimension was chosen for the investigation, and a proper set of indicators was constructed for this level of governance. Starting from the structure of Agenda 2030 and analyzing the indicators provided by Eurostat we examined the specific Spanish indicators available, with a focus on the various regions, finding a correspondence with the Eurostat data. The regions datasets referred to years 2019 and 2020 to observe a comparison of pre and post-COVID framework and to assess possible changes due to the very first pandemic impacts.
The analysis was carried out with SSAM, an integrated multi-criteria analysis tool in a geographic environment. Integrated methodologies that use a number of indicators using a geographic approach improve the results of sustainability studies, since the spatial focus allows for a better representation of actions according to the specific territorial levels considered (local, national, supra-national) and the relative needs individuated. Differences that are found at regional levels identify the need for sustainability strategies that are not homogenous across all national territory.
The application of SSAM allowed for separately considering the three dimensions of sustainability – environmental, economic, and social – and the computation of the three basic indices EnvIdeal, EcoIdeal, SocIdeal, plus the aggregated Sustainability index for 17 Spanish regions, before the irruption of the global COVID pandemic (2019; Pre-COVID) and after that (2020; COVID Pandemic). Results showed that, both in 2019 and 2020, for the environmental dimension the majority of the regions obtained very low or low results, showing a generally scarce environmental situation. Also, the economic dimension results, both in 2019 and 2020, showed a rather negative and uneven situation across regions. For the social dimension, in general, the north had better outcomes than the south, having 8 regions with high results. A general decline for the majority of the indices was observed by comparing Pre-COVID situation (2019) against the first year of COVID-Pandemic (2020). As noticed in a previous study, a decrease in sustainability from north to south was detected, both for the social and the global sustainability dimensions, with the exception of Andalucía, which reached the highest values of the latter. The social dimension in most cases should be the one marking the global ordination of the communities.
Moreover, the environmental dimension seemed to be quite independent from the economic and social situations, as the richest regions had also good social results but were not at all the most environmentally sustainable. This may indicate a misalignment between socio-economic and environmental policies that need further investigation.
One limitation of the study lies in its being a relative and not an absolute assessment: the best and worst values were chosen within the distribution of available data. Therefore, the outcomes are about the relative performance of the regions and not their absolute progress toward the Agenda achievement. To have an absolute type of study, thus showing absolute progress toward the goals, it is necessary to have absolute worst and best points.
Another limit of the study lies in the fact that obviously only a restricted set of indicators referred to SDGs could be used, given the selection criteria chosen and the availability of data at the regional level. Indeed, it is well known that data for monitoring the 2030 Agenda are not always easily accessible, especially when individual regional units are to be evaluated. Therefore, an improvement of the analysis could concern the consideration of a wider set of indicators, when and if available. In the same way, a complete assessment of all SDGS could lead to a significant enhancement of the assessment framework.
Also, the analysis was now limited to a temporal period of two years, particularly for focusing on the year of Pre-COVID and the year just after that. A further analysis could concern a wider temporal period, even if the indicators about SDGs are available only from a certain time period onwards.
Despite this limitation, these types of analyses are useful for public decision making to understand which regions are lagging behind others. Also, considering the data used this analysis allows the public decision maker to understand in which areas the greatest setbacks occurred due to the pandemic in its first year. Only in this way it will be possible to devise common measures for the totality of member countries, as well as specific territorial measures tailored to the needs of sustainable development, strengths and weaknesses of different sub-areas within a country.
A further development of the study could concern the inclusion of the institutional dimension within the analysis, in order to have a complete sustainability assessment, also at this territorial level. Another interesting aspect could be making a connection with Spanish policies, concerning the budgets allocated in the different programmes, in order to observe the correlation with the sustainability indexes.
Moreover, this kind of model was designed to be applied in any other international territorial context for which such a kind of analysis could be useful.
References
Allen, C., Reid, M., Thwaites, J., Glover, R., & Kestin, T. (2020). Assessing national progress and priorities for the sustainable development goals (SDGs): experience from Australia. Sustainability Science, 15(2), 521–538.
Benedek, D., Gemayel E. R., Senhadji, A. S., & Tieman, F. (2021). A Post-pandemic assessment of the sustainable development Goals. Staff. Discuss. Notes, 3.
Boggia, A., Massei, G., Pace, E., Rocchi, L., Paolotti, L., & Attard, M. (2018). Spatial multicriteria analysis for sustainability assessment: a new model for decision making. Land Use Policy, 71, 281–292. https://doi.org/10.1016/j.landusepol.2017.11.036
Boto-Álvarez, A., & García-Fernández, R. (2020). Implementation of the 2030 Agenda Sustainable Development Goals in Spain. Sustainability, 12(6), 2546. https://doi.org/10.3390/SU12062546
Canavese, D., Diquera Ortega, N. R., & Queiros, M. (2014). The assessment of local sustainability using the fuzzy logic: an expert opinion system to evaluate environmental sanitation in the Algarve Region Portugal. Ecological Indicators, 36, 711–718.
Carrillo, M. (2022). Measuring progress towards sustainability in the European Union within the 2030 Agenda framework. Mathematics, 10, 2095. https://doi.org/10.3390/math10122095
D’Adamo, I., Gastaldi, M., & Morone, P. (2022). Economic sustainable development goals: assessments and perspectives in Europe. Journal of Cleaner Production, 354, 131730. https://doi.org/10.1016/j.jclepro.2022.131730
Dahl, A. L. (2012). Achievements and gaps in indicators for sustainability. Ecological Indicators, 17, 14–19.
De Toro, P., Formato, E., & Fierro, N. (2023) Sustainability assessments of peri-urban areas: an evaluation model for the territorialization of the Sustainable Development Goals. Land, 12(7), 1415.
Diaz-Sarachaga, J. M. (2020). Combining participatory processes and Sustainable Development Goals to revitalize a rural area in Cantabria (Spain). Land, 9, 412. https://doi.org/10.3390/land9110412
Diaz-Sarachaga, J. M., Jato Espino, D., & Castro Fresno, D. (2018). Is the Sustainable Development Goals (SDG) index an adequate framework to measure the progress of the 2030 Agenda?. Sustainable Development, 26, 663–671.
Duarte, R., García-Riazuelo, Á., Sáez, L. A., & Sarasa, C. (2022). Analysing citizens’ perceptions of renewable energies in rural areas: a case study on wind farms in Spain. Energy Reports, 8, 12822–12831. https://doi.org/10.1016/j.egyr.2022.09.173
Dunn, O. J. (1964). Multiple comparisons using rank sums. Technometrics, 6, 241–252. https://doi.org/10.1080/00401706.1964.10490181
El-Santawy, M., & Ahmed, A. (2012). CV-VIKOR: a new approach for allocating weights in Multi Criteria decision making problems. Life Science Journal, 9(4), 5875–5877.
Farnia, L., Cavalli, L., Lizzi, G., & Vergalli, S. (2019). Methodological insights to measure the Agenda 2030 at urban level in Italy. Sustainability, 11(17), 4598. https://doi.org/10.3390/SU11174598.
FEMP (2017). Población y despoblación en España. Federación Española de Municipios y Provincias (FEMP). Available at: http://femp.femp.es/files/566-2117-archivo/20170125%20informe_despoblacion.pdf (accessed 22 November 2024).
Firoiu D., Ionescu G. H., Băndoi A., Florea N. M., & Jianu E. (2019). Achieving sustainable development goals (SDG): implementation of the 2030 Agenda in Romania. Sustainability, 11(7), 2156. https://doi.org/10.3390/su11072156
García-Cascales, M. S., & Lamata, M. T. (2012). On rank reversal and TOPSIS method. Mathematical and Computer Modelling, 56(5-6), 123–132.
GIS Development Team (2017). QGIS Geographic Information System Open Source Geospatial Foundation Project. https://www.qgis.org/
Hametner, M., & Kostetckaia, M. (2020). Frontrunners and laggards: how fast are the EU member states progressing towards the sustainable development goals? Ecological Economics, 177, 106775.
Huan, Y., Liang, T., Li, H., & Zhang, C. (2021). A systematic method for assessing progress of achieving sustainable development goals: a case study of 15 countries. Science of the Total Environment, 752, 141875.
Hwang, C. L., & Yoon, K. (1981). Multiple attribute decision making: methods and applications. New York, Springer-Verlag.
ICS & SDSN (2021). O Índice de Desenvolvimento Sustentável das Cidades – Brasil (IDSC-BR). Instituto Cidades Sustentáveis & Sustainable Development Solutions Network, São Paulo & Paris.
INE (2023). INEbase. Spanish National Institute of Statistics (INE) online database. Available at: www.ine.es (accessed 1 January 2023).
Kalbar, P .P., Karmakar, S., & Asolekar, S. R. (2012). Technology assessment for wastewater treatment using multiple-attribute decision making. Technology in Society, 34(4), 295–302
Kiselakova, D., Stec, M., Grzebyk, M., & Sofrankova, B. (2020). A multidimensional evaluation of the sustainable development of European Union countries—an empirical study. Journal of Competitiveness, 12(4), 56–73. https://doi.org/10.7441/joc.2020.04.04
Lafortune, G., Fuller, G., Kloke-Lesch, A., Koundouri, P., & Riccaboni, A. (2024). European elections, Europe’s future and the SDGs: Europe Sustainable Development Report 2023/24. Paris, SDSN and SDSN Europe and Dublin, Dublin University Press. https://doi.org/10.25546/104407
López Rodríguez, M. D., Jiménez-Aceituno, A., Quintas-Soriano, C., Requena-Mullor, J. M., Garau, E., Alba-Patiño, A., Otamendi-Urroz, I., Aguiar, A. P. D., Cortés-Calderón, S., & Castro, A. J. (2024). Applying the Three Horizons approach in local and regional scenarios to support policy coherence in SDG implementation: insights from arid Spain. Global Environmental Change, 89, 102922. https://doi.org/10.1016/j.gloenvcha.2024.102922
Lyytimäki, J., Salo, H., Lepenies, R., Büttner, L., & Mustajoki, J. (2020). Risks of producing and using indicators of sustainable development goals. Sustainable Development, 28(6), 1528–1538. https://doi.org/10.1002/SD.2102
Malczewski, J. (2010). Multiple criteria decision analysis and geographic information systems. In Ehrgott, M., Figueira, J., & Greco, S. (Eds.). International Series in Operations Research & Management Science, vol. 142, 369–395. New York, Springer.
Mascarenhas, A., Coelho, P., Subtil, E., & Ramos, T. B. (2010). The role of common local indicators in regional sustainability assessment. Ecological Indicators, 10(3), 646–656. https://doi.org/10.1016/J.ECOLIND.2009.11.003
McArthur J. W., & Rasmussen K. (2019). Classifying sustainable development goal trajectories: a country-level methodology for identifying which issues and people are getting left behind. World Development, 123, 104608.
McGill, R., Tukey, J. W., & Larsen, W. A. (1978). Variations of box plots. The America Statistician, 32, 12–16.
Miola, A., & Schiltz, F. (2019). Measuring sustainable development goals performance: how to monitor policy action in the 2030 Agenda implementation?. Ecological Economics, 164, 106373. https://doi.org/10.1016/j.ecolecon.2019.106373
Nagy, J. A., Benedek, J., & Ivan, K. (2018). Measuring Sustainable Development Goals at a local level: a case of a metropolitan area in Romania. Sustainability, 10(11), 3962. https://doi.org/10.3390/SU10113962
Ottomano Palmisano, G., Govindan, K., Boggia, A., Loisi, R. V., De Boni, A., & Roma, R. (2016). Local action groups and rural sustainable development. A spatial multiple criteria approach for efficient territorial planning. Land Use Policy, 59, 12–26.
Paolotti, L., Del Campo Gomis, F. J, Agullo Torres, A. M, Massei, G., Boggia, A. (2019). Territorial sustainability evaluation for policy management: the case study of Italy and Spain. Environmental Science and Policy, 92, 207–219. https://doi.org/10.1016/j.envsci.2018.11.022
Perez-Sindin, X. S., Lee, J., & Nielsen, T. (2022). Exploring the spatial characteristics of energy injustice: a comparison of the power generation landscapes in Spain, Denmark, and South Korea. Energy Research and Social Sciences, 91, 102682. https://doi.org/10.1016/j.erss.2022.102682
Pinilla, J., Barber, P., Vallejo-Torres, L., Rodríguez-Mireles, S., López-Valcárcel, B. G., & Serra-Majem, L. (2021). The economic impact of the SARS-COV-2 (COVID-19) pandemic in Spain. International Journal of Environmental Research and Public Health, 18, 4708. https://doi.org/10.3390/ijerph18094708
Prados, M. J., Pallarès-Blanch, M., García-Marín, R., & del Valle, C. (2021). Renewable energy plants and business models: a new rural development perspective. Energies, 14, 5438. https://doi.org/10.3390/en14175438
R Core Team (2023). R: a language and environment for statistical computing. R Foundation for Statistical Computing, Vienna, Austria. Available at: https://www.r-project.org (accessed 15 January 2023).
Ravetz, J. (2000). Integrated assessment for sustainability appraisal in cities and regions. Environ. Environmental Impact Assessment Review, 20(1), 31–64.
REE (2021). Renewable generation increases by 49% in Aragon and accounts for 68% of its total annual production. Red Eléctrica de España (REE) Press release. Available at: www.ree.es (Accessed 15 January 2023).
Ricciolini, E., Rocchi, L., Cardinali, M., Paolotti, L., Ruiz, F., Cabello, J. M., & Boggia, A. (2022). Assessing progress towards SDGs implementation using multiple reference point based multicriteria methods: the case study of the European Countries. Social Indicators Research, 162(3), 1233–1260. https://doi.org/10.1007/s11205-022-02886-w
Rocchi, L., Ricciolini, E., Massei, G., Paolotti, L., & Boggia, A. (2022). Towards the 2030 Agenda: measuring the progress of the European Union countries through the SDGs Achievement Index. Sustainability, 14(6), 3563. https://doi.org/10.3390/su14063563
Rocchi, L., Paolotti, L., Tiralti, A., Stranieri, P., & Boggia, A. (2023). The Italian National Strategy for Sustainable Development and the Covid-19 impact: a regional analysis. Aestimum, 82, 19–38. https://doi.org/10.36253/aestim-14374
Sachs, J. D., Lafortune, G., Fuller, G., & Drumm, E. (2023). Implementing the SDG Stimulus. Sustainable Development Report 2023. Dublin, Dublin University Press. https://doi.org/10.25546/102924
Saiu, V., Blečić, I., & Meloni, I. (2022). Making sustainability development goals (SDGs) operational at suburban level: potentials and limitations of neighbourhood sustainability assessment tools. Environmental Impact Assessment Review, 96, 106845.
Sánchez de Madariaga, I., García López, J., & Sisto, R. (2018). Mirando hacia el futuro: Ciudades sostenibles. Los Objetivos de Desarrollo Sostenible en 100 ciudades españolas. REDS, Red Española para el Desarrollo Sostenible, 2018. Available at: https://reds-sdsn.es/wp-content/uploads/2018/10/Informe-urbano-REDS-ODS-2018-parte-I.pdf (Accessed 15 January 2023).
Schmidt-Traub, G., Kroll, C., Teksoz, K., Durand-Delacre, D., & Sachs, J. D. (2017). National baselines for the sustainable development goals assessed in the SDG index and dashboards. Nature Geoscience, 10(8), 547–555.
Spearman, C. (1904). The proof and measurement of association between two things. American Journal of Psychology, 15, 72–101.
Stevens, C., & Kanie, N. (2016). The transformative potential of the sustainable development goals (SDGs). International Environmental Agreements, 16, 393–396.
UN General Assembly (2015). Transforming Our World: the 2030 Agenda for Sustainable Development. A/RES/70/1. 2015. Available at: https://www.refworld.org/docid/57b6e3e44.html (Accessed 7 December 2022).
United Nations Conference on Trade And Development, 2015. Investment Policy Framework For Sustainable Development. United Nations UNCTAD/WEB/DIAE/PCB/ 2015/3.
Xu, Z., Chau, S. N., Chen, X., Zhang, J., Li, Y., Dietz, T., Wang, J., Winkler, J. A., Fan, F., Huang, B., Li, S., Wu, S., Herzberger, A., Tang, Y., Hong, D., Li, Y., & Liu, J. (2020). Assessing progress towards sustainable development over space and time. Nature, 577(7788), 74–78. https://doi.org/10.1038/s41586-019-1846-3