Unleashing the hidden green value: assessing the impact of energy certification and environmental amenities on real estate through hedonic modelling
Department of Land, Environment, Agriculture and Forestry (TESAF), University of Padua, Italy
E-mail: carolina.bonardipellizzari@phd.unipd.it, tiziano.tempesta@unipd.it, cristiano.franceschinis@unipd.it, mara.thiene@unipd.it, daniel.vecchiato@unipd.it
*Corresponding author
Abstract. Rapid population growth and urbanization have intensified energy demand and climate vulnerability in cities, elevating the importance of urban green spaces and energy-efficient properties, which impact real estate values. This study uses a hedonic pricing model to assess how environmental amenities and energy efficiency influence property prices. We analysed sales contracts from 2022–2023 in Padua (Italy), enriched with spatial data on key environmental factors. Findings reveal a notable price premium associated with proximity to green spaces and waterways: for each hectare of park area, properties located within 100 m experience a 5.4% price increase, while each additional 100 meters from a waterway reduces apartment value by 3.7%. Additionally, apartments in energy class A or higher command a 30% higher price per square meter with respect to other energy classes. This research offers valuable insights into how urban green spaces and energy efficiency shape real estate values in rapidly urbanizing settings.
Keywords: building’s energy performance, hedonic model, urban environment.
JEL codes: Q49, Q51, R30.
Index
2.1. Valuation of environmental amenities in the housing market
2.2. Valuation of energy efficiency in the housing market
6. Conclusions and policy implications
The world’s population is three times larger than it was in the mid-twentieth century, growing from 2.5 billion in 1950 to 8 billion in 2022, and it is projected to reach up to 9.7 billion in 2050 (United Nations, 2022). Around 55% of this total currently lives in urban areas and this share is projected to reach 68% by 2050 (United Nations, 2019).
The increasing number of people in the cities coupled with the consequences of climate change, such as higher temperatures, floods, and excessive drought is increasing the vulnerability of the population living in urban areas (Ebi et al., 2021; Li et al., 2022). Some recent examples include the heatwaves in Europe that caused approximately 63 thousand deaths during the summer of 2022 and the floods of May 2023 in the Emilia Romagna region (Italy), which affected 100 municipalities with 23 rivers flooded and 1,000 landslides (Ballester et al., 2023; Priolo, 2023; Sabelli, 2023).
Urban green areas, for instance parks with natural elements such as trees, grass, and water bodies play an important role in the mitigation of climate change and improvement of social cohesion in cities (European Commission, 2019; Petzold and Mose, 2023). Urban greenery is known for improving not only physical and mental health (clean air, aesthetics, recreation, noise reduction, temperature regulation) but also improving biodiversity (creation of habitats) and economy (water infiltration, increase in real estate value of dwellings located near the green areas) (Campagnaro et al., 2020; Lungman et al., 2023; Ma et al., 2019; Tempesta, 2015).
In addition to these benefits, the need to spend time outdoors and reduce stress levels led to an appreciation of urban green areas, which became even more prominent after the COVID-19 pandemic. In some regions, the visitation to natural areas increased considerably during and after that period, especially those places near urban centres where access was easy and possible (da Schio et al., 2021; Grima et al., 2020; Sikorska et al., 2023). The increased demand for urban green areas is reflected in real estate transaction prices: studies using hedonic pricing models (HPM) (Rosen, 1974) in different countries show that properties located closer to an urban green area or a natural feature, such as a water body, present a price premium, whereas houses located in a polluted and noisy area tend to have a lower value (Cordera et al., 2019; Dell’Anna et al., 2022; Escobedo et al., 2015; Osland et al., 2022).
The Hedonic Pricing Model (HPM) posits that the price of a real estate asset is determined by its intrinsic and extrinsic characteristics. In this respect, the HPM provides a framework to measure the value of each characteristic directly influencing the price of a dwelling (Rosen, 1974), thus revealing the effects, among others, of environmental quality on house prices. More recently, the accessibility of public georeferenced data has facilitated the utilization of Geographic Information Systems (GIS tools) in generating more refined environmental variables for model inputs, including factors like the proximity of dwellings to green areas.
The amenities potentially influencing the price of a dwelling, however, are not just related to extrinsic factors such as accessibility (e.g. proximity to services, such as schools and supermarkets) and environmental quality (e.g. presence of green areas nearby and air quality), but also to intrinsic characteristics, such as its energy efficiency which is indicated in the Energy Performance Certificate (EPC). Initiatives related to energy efficiency have become even more important at the European Union (EU) level in recent decades due to its linkage to the climate goals set around carbon neutrality by 2050. Since buildings are responsible for 40% of EU energy consumption and 36% of energy-related greenhouse gas emissions, the EPC is an important policy tool towards a zero-emission economy (European Commission, 2021). The EPC was introduced to measure how energy efficient is a building, also in comparison to other buildings. First mentioned in the Energy Performance of Buildings Directive (EPBD) 2002/91/EC, it has become mandatory in the EU member states, which means that any building, house, or apartment must have an EPC at the moment of their sale/lease to inform potential buyers about the energy performance of the dwelling (European Parliament and Council of the European Union, 2002). The directive was revised in 2010 (Directive 2010/31/EU-Recast) and 2018 (Directive 2018/2002/EU) with increased standards, such as stating the EPC in advertisements of dwellings, mandatory targets of energy coming from renewable sources, minimum performances, and an increasing number of “zero energy buildings” (European Parliament and Council of the European Union, 2010, 2018). In 2024, the European Parliament approved the revised Energy Performance of Buildings Directive (EU/2024/1275) to align with the objectives of the European Green Deal and expedite the renovation of older buildings while acknowledging the differences among EU countries in terms of existing building stocks, geography, and climate. Member States will have until 29 May 2026 to incorporate its requirements into their national laws (European Parliament and Council of the European Union, 2024).
Even though there is a growing body of literature using hedonic models to estimate the effect of energy efficiency and environmental quality on housing prices, there are still conflicting results and a lack of studies tackling both aspects simultaneously. This is especially true in Italy, where only a few studies were found dealing either with energy efficiency or only with environmental quality (see Amrusch (2005); Bonetti et al. (2016); Copiello and Coletto (2023); Cordera et al. (2019); Fregonara et al. (2017); Guerri et al. (2022)). We argue that both attributes jointly influence housing demand. Including both in the same hedonic framework not only reflects the full set of environmental qualities valued by households but also allows us to disentangle private versus public pathways to sustainability, thereby offering a more holistic understanding of urban housing markets, avoiding omitted variable bias. A further aspect that deserves attention in the current literature is the fact that most of the studies that applied the HPM to analyse the effect of EPC on the real estate market in Italy used the dwellings’ asking prices instead of actual transactions. This is because obtaining real transaction data is challenging, as transaction prices are not readily accessible or publicly available in the country (Bisello et al., 2020; Manganelli et al., 2019). According to some authors (Kolbe et al., 2021), the use of asking prices instead of real transaction data, however, could lead to upward bias and large error variance in the estimates.
Considering the gaps in the current literature, the aim of this paper is twofold: i) to assess the effect on apartment prices of extrinsic factors, including environmental quality, and ii) to estimate the influence of energy efficiency (as measured by the EPC) and other intrinsic characteristics on apartment prices. The originality of this paper lies in i) the simultaneous analysis of the effect of both private (energy efficiency) and public (green amenities) environmental characteristics on property values, which offers guidance to both private actors and policymakers on where to focus resources for maximizing housing value and sustainability benefits; and ii) the use of transaction data from sales contracts instead of asking prices derived from real estate listings.
The paper is organized as follows: after a literature review in section 2, section 3 introduces the study area and the methodological steps of the hedonic modelling. In section 4, the results are reported along with their interpretation. The findings are discussed in section 5 and section 6 presents the conclusions of the study.
An extensive body of literature explores the relation between house prices and either environmental amenities or energy performance, presenting a notable expansion in number over time (Fregonara and Rubino, 2021; Schaeffer and Dissart, 2018). The HPM is one of the most employed methodologies for estimating these effects. In this section, we delve into the various environmental factors and energy performance indicators used in hedonic models documented in the literature.
2.1. Valuation of environmental amenities in the housing market
The effect of environmental amenities on the housing market has been investigated through hedonic models by researchers since the end of the last century. For instance, in the 1980s, by estimating hedonic models with 781 house sales in Boston (US), Li and Brown (1980) found that the higher the distance to river, ocean, or recreational area, the lower the price of houses. Additionally, the influence of environmental aspects on property prices has grown over time. In a study developed in Singapore, Teo et al. (2023) estimated that during the 1990s tree cover represented 9.2% of the sales price of an apartment unit; this increased to 10.9% during the 2000s; and 11.7% during the 2010s. The increasing appreciation of green urban areas was related to their decreasing quantity and quality over time.
The environmental quality in urban and peri-urban areas has been explored through different variables, such as air quality (Chay et al., 2005; Cordera et al., 2019; Franco and Cutter, 2022; Freeman et al., 2019; Hitaj et al., 2018), proximity to a water body (Anderson and Vahe, 2018; Bonetti et al., 2016; Dell’Anna et al., 2022; Sander and Haight, 2012; Schaerer et al., 2008), water quality (Bonetti et al., 2016; Moore et al., 2020), landscape composition (Allen Klaiber and Phaneuf, 2010; Luttik, 2000; Sander and Haight, 2012; Schaerer et al., 2008; Schläpfer et al., 2015), proximity to green areas (Anderson and Vahe, 2018; Conway et al., 2008; Dell’Anna et al., 2022; Franco and Macdonald, 2018; Łaszkiewicz et al., 2019; Osland et al., 2022; Panduro and Veie, 2013; Plant et al., 2017; Wu et al., 2022), view of green areas (Jim and Chen, 2006; Morancho, 2003; Panduro and Veie, 2013; Sander and Polasky, 2009; Wasson et al., 2013; Wu et al., 2022) and features of the green areas, such as size and shape (Anderson and Vahe, 2018; Conway et al., 2008; Franco and Macdonald, 2018; Liebelt et al., 2018; Shinozaki et al., 2019).
Focusing on examples of characteristics related to green urban areas, a study carried out in the United States identified that green parks’ size and proximity have a small but statistically significant effect on housing prices: the increase of 1% in park area results in the increase of house sales price by 0.03%, and a 1% decrease in distance from the park results in an increase of 0.016% in the sales price (Poudyal et al., 2009). Still in the US, another study found a positive effect of the presence of trees within the property, with its value increased by US$1,586 per tree present in the dwelling area (Escobedo et al., 2015). In Portugal, the tree canopy coverage in urban areas (Lisbon) also presented a positive effect on property prices, with a 0.20% increase in price from each squared kilometre increase in the relative size of the tree canopy, equal to approximately €400 per dwelling (Franco and Macdonald, 2018).
In terms of accessibility and size of green areas, a study in the UK showed that the presence of a small functioning green space within 200 meters of a property increases its price by 0.5%, and the greater the size of the green area, the greater the premium, reaching up to 1.4% (Anderson and Vahe, 2018). In Singapore, the distance to a park presented a negative effect on the price of dwellings, meaning the longer the distance from a park, the lower the property price, with an average house price reduction of USD 181.67 for one meter of increasing distance (Dell’Anna et al., 2022). Similar results were found in China, where a 1% improvement in accessibility to green parks results in a 1.6% increase in price and that properties with a higher percentage of green area within a 300 m radius have higher values, with each percentage point of green space adding 2.1% to the price per square meter (Kong et al., 2007). On the other hand, another study of house asking prices in China showed that the view of a green area is more important than its accessibility or size (Wu et al., 2022). In Norway, environmental amenities such as proximity to a lake, green park dominance, and ocean view showed a significant and positive effect on dwellings transaction prices, presenting premiums of 13.7%, 7.3%, and 3.8% respectively (Osland et al., 2022).
In Italy, more specifically in the city of Florence, Guerri et al. (2022) found that residential buildings with the highest values were in thermally neutral zones (outside of hotspots related to urban heat island), characterized by the presence of high green and blue infrastructure (tree cover and water bodies). In Milan, Borgoni et al. (2018) found that the size and proximity to green areas also showed a positive relation to housing prices. Only one study focused on the city of Padua using environmental quality aspects and spatial econometrics, but it focused on air quality and used listing prices from real estate agencies’ websites (Amrusch, 2005).
When it comes to the blue infrastructure, the literature shows that the size and proximity to a water body play a positive role in property price (Anderson and Vahe, 2018; Cohen et al., 2014; Luttik, 2000; Sander and Haight, 2012). Such a relation depends on the quality of the water. For example, Bonetti et al. (2016) found that in Milan the proximity to a canal was considered an amenity in heavily anthropic areas since it improves the environmental conditions, whereas the proximity to a stream has a negative effect on price, decreasing property value, due to the poor water quality of the streams located in the city.
2.2. Valuation of energy efficiency in the housing market
Studies show that at the global level, energy labels positively influence housing sales prices, with the mere presence of an energy label correlating to an average price premium of 4.2%, with the highest premium observed in North America (5.36%) (Cespedes-Lopez et al., 2019). Focusing on Europe, some differences between residential and commercial buildings, as well as between sales and rents emerged: for the price of residential buildings, an increase of 3-8% due to energy efficiency improvements was found, and for residential rents, the premium was of around 3-5%. The increase in prices is higher for commercial buildings, with premium prices over 10% and rental prices being positively affected by 2-5% (Zancanella et al., 2018).
At the country level, many studies showed a positive effect on housing prices deriving from more efficient EPC classes (Goel, 2023; Marmolejo-Duarte et al., 2020; Taruttis and Weber, 2022). On the other hand, some studies that also used hedonic models showed that EPC only modestly impacted listing prices (Fregonara et al., 2017; Marmolejo-Duarte and Chen, 2019) or did not affect price at all (Olaussen et al., 2017, 2021; Olaussen et al., 2019; Wilhelmsson, 2019).
In Italy, to the best of our knowledge, Fregonara et al. (2014) were the first to analyse EPC ratings’ influence on real estate. Focusing on the city of Torino, they used a sample of 577 buildings collected in 2012, the year that marked the beginning of the mandatory inclusion of EPC in advertisements of dwellings for sale in Italy. Results from the hedonic models showed a weak relationship between listing price and high energy efficiency levels. One of the explanations was that the potential buyers were not yet aware that a higher investment in energy-efficient houses meant lower maintenance costs in the future, and so this was not reflected by real estate agencies. Such a weak relationship was confirmed by Fregonara et al. (2017) in a subsequent study. More recently, however, according to Barreca et al. (2021), price premiums presented an increasing trend in Torino, with low EPC labels (E, F, and G) significantly and negatively affecting housing prices, while high EPC labels (B, A1, A2, A3, and A4) presented a smaller but positive influence on them.
Still in Northern Italy, more specifically in Bolzano, a premium of 6% was found for properties moving from the worst energy performance class (G) to the best (A) (Bisello et al., 2020). The authors used hedonic models based on 825 listing prices. Moving to Southern Italy, in the city of Bari, studies using transaction prices identified premiums from 27% to 29% in properties presenting EPC class A (Manganelli et al., 2019; Morano et al., 2020). The first study calculated the premium by comparing class A dwellings to those not belonging to class A whereas the second study compared class A dwellings to those belonging to class G. The lowest EPC (class G) presented a similar but negative effect (-27%) when compared to dwellings not belonging to this class (Morano et al., 2020). In Reggio Calabria, an evolutionary polynomial regression using a sample of 515 residential properties identified a premium of 41% on sale prices of properties presenting the highest energy performances (EPC class A or B) when compared to class G (Massimo et al., 2022).
Specifically in Padua, Copiello and Bonifaci (2015) not only found that EPC has a statistically significant influence on house prices, but that it can reach up to 22% of premium price if the dwelling is class A (the highest EPC), when compared to class G (the lowest EPC). More recently, Copiello and Coletto (2023), by using a spatial autoregressive model, found a price premium of 55% for dwellings of class A4 when compared to those of class D, class G in this case presented a 29% decrease in unit price when compared to class D.
In nonmarket valuation, the HPM is a key component of Revealed Preferences Methods (RPM), alongside the Travel Cost method, and is widely applied in real estate (Herath and Maier, 2010). RPM are grounded in the idea that the value of many environmental amenities or disamenities can be inferred from people’s purchasing decisions related to market goods. Observing real market choices enables the estimation of these values (Boyle, 2003). The HPM is theoretically underpinned by Rosen’s model (Rosen, 1974) and Lancaster’s consumer theory (Lancaster, 1966) and is used to estimate the value of a good or service by breaking it down into its constituent attributes.
This model is particularly useful in real estate markets, where the price of a dwelling is influenced by a combination of characteristics. These characteristics may encompass intrinsic attributes, which are those features directly related to the property itself (e.g., number of bedrooms, year of construction), and extrinsic attributes, which are beyond the property’s limits but still affect it (e.g. local school quality, proximity to amenities). Therefore, the price of the ith house can be modelled as a dependent variable of its characteristics:
(1)
where P is the rent or price of the house; I refers to property-related attributes (intrinsic characteristics); E refers to extrinsic characteristics (environmental and non-environmental); L refers locational variables (when a spatial model is applied) and; t is an indicator of time (Malpezzi et al., 2002). Equation (1) can then be specified as:
(2)
where K is a constant, ai is the regression coefficient, and xi is a characteristic of the dwelling. From an economic point of view, in the case of linear models, ai corresponds to the marginal price of each characteristic, that is the price increase determined by a unitary increase of the independent variable (Rosen, 1974). The linear regression in Equation (2) is commonly turned into a log-linear regression by taking the natural logarithm of the dependent variable (Equation (3)).
(3)
This is also the model specification we used in our study. In the case of continuous variables, it is possible to interpret the coefficients (ai) as the percentage change of the property price (P) due to marginal changes in the independent variables (xi), while in the case of discrete or dichotomous variables the percentage change of P can be calculated as follows (Halvorsen and Palmquist, 1980):
(4)
The study area being considered is the municipality of Padua, located in the Veneto region, north-eastern Italy. Padua is located approximately 35 km west of Veneto’s capital Venice (Figure 1) and covers an area of 93 km2 with a population of 206,500 inhabitants (ISTAT, 2011, 2023). Padua is the capital of the most densely populated province in the region of Veneto: the homonymous province presents an average of 429.7 inhabitants per km2 (ISTAT, 2011).
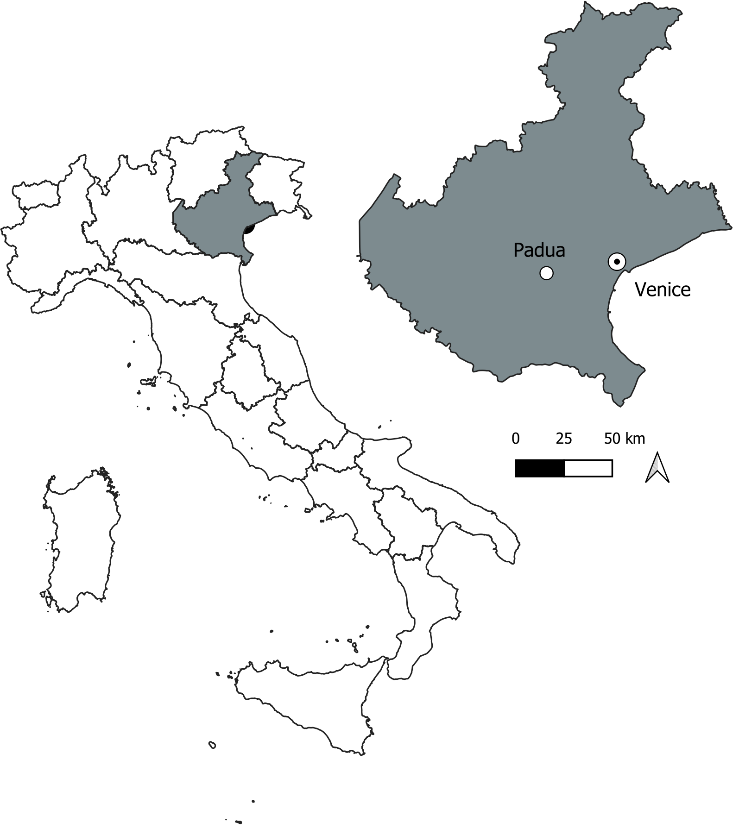
Padua is geographically situated within an alluvial plain area, between two relatively large rivers: the Brenta and the Bacchiglione (Comune di Padova, 2004). The city is characterized by a sub-continental climate, marked by a minimum average temperature of 1°C in January, a maximum average temperature of 30°C in July, and annual average precipitation of 913 mm, based on data spanning the period 1994-2022 (ARPAV, 2023).
The transaction data of apartments in Padua was obtained through the Italian Revenue Agency (Agenzia delle Entrate) web portal, which contains sale contracts that were officially registered by the Agency. The selected transaction period was from July 2022 to February 2023. To minimize the influence of inflation and other economic factors on property values, we opted for a relatively short sales period. At the same time, we ensured the selected timeframe provided a sufficient number of observations for robust analysis. The data collection resulted in a dataset of 398 transactions; however, only 321 were complete and suitable for the data analysis, since in some contracts there was missing information on some characteristics needed for the model. Of this total, only 222 were in the “apartment” category. Only apartments were considered since it would not be correct to compare different goods (e.g. houses, commercial buildings, attics, etc.). Among the different types of buildings, we chose to focus on apartments, as they are by far the most common type of dwelling in the city.
While 222 observations might appear limited, this sample size is considered appropriate when analyzing transaction data in a medium-sized Italian town, given the challenges in obtaining such data. In Italy, transaction data is neither readily accessible nor publicly available. To collect this information, one must register with the Italian Revenue Agency and manually download individual sales contracts in PDF format. Data are then extracted analyzing each sale contract “manually”, and this procedure is highly time consuming. Furthermore, a large quota of the analyzed contracts are usually dismissed, due to partial sales (only a quota of the ownership of the building is being sold), or because the object of the transaction is not suitable for the research (transactions of garages or commercial buildings for example). In contrast, asking prices are significantly easier to collect. However, as previously introduced, relying on asking prices instead of actual transaction data can introduce upward bias and greater error variance in estimates. This is because sellers often list properties at prices much higher than their eventual sale price. Additionally, sellers and realtors may overestimate the influence of certain variables on property prices, further compounding biases.
Along with the transaction price (€/m2) of apartments in Padua - the dependent variable - the predictors are listed in Table 1 and Table 2. The majority of the variables presented in Table 1 and Table 2 are self-explanatory, but some need further details. The “Energy class” represents a dummy variable indicating (value 1) if the EPC equals to A (namely A1, A2, A3, A4), while it assumes value 0 for all other classes (B, C, D, E, F, and G). “Elevator” is a dummy variable assuming value 1 if the elevator is present and 0 if it is absent, while “Mediation” assumes value 1 if the transaction was mediated by a real estate agency. As mentioned in section 3.1, a semi-log model was preferred, enabling a direct interpretation of percentage variations in price resulting from unit changes in the independent variables.
| Variable | Levels | N | Percent | ||||||||||||||||
|---|---|---|---|---|---|---|---|---|---|---|---|---|---|---|---|---|---|---|---|
| Energy class A* | 222 | ||||||||||||||||||
| 0 | B, C, D, E, F, G | 201 | 91% | ||||||||||||||||
| 1 | A, or greater | 21 | 9% | ||||||||||||||||
| Elevator | 222 | ||||||||||||||||||
| 0 | absent | 124 | 56% | ||||||||||||||||
| 1 | present | 98 | 44% | ||||||||||||||||
| Mediation** | 222 | ||||||||||||||||||
| 0 | absent | 92 | 41% | ||||||||||||||||
| 1 | present | 130 | 59% | ||||||||||||||||
| * Dummy indicating EPC class A (A1, A2, A3, A4) value = 1, other classes (B, C, D, E, F and G) value = 0. | |||||||||||||||||||
| ** Whether the transaction was mediated by a real estate agency. | |||||||||||||||||||
| Variable | Unit | N | Min | Q1 | Median | Mean | Q3 | Max | SD* | ||||||||||
|---|---|---|---|---|---|---|---|---|---|---|---|---|---|---|---|---|---|---|---|
| Price | € | 222 | 27,300 | 105,000 | 140,000 | 212,527.1 | 247,500 | 935,000 | 178,987.5 | ||||||||||
| Unit price | €/m2 | 222 | 380.2 | 1,140.6 | 1,746.4 | 1,999.9 | 2,597.4 | 5,252.8 | 1,071 | ||||||||||
| Apartment surface | m2 | 222 | 28 | 75.2 | 97 | 105.3 | 124 | 434 | 52.8 | ||||||||||
| Age of the apartment | years | 222 | 1 | 30.5 | 53 | 52.6 | 63 | 173 | 30.4 | ||||||||||
| Year in which the heating system was installed | years | 222 | 1915 | 2002 | 2009 | 2007.6 | 2015 | 2023 | 11.3 | ||||||||||
| Bathrooms number | number | 222 | 1 | 1 | 1 | 1.3 | 1 | 4 | 0.5 | ||||||||||
| Train station distance (Km) | Km | 222 | 0.4 | 1.3 | 2 | 2.4 | 3.1 | 5.5 | 1.3 | ||||||||||
| Number of schools within a radius of 200 m | number | 222 | 0 | 0 | 0 | 0.2 | 0 | 2 | 0.4 | ||||||||||
| Number of supermarkets within a radius of 200 m | number | 222 | 0 | 0 | 0 | 0.4 | 1 | 4 | 0.8 | ||||||||||
| Waterway distance (Km) | Km | 222 | 0 | 0.2 | 0.4 | 0.5 | 0.7 | 1.4 | 0.4 | ||||||||||
| Urban parks area (ha) within a radius of 100 m | ha | 222 | 0 | 0 | 0 | 0.6 | 0.6 | 6.8 | 1.4 | ||||||||||
| Urban parks area (ha) between 100 and 200 m | ha | 222 | 0 | 0 | 0 | 0.6 | 0.6 | 6.8 | 1.5 | ||||||||||
| * SD = Standard Deviation. | |||||||||||||||||||
Our data source, the sale contracts, includes details on the transaction price of the apartment, its address, cadastral information, surface, blueprint, EPC, year of construction, presence and age of the heating system, and other contract specifications (e.g. personal information of the buyer(s) and the seller(s)), which characterized the intrinsic factors to feed the hedonic regression. By extracting the cadastral data found in the contract of each apartment, it was possible to enrich the transaction database by retrieving the geographic coordinates through the online application Formaps (https://www.formaps.it/), which was crucial for spatial analysis. By importing the coordinates of each property into a GIS platform (QGIS software version 3.28.1), additional variables were generated for each building, thus characterizing the extrinsic factors, namely: i) the Euclidean distance from the property to the train station; ii) number of schools within a radius of 200 m; iii) number of supermarkets within a radius of 200 m; iv) urban parks area within a radius of 100 m; v) urban parks area between 100 and 200 m; and vi) the Euclidean distance of each apartment to the nearest waterway. The distances were measured in meters, and the area was measured in square meters. The buffer considered, namely a 200 m radius, was chosen based on the average distance between properties and urban parks, which was of 181 meters.
The location of supermarkets, train station, schools, and waterways, was collected through the “Quick OSM” plugin in QGIS. The geoinformation on the different land uses, including urban parks, was downloaded from the geoportal of the Veneto Region (https://idt2.regione.veneto.it/).
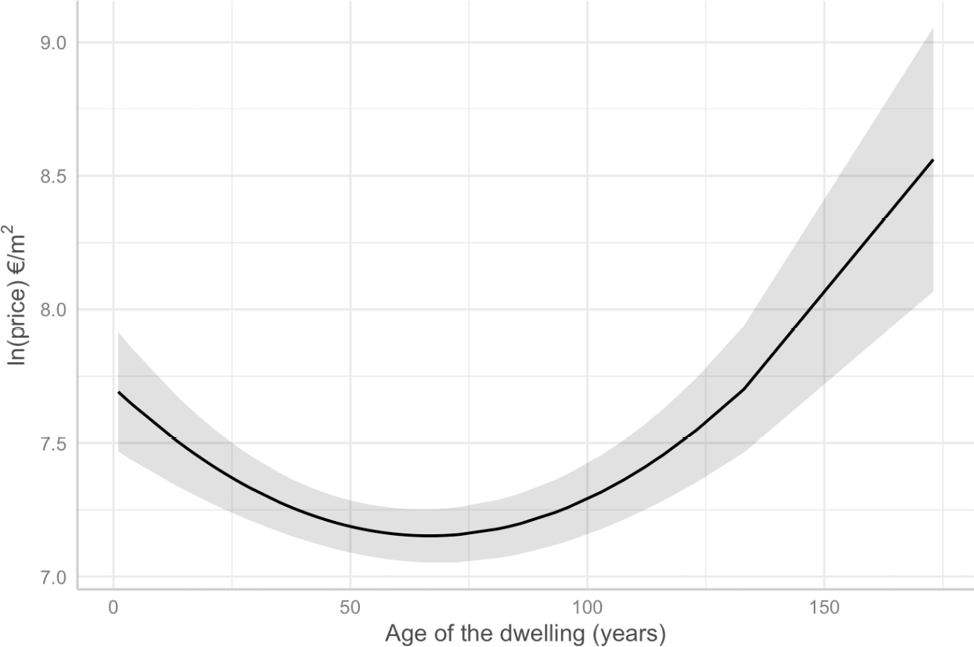
The age of the buildings was modelled in a parabolic fashion, to take into account that typically both historical and newer buildings have a positive effect on the transaction price. More specifically, the parabolic relation between price and age implies that the older (historical) or newer (with highest comfort and better energy performances) the dwelling the higher the price (Figure 2).
Once all the variables were generated, the hedonic models were analysed using R version 4.2.3. The goodness-of-fit of the models was obtained by conducting the F-test, adjusted R-Squared test on common OLS models. To avoid collinearity, variables presenting a Pearson correlation coefficient superior to 0.5 were removed from the models. We also checked for the existence of overall multicollinearity by measuring the variance inflation factor (VIF).
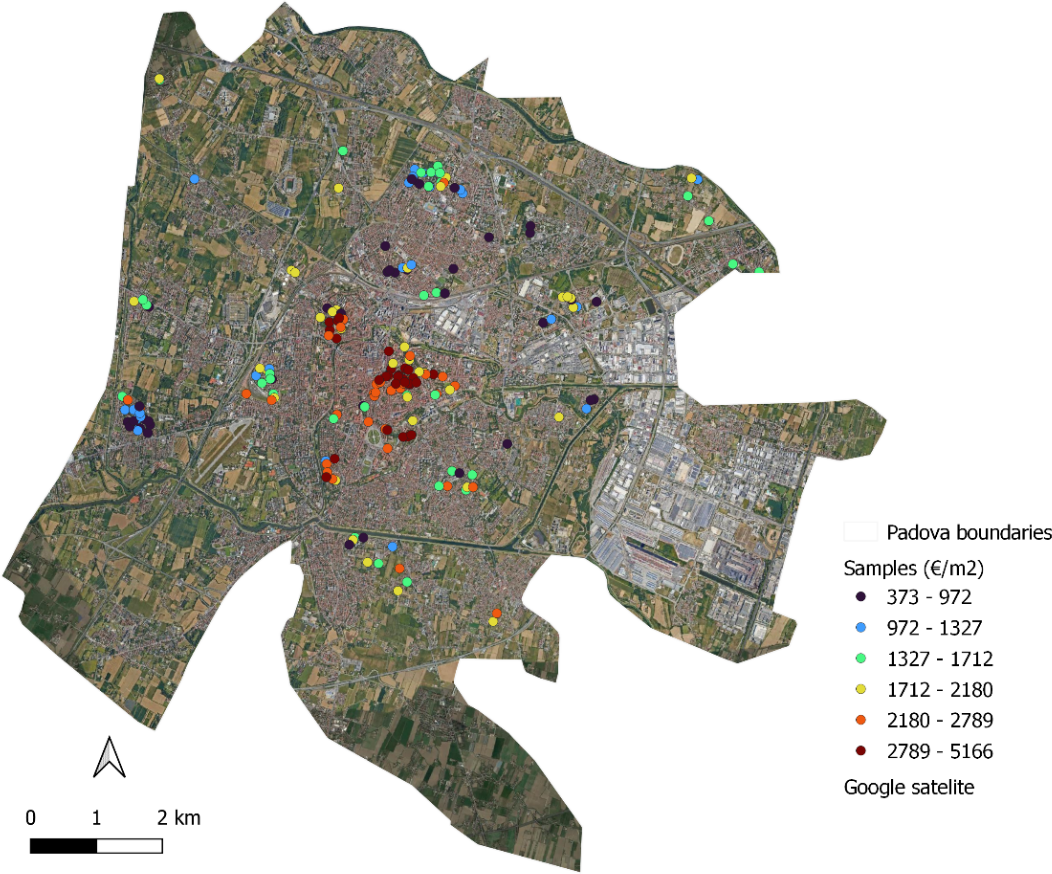
The 222 apartments found in the sales contracts for the selected period are distributed throughout Padua as illustrated in Figure 3. Notably, apartments exhibiting higher values (depicted in red) are concentrated in the city centre, while those in blue and green hues, indicating lower values, are situated at greater distances from the city centre. The observations were distributed across different areas of the city, with a slight concentration in the city centre. This reflects the reality of the local real estate market, as the city centre typically exhibits a more dynamic real estate market. Additionally, the peripheral areas of Padua are predominantly characterized by rural and industrial activities, with few to no apartments present. As a result, no transactions were recorded in those areas during the selected period.
The model results (Table 3) were estimated by using the 222 apartment sales in Padua, with the logarithm of unit transaction price in €/m2 serving as the dependent variable as described in Equation (3). Only independent variables that were significant with at least 90% probability were included in the model. There are no collinearity phenomena in the model (VIF < 2) with the sole exception of age and age squared.
| Variables | Coefficients | p-value | Price (€/m2) % variation |
||||||||||||||||
|---|---|---|---|---|---|---|---|---|---|---|---|---|---|---|---|---|---|---|---|
| Constant | -5.651 | ||||||||||||||||||
| Apartment surface (m2) | -0.00347 | **** | -0.34 | ||||||||||||||||
| Energy class A | 0.265 | ** | 30.34° | ||||||||||||||||
| Age of the apartment | -0.0166 | **** | |||||||||||||||||
| Squared age of the apartment | 0.000125 | **** | |||||||||||||||||
| Year in which the heating system was installed | 0.00691 | *** | 0.69 | ||||||||||||||||
| Bathrooms number | 0.173 | *** | 17.35 | ||||||||||||||||
| Elevator | 0.161 | **** | 17.42° | ||||||||||||||||
| Train station distance (Km) | -0.123 | ** | -12.32 | ||||||||||||||||
| Number of schools within a radius 200 m | 0.122 | ** | 12.18 | ||||||||||||||||
| Number of supermarkets within a radius 200 m | 0.0965 | *** | 9.65 | ||||||||||||||||
| Urban parks area (ha) within a radius of 100 m | 0. 0541 | *** | 5.41 | ||||||||||||||||
| Urban parks area (ha) between 100 and 200 m | 0. 0393 | ** | 3.93 | ||||||||||||||||
| Waterway distance (Km) | -0. 366 | **** | -36.6 | ||||||||||||||||
| Mediation | 0.11860 | ** | 12.59° | ||||||||||||||||
| Observations = 222 / R-squared = 0.551 / Adjusted R-squared = 0.521 / St. Error of the model = 0.378. | |||||||||||||||||||
| ° Calculated using Equation (4). | |||||||||||||||||||
| Note: * p<0.10, ** p<0.05, *** p<0.01, **** p<0.001. | |||||||||||||||||||
Regarding the intrinsic characteristics of the apartments, the model highlights that the price per square meter decreases as the surface area increases. Every additional square meter of surface decreases the price by 0.34%. Additionally, the presence of two bathrooms and a lift is significant, and they both increase the price per square meter by 17%.
Estimating the impact of energy class on price is complex due to potential collinearity issues, as recently built apartments typically belong to the highest energy classes. However, the energy class is in some ways a proxy for the age of the property and therefore, by omitting this last characteristic, the effect of the energy class can be overestimated. From the estimated model in which the age of the property is inserted, it emerges that: (i) apartments belonging to energy class A or greater increase the price per square meter by 30 %. We reduced the energy classes in the model to two classes (>=A, all other classes) because in further exploratory analyses we found that apartments belonging to other energy classes did not have a statistically significant effect on the price.
As to the effect of age, it is interesting to note that in the city of Padua this variable presents a parabolic trend (Figure 2 and Table 3). Including both the linear and squared terms allows us to account for the possibility that price does not decline uniformly with age. Instead, the relationship may follow a U-shaped curve (Figure 2), where price initially decreases with age (captured by the negative linear coefficient in Table 3), but beyond a certain point, the effect of age becomes less negative or even slightly positive (captured by the positive squared term in Table 3). This pattern can reflect architectural or historical value in older buildings, or improvements made over time. More specifically, it causes the price of the property to decrease until the age of 67, after which the price per square meter increases. It can be deduced that, at least generally, the oldest properties built before the Second World War are more appreciated by the market for their architectural characteristics or for their location closer to the city centre.
The last intrinsic characteristic analyzed, the year of installation of the heating system, presented a positive effect on the price, regardless of the energy class to which it belongs (0.69% for each additional year).
Regarding the extrinsic non-environmental characteristics, the model highlights that proximity to some services increases the price of the property. The price decreases by 1.23% as the distance from the train station increases by 100 m. The number of schools within 200 m increases the unit price by 12.2% and the number of supermarkets by 9.6%. These estimates align with the urban income theory, which posits that the willingness to pay for a property also depends on future costs associated with accessing the diverse range of essential services.
Concerning the environmental characteristics, two variables are significantly correlated to the price: the area occupied by urban parks within a radius of 100 m and from 100 to 200 m and the distance from waterways. When it comes to the urban parks variable, it should be noted that their effect is statistically significant up to a distance of 200 m. It can also be seen how the effect decreases as the distance of public greenery from the home increases: one hectare of park located less than 100 m from the home increases the price by 5.4%, this premium drops to 3.9% for parks placed at a distance between 100 and 200 m. The distance from waterways also has a significant effect on the price of houses: for every additional 100 m of distance from the waterway, the apartment price is reduced by 3.7%.
Finally, the model demonstrates that a subjective characteristic unrelated to the property itself or the provision of economic, social, and environmental services can influence house prices. Specifically, when an apartment was sold through a real estate agency (mediation), the premium was on average 12.6% higher. This could be due to Italian legislation, which mandates that the price declared in the sales deed must match the actual price paid if a real estate agent is involved. Alternatively, it is possible that real estate agents are able to increase the sales price or that they predominantly handle higher-priced properties, resulting in a higher average unit price.
From the analysis of the transaction contracts and geospatial data, some clues regarding the effect of environmental characteristics on property prices have emerged. The findings indicate a statistically significant influence of both energy efficiency and extrinsic environmental factors on apartment prices in Padua, represented by price premiums.
First, the price premium of 30% found for best-performing apartments (EPC=A) is consistent with the literature which has been showing the increased importance of energy performance on real estate. The estimated price premium found in this study is somewhat similar to the one of Massimo et al. (2022) in the Italian municipality of Reggio Calabria where a 41.5% premium was found for residential properties presenting EPC A or B compared to other energy classes. Using an intermediary baseline (EPC=D) in the same city explored in the present study, Copiello and Coletto (2023) found a premium price of 55% for apartments belonging to EPC=A4 and a decrease of 29% for those with EPC=G. Price premiums were also found in other parts of Italy, such as in the municipality of Bolzano, where a premium of 6% was found for properties moving from the worst energy performance class (G) to the best (A) (Bisello et al., 2020). In Bari, studies using transaction prices identified premiums from 27% to 29.41% in properties presenting EPC>A (Manganelli et al., 2019; Morano et al., 2020) and a decrease of 27% for the worst-performing dwellings (EPC=G) (Morano et al., 2020).
In the context of examining the influence of energy performance on the real estate market, a relevant observation arising from our study is the correlation identified between the apartment’s age and its EPC rating. Within our sample, newly built apartments exhibit superior energy performance, introducing the potential for contrasting conclusions. Divergent approaches exist in the literature: some studies incorporate both age and EPC in their models (e.g. Barreca et al. (2021); Manganelli et al. (2019); Morano et al. (2020)), while others opt for a singular variable, with EPC serving as a proxy for additional factors such as a building’s age or simply because other attributes are not significantly affecting price (see Bisello et al. (2020); Copiello and Coletto (2023); Massimo et al. (2022)). Certain authors consider this correlation problematic, as omitting variables correlated to the EPC may lead to overlooking the impact of the selected variable on price (Olaussen et al., 2017).
Regarding extrinsic environmental variables, our findings suggest a positive effect of the proximity to water, illustrated by a 3.7% decrease in price for every additional 100 meters from the waterway, which aligns with the research of Bonetti et al. (2016) who identified an even stronger price decrease in Milan (Italy), of 7.4% for houses for an additional meter of distance from the canal. Taking into consideration the effect of blue spaces in general, our findings are somewhat aligned with Anderson and Vahe (2018), who identified a premium price of 0.9% for those properties located within 200 m from a small blue space in the UK. In the Netherlands, a 1.91% discount in price was found for properties located 25-50 m from the nearest water when compared to properties located less than 25 m away and the discount increased to -4.04% for properties positioned 200-400 m from the nearest water body (Koster, 2022). Another study in the Netherlands estimated a premium price of 7% for a house located within 1000 m from a lake, and this premium got up to 28% if the house was by the lake with a nice view (Luttik, 2000).
Finally, the effect of green urban areas is evidenced in our results by a 5.4% premium for an additional hectare of urban park located within 100 m of the apartment (and 3.9% for a distance between 100 and 200 m) aligns with existing literature regarding size and proximity of green features. The positive correlation between the size of the closest green parks and property value has been consistently supported by various studies. For instance, an additional 1% of green space within 500 m of apartments in Poland increased the sale price by 3.95 PLN per square meter (Czembrowski and Kronenberg, 2016). Similarly, in Finland, an additional 1 km in the distance to the nearest forested area resulted in a decrease of 5.9% in the price of the dwelling (Tyrväinen and Miettinen, 2000). In Costa Rica, Piaggio (2021) reported a 4% premium price for each additional 1% increase in size of the closest neighborhood park. Similarly to our findings, the authors also observed that distance alone was not a significant factor in their study area, as there were numerous parks within walking distance. Poudyal et al. (2009) in the United States identified that both the proximity and size of green parks impact property price. They found that a 1% increase in the park area corresponded to a 0.03% increase in house sales price, and a 1% decrease in distance from the park resulted in a 0.016% increase in the sales price. In the UK Anderson and Vahe (2018) demonstrated that the presence of a small functioning green space within 200 meters of a property led to a 0.5% increase in price, with larger green areas presenting greater premiums, reaching up to 1.4%. Parallel findings were observed in China, where a 1% improvement in accessibility to green parks results in a 1.6% increase in price and that properties with a higher percentage of green area within a 300 m radius have higher values, with each percentage point of green space adding 2.1% to the price per square meter (Kong et al., 2007).
6. Conclusions and policy implications
This article empirically tested whether EPC labels and extrinsic environmental characteristics affect housing transaction prices in the Italian city of Padua. By using a dataset composed of 222 sales contracts from July 2022 to February 2023, we estimated the influence of these various features through a hedonic pricing model.
Based on this sample, EPC labels influence the price of apartments, with a price premium for the best-performing ones (EPC = A or greater). The Energy Performance of Buildings Directive stands as the principal policy tool within the European Union for achieving energy efficiency goals, and since higher EPC labels indicate better energy performance, thus lower energy consumption and compliance with net zero emissions, this research serves as evidence that better energy performance is being capitalized to increased property price, which can motivate investors in renewing old buildings and developing new ones with EPC labels A, especially with the recast of the EPBD in 2024.
When it comes to environmental aspects, the small but significant effect of both the area occupied by urban parks and proximity to waterway on apartment price suggests that they are perceived as environmental amenities and are capitalized in the real estate market. This serves as indicators for various stakeholders, such as urban planners and investors, signaling the potential benefits of enhancing existing green spaces, investing in new ones, and developing residences within convenient walking distances from these amenities. The findings also represent empirical evidence that water presents value beyond its direct use for drinking and agricultural purposes, representing aesthetic and recreational resources to urban residents.
The limitations of this study stem from its reliance on sales contracts obtained from the Italian Revenue Agency. Although this approach avoided the biases often associated with asking prices, it resulted in a smaller sample size and lacked detailed information on intrinsic property characteristics, such as condition or renovation status, which are not present in sales contracts in the country. While the reduced sample size may increase variance in the estimates, and the absence of certain variables could impact model accuracy or introduce bias, the findings reveal meaningful relationships that provide a strong foundation for future research. Building on these results, future studies could incorporate more detailed property data to further enhance the robustness and precision of the model, offering even greater insights into price determinants. Additionally, as a suggestion for future research, considering the potential interaction among variables found in the regression analyses, further exploration through spatial models is recommended.
Allen Klaiber, H., & Phaneuf, D. J. (2010). Valuing open space in a residential sorting model of the Twin Cities. Journal of Environmental Economics and Management, 60(2), 57–77. https://doi.org/10.1016/j.jeem.2010.05.002
Amrusch, P. (2005). The impact of urban traffic and environmental conditions on the housing market: an analysis of Italian and Slovenian urban areas. WIT Transactions on The Built Environment, 77, 809–816. https://www.witpress.com/Secure/elibrary/papers/UT05/UT05078FU.pdf
Anderson, H., & Vahe, N. (2018). Estimating the impact urban green space has on property price. Available at: https://www.ons.gov.uk/economy/nationalaccounts/uksectoraccounts/compendium/economicreview/july2018/estimatingtheimpacturbangreenspacehasonpropertyprice#:~:text=The%20greater%20the%20size%20of,in%20property%20price%20of%201.4%25 (Accessed 17 January 2023).
ARPAV. (2023). Variabili meteorologiche. Available at: https://www.arpa.veneto.it/dati-ambientali/open-data/file-e-allegati/trend_variabili_meteorologiche.zip (Accessed 24 March 2023).
Ballester, J., Quijal-Zamorano, M., Méndez Turrubiates, R. F., Pegenaute, F., Herrmann, F. R., Robine, J. M., Basagaña, X., Tonne, C., Antó, J. M., & Achebak, H. (2023). Heat-related mortality in Europe during the summer of 2022. Nature Medicine, 29(7), 1857–1866. https://doi.org/10.1038/s41591-023-02419-z
Barreca, A., Fregonara, E., & Rolando, D. (2021). EPC labels and building features: spatial implications over housing prices. Sustainability, 13(5), 2838. https://doi.org/10.3390/su13052838
Bisello, A., Antoniucci, V., & Marella, G. (2020). Measuring the price premium of energy efficiency: a two-step analysis in the Italian housing market. Energy and Buildings, 208, 109670. https://doi.org/10.1016/j.enbuild.2019.109670
Bonetti, F., Corsi, S., Orsi, L., & De Noni, I. (2016). Canals vs. streams: to what extent do water quality and proximity affect real estate values? A hedonic approach analysis. Water, 8(12), 577. https://doi.org/10.3390/w8120577
Borgoni, R., Michelangeli, A., & Pontarollo, N. (2018). The value of culture to urban housing markets. Regional Studies, 52(12), 1672–1683. https://doi.org/10.1080/00343404.2018.1444271
Boyle, K. J. (2003). A Primer on Nonmarket Valuation. Dordrecht, Kluwer Academic Publishers.
Campagnaro, T., Vecchiato, D., Arnberger, A., Celegato, R., Da Re, R., Rizzetto, R., Semenzato, P., Sitzia, T., Tempesta, T., & Cattaneo, D. (2020). General, stress relief and perceived safety preferences for green spaces in the historic city of Padua (Italy). Urban Forestry & Urban Greening, 52, 126695. https://doi.org/10.1016/j.ufug.2020.126695
Cespedes-Lopez, M. F., Mora-Garcia, R. T., Perez-Sanchez, V. R., & Perez-Sanchez, J. C. (2019). Meta-analysis of price premiums in housing with energy performance certificates (EPC). Sustainability, 11(22), 6303. https://doi.org/10.3390/su11226303
Chay, K., Xa, Y, & Greenstone, M. (2005). Does air quality matter? Evidence from the housing market. Journal of Political Economy, 113(2), 376–424. https://doi.org/10.1086/427462
Cohen, J. P., Cromley, R. G., & Banach, K. T. (2014). Are homes near water bodies and wetlands worth more or less? An analysis of housing prices in one Connecticut town. Growth and Change, 46(1), 114–132. https://doi.org/10.1111/grow.12073
Comune di Padova. (2004). Padova: città d’acque. Available at: https://www.padovanet.it/sites/default/files/attachment/C_1_Allegati_1116_Allegato.pdf (Accessed 24 March 2023).
Conway, D., Li, C. Q., Wolch, J., Kahle, C., & Jerrett, M. (2008). A Spatial Autocorrelation Approach For Examining The Effects Of Urban Greenspace On Residential Property Values. The Journal of Real Estate Finance and Economics, 41(2), 150–169. https://doi.org/10.1007/s11146-008-9159-6
Copiello, S., & Bonifaci, P. (2015). Price premium for buildings energy efficiency: empirical findings from a hedonic model. Valori e Valutazioni, 14, 5–15. https://www.researchgate.net/publication/280141865
Copiello, S., & Coletto, S. (2023). The price premium in green buildings: a spatial autoregressive model and a multi-criteria optimization approach. Buildings, 13(2), 276. https://doi.org/10.3390/buildings13020276
Cordera, R., Chiarazzo, V., Ottomanelli, M., dell’Olio, L., & Ibeas, A. (2019). The impact of undesirable externalities on residential property values: spatial regressive models and an empirical study. Transport Policy, 80, 177–187. https://doi.org/10.1016/j.tranpol.2018.04.010
Czembrowski, P., & Kronenberg, J. (2016). Hedonic pricing and different urban green space types and sizes: Insights into the discussion on valuing ecosystem services. Landscape and Urban Planning, 146, 11–19. https://doi.org/10.1016/j.landurbplan.2015.10.005
da Schio, N., Phillips, A., Fransen, K., Wolff, M., Haase, D., Ostoić, S. K., Živojinović, I., Vuletić, D., Derks, J., Davies, C., Lafortezza, R., Roitsch, D., Winkel, G., & De Vreese, R. (2021). The impact of the COVID-19 pandemic on the use of and attitudes towards urban forests and green spaces: Exploring the instigators of change in Belgium. Urban Forestry and Urban Greening, 65, 127305. https://doi.org/10.1016/j.ufug.2021.127305
Dell’Anna, F., Bravi, M., & Bottero, M. (2022). Urban Green infrastructures: How much did they affect property prices in Singapore? Urban Forestry and Urban Greening, 68, 127475. https://doi.org/10.1016/j.ufug.2022.127475
Ebi, K. L., Vanos, J., Baldwin, J. W., Bell, J. E., Hondula, D. M., Errett, N. A., Hayes, K., Reid, C. E., Saha, S., Spector, J., & Berry, P. (2021). Extreme weather and climate change: population health and health system implications. Annual Review of Public Health, 42(1), 293–315. https://doi.org/10.1146/annurev-publhealth-012420-105026
Escobedo, F. J., Adams, D. C., & Timilsina, N. (2015). Urban forest structure effects on property value. Ecosystem Services, 12, 209–217. https://doi.org/10.1016/j.ecoser.2014.05.002
European Parliament and Council of the European Union. (2002). Directive 2002/91/EC of the European Parliament and of the Council of 16 December 2002 on the energy performance of buildings. Official Journal of the European Communities, L 1, 65–71. Available at: https://eur-lex.europa.eu/legal-content/EN/TXT/?uri=celex%3A32002L0091 (Accessed 10 January 2023).
European Parliament and Council of the European Union. (2010). Directive 2010/31/EU of the European Parliament and of the Council of 19 May 2010 on the energy performance of buildings (recast). Official Journal of the European Union, L 153, 13–35. Available at: https://eur-lex.europa.eu/eli/dir/2010/31/oj/eng (Accessed 10 January 2023).
European Parliament and Council of the European Union. (2018). Directive (EU) 2018/2002 of the European Parliament and of the Council of 11 December 2018 amending Directive 2012/27/EU on energy efficiency. Official Journal of the European Union, L 328, 210–230. Available at: https://eur-lex.europa.eu/legal-content/EN/TXT/?uri=uriserv%3AOJ.L_.2018.328.01.0210.01.ENG (Accessed 10 January 2023).
European Commission. (2019). Guidance on a strategic framework for further supporting the deployment of EU-level green and blue infrastructure. Available at: https://environment.ec.europa.eu/topics/nature-and-biodiversity/green-infrastructure_en (Accessed 11 January 2023).
European Commission (2021). Making our homes and buildings fit for a greener future. Available at: https://ec.europa.eu/commission/presscorner/api/files/attachment/869476/Buildings_Factsheet_EN_final.pdf (Accessed 11 January 2023).
European Parliament and Council of the European Union. (2024). Directive (EU) 2024/1275 of the European Parliament and of the Council of 24 April 2024 on the energy performance of buildings (recast). Official Journal of the European Union. Available at: http://data.europa.eu/eli/dir/2024/1275/oj (Accessed 09 July 2024).
Franco, S. F., & Cutter, W. B. (2022). The determinants of non-residential real estate values with special reference to environmental local amenities. Ecological Economics, 201, 107485. https://doi.org/10.1016/j.ecolecon.2022.107485
Franco, S. F., & Macdonald, J. L. (2018). Measurement and valuation of urban greenness: remote sensing and hedonic applications to Lisbon, Portugal. Regional Science and Urban Economics, 72, 156–180. https://doi.org/10.1016/j.regsciurbeco.2017.03.002
Freeman, R., Liang, W., Song, R., & Timmins, C. (2019). Willingness to pay for clean air in China. Journal of Environmental Economics and Management, 94, 188–216. https://doi.org/10.1016/j.jeem.2019.01.005
Fregonara, E., Rolando, D., & Semeraro, P. (2017). Energy performance certificates in the Turin real estate market. Journal of European Real Estate Research, 10(2), 149–169. https://doi.org/10.1108/jerer-05-2016-0022
Fregonara, E., Rolando, D., Semeraro, P., & Vella, M. (2014). The impact of Energy Performance Certificate level on house listing prices. First evidence from Italian real estate. Aestimum, 65, 143–163. https://doi.org/10.13128/Aestimum-15459
Fregonara, E., & Rubino, I. (2021). Buildings’ energy performance, green attributes and real estate prices: methodological perspectives from the European literature. Aestimum, 79, 43–73. https://doi.org/10.36253/aestim-10785
Goel, M. (2023). Do homeowners care about sustainability? Social Science Research Network, 1–89. https://doi.org/http://dx.doi.org/10.2139/ssrn.4340288
Grima, N., Corcoran, W., Hill-James, C., Langton, B., Sommer, H., & Fisher, B. (2020). The importance of urban natural areas and urban ecosystem services during the COVID- 19 pandemic. PLoS ONE, 15(12). https://doi.org/10.1371/journal.pone.0243344
Guerri, G., Crisci, A., Cresci, I., Congedo, L., Munafò, M., & Morabito, M. (2022). Residential buildings real estate values linked to summer surface thermal anomaly patterns and urban features: a Florence (Italy) case study. Sustainability, 14(14), 8412. https://doi.org/10.3390/su14148412
Halvorsen, R., & Palmquist, R. (1980). The interpretation of dummy variables in semilogarithmic equations. The American Economic Review, 70, 474–475. http://www.jstor.org/stable/1805237
Herath, S., & Maier, G. (2010). The hedonic price method in real estate and housing market research: a review of the literature review of the literature. Available at: https://www-sre.wu.ac.at/sre-disc/sre-disc-2010_03.pdf (Accessed 10 January 2023).
Hitaj, C., Lynch, L., McConnell, K. E., & Tra, C. I. (2018). The value of ozone air quality improvements to renters: evidence from apartment building transactions in Los Angeles County. Ecological Economics, 146, 706–721. https://doi.org/10.1016/j.ecolecon.2017.12.022
ISTAT. (2011). Principali statistiche geografiche sui comuni. Available at: https://www.istat.it/it/archivio/156224 (Accessed 23 March 2023).
ISTAT. (2023). Bilancio demografico mensile. Available at: https://demo.istat.it/app/?l=it&a=2023&i=D7B (Accessed 23 March 2023).
Jim, C. Y., & Chen, W. Y. (2006). Impacts of urban environmental elements on residential housing prices in Guangzhou (China). Landscape and Urban Planning, 78(4), 422–434. https://doi.org/10.1016/j.landurbplan.2005.12.003
Kolbe, J., Schulz, R., Wersing, M., & Werwatz, A. (2021). Real estate listings and their usefulness for hedonic regressions. Empirical Economics, 61(6), 3239–3269. https://doi.org/10.1007/s00181-020-01992-3
Kong, F., Yin, H., & Nakagoshi, N. (2007). Using GIS and landscape metrics in the hedonic price modeling of the amenity value of urban green space: a case study in Jinan City, China. Landscape and Urban Planning, 79(3), 240–252. https://doi.org/10.1016/j.landurbplan.2006.02.013
Koster, J. (2022). Proximity to water and residential property values: evidence from the Netherlands. Master Thesis, University of Groningen. https://frw.studenttheses.ub.rug.nl/id/eprint/4043
Lancaster, K. J. (1966). A new approach to consumer theory. Journal of Political Economy, 74(2), 132. https://doi.org/10.1086/259131
Łaszkiewicz, E., Czembrowski, P., & Kronenberg, J. (2019). Can proximity to urban green spaces be considered a luxury? Classifying a non-tradable good with the use of hedonic pricing method. Ecological Economics, 161, 237–247. https://doi.org/10.1016/j.ecolecon.2019.03.025
Li, M. M., & Brown, H. J. (1980). Micro-neighborhood externalities and hedonic housing prices. Land Economics, 56(2), 125-141. https://doi.org/10.2307/3145857
Li, X., Stringer, L. C., & Dallimer, M. (2022). The impacts of urbanisation and climate change on the urban thermal environment in Africa. Climate, 10(11), 164. https://doi.org/10.3390/cli10110164
Liebelt, V., Bartke, S., & Schwarz, N. (2018). Revealing preferences for urban green spaces: a scale-sensitive hedonic pricing analysis for the city of Leipzig. Ecological Economics, 146, 536–548. https://doi.org/10.1016/j.ecolecon.2017.12.006
Lungman, T., Cirach, M., Marando, F., Pereira Barboza, E., Khomenko, S., Masselot, P., Quijal-Zamorano, M., Mueller, N., Gasparrini, A., Urquiza, J., Heris, M., Thondoo, M., & Nieuwenhuijsen, M. (2023). Cooling cities through urban green infrastructure: a health impact assessment of European cities. Lancet, 401(10376), 577–589. https://doi.org/10.1016/S0140-6736(22)02585-5
Luttik, J. (2000). The value of trees, water and open space as reflected by house prices in the Netherlands. Landscape and Urban Planning, 48, 161–167. https://doi.org/10.1016/S0169-2046(00)00039-6
Ma, B., Zhou, T., Lei, S., Wen, Y., & Htun, T. T. (2019). Effects of urban green spaces on residents’ well-being. Environment, Development and Sustainability, 21(6), 2793–2809. https://doi.org/10.1007/s10668-018-0161-8
Malpezzi, S., Gibb, K., & O’Sullivan, A. (2002). Hedonic pricing models: a selective and applied review. Available at: http://www.bus.wisc.edu/realestate (Accessed 10 January 2023).
Manganelli, B., Morano, P., Tajani, F., & Salvo, F. (2019). Affordability assessment of energy-efficient building construction in Italy. Sustainability, 11(1), 249. https://doi.org/10.3390/su11010249
Marmolejo-Duarte, C., & Chen, A. (2019). The uneven price impact of energy efficiency ratings on housing segments and implications for public policy and private markets. Sustainability, 11(2), 372. https://doi.org/10.3390/su11020372
Marmolejo-Duarte, C., Chen, A., & Bravi, M. (2020). Spatial implications of EPC rankings over residential prices. In Mondini, G., Oppio, A., Stanghellini, S., Bottero, M., & Abastante, F. (Eds). Values and Functions for Future Cities. Cham, Springer, pp. 51–71. https://doi.org/10.1007/978-3-030-23786-8_4
Massimo, D. E., De Paola, P., Musolino, M., Malerba, A., & Del Giudice, F. P. (2022). Green and gold buildings? Detecting real estate market premium for green buildings through evolutionary polynomial regression. Buildings, 12(5), 621. https://doi.org/10.3390/buildings12050621
Moore, M. R., Doubek, J. P., Xu, H., & Cardinale, B. J. (2020). Hedonic price estimates of lake water quality: valued attribute, instrumental variables, and ecological-economic benefits. Ecological Economics, 176, 106692. https://doi.org/10.1016/j.ecolecon.2020.106692
Morancho, A. B. (2003). A hedonic valuation of urban green areas. Landscape and Urban Planning, 66(1), 35–41. https://doi.org/10.1016/s0169-2046(03)00093-8
Morano, P., Rosato, P., Tajani, F., & Di Liddo, F. (2020). An analysis of the energy efficiency impacts on the residential property prices in the city of Bari (Italy). In Mondini, G., Oppio, A., Stanghellini, S., Bottero, M., & Abastante, F. (Eds). Values and Functions for Future Cities. Cham, Springer, pp. 73–88. https://doi.org/10.1007/978-3-030-23786-8_5
Olaussen, J. O., Oust, A., & Solstad, J. T. (2017). Energy performance certificates – Informing the informed or the indifferent? Energy Policy, 111, 246–254. https://doi.org/10.1016/j.enpol.2017.09.029
Olaussen, J. O., Oust, A., & Solstad, J. T. (2021). Real estate price formation: energy performance certificates and the role of real estate agents. Journal of Sustainable Real Estate, 13(1), 1–11. https://doi.org/10.1080/19498276.2021.2006875
Olaussen, J. O., Oust, A., Solstad, J. T., & Kristiansen, L. (2019). Energy performance certificates – the role of the energy price. Energies, 12(18), 3563. https://doi.org/10.3390/en12183563
Osland, L., Östh, J., & Nordvik, V. (2022). House price valuation of environmental amenities: an application of GIS-derived data. Regional Science Policy and Practice, 14(4), 939–959. https://doi.org/10.1111/rsp3.12382
Panduro, T. E., & Veie, K. L. (2013). Classification and valuation of urban green spaces – A hedonic house price valuation. Landscape and Urban Planning, 120, 119–128. https://doi.org/10.1016/j.landurbplan.2013.08.009
Petzold, J., & Mose, L. (2023). Urban Greening as a Response to Climate-Related Heat Risk: A Social-Geographical Review. Sustainability, 15(6), 4996.
Piaggio, M. (2021). The value of public urban green spaces: Measuring the effects of proximity to and size of urban green spaces on housing market values in San José, Costa Rica. Land Use Policy, 109, 105656. https://doi.org/10.1016/j.landusepol.2021.105656
Plant, L., Rambaldi, A., & Sipe, N. (2017). Evaluating revealed preferences for street tree cover targets: a business case for collaborative investment in leafier streetscapes in Brisbane, Australia. Ecological Economics, 134, 238–249. https://doi.org/10.1016/j.ecolecon.2016.12.026
Poudyal, N. C., Hodges, D. G., & Merrett, C. D. (2009). A hedonic analysis of the demand for and benefits of urban recreation parks. Land Use Policy, 26(4), 975–983. https://doi.org/10.1016/j.landusepol.2008.11.008
Priolo, I. (2023). Alluvione, “un evento epocale, mai accaduto prima nel Paese”. Available at: https://www.regione.emilia-romagna.it/notizie/2023/maggio/alluvione-relazione-priolo (Accessed 25 May 2023).
Rosen, S. (1974). Hedonic prices and implicit markets: product differentiation in pure competition. Journal of Political Economy, 82(1), 34–55. https://doi.org/10.1086/260169
Sabelli, C. (2023). Il ruolo del cambiamento climatico nelle alluvioni in Emilia-Romagna. Available at: https://doi.org/10.1038/d43978-023-00083-y
Sander, H. A., & Haight, R. G. (2012). Estimating the economic value of cultural ecosystem services in an urbanizing area using hedonic pricing. Journal of Environmental Management, 113, 194–205. https://doi.org/10.1016/j.jenvman.2012.08.031
Sander, H. A., & Polasky, S. (2009). The value of views and open space: estimates from a hedonic pricing model for Ramsey County, Minnesota, USA. Land Use Policy, 26(3), 837–845. https://doi.org/10.1016/j.landusepol.2008.10.009
Schaeffer, Y., & Dissart, J. C. (2018). Natural and environmental amenities: a review of definitions, measures and issues. Ecological Economics, 146, 475–496. https://doi.org/10.1016/j.ecolecon.2017.12.001
Schaerer, C., Baranzini, A., Ramirez, J. V., & Thalmann, P. (2008). Using the hedonic approach to value natural land uses in an urban area: an application to Geneva and Zurich. Économie publique/Public economics (20), 147–167. https://doi.org/10.4000/economiepublique.7332
Schläpfer, F., Waltert, F., Segura, L., & Kienast, F. (2015). Valuation of landscape amenities: a hedonic pricing analysis of housing rents in urban, suburban and periurban Switzerland. Landscape and Urban Planning, 141, 24–40. https://doi.org/10.1016/j.landurbplan.2015.04.007
Shinozaki, T., Tanabe, H., Fujiwara, K., & Yokoo, N. (2019). The influence of environmental factors on housing transaction price in local cities in Japan. IOP Conf. Series: Earth and Environmental Science, 294, 1–8. https://doi.org/10.1088/1755-1315/294/1/012023
Sikorska, D., Wojnowska-Heciak, M., Heciak, J., Bukowska, J., Łaszkiewicz, E., Hopkins, R. J., & Sikorski, P. (2023). Rethinking urban green spaces for urban resilience. Do green spaces need adaptation to meet public post-covid expectations? Urban Forestry and Urban Greening, 80, 127838. https://doi.org/10.1016/j.ufug.2023.127838
Taruttis, L., & Weber, C. (2022). Estimating the impact of energy efficiency on housing prices in Germany: does regional disparity matter? Energy Economics, 105, 105750. https://doi.org/10.1016/j.eneco.2021.105750
Tempesta, T. (2015). Benefits and costs of urban parks: a review. Aestimum, 67, 127–143. https://doi.org/10.13128/Aestimum-17943
Teo, H. C., Fung, T. K., Song, X. P., Belcher, R. N., Siman, K., Chan, I. Z. W., & Koh, L. P. (2023). Increasing contribution of urban greenery to residential real estate valuation over time. Sustainable Cities and Society, 96, 104689. https://doi.org/10.1016/j.scs.2023.104689
Tyrväinen, L., & Miettinen, A. (2000). Property Prices and Urban Forest Amenities. Journal of Environmental Economics and Management, 39(2), 205–223. https://doi.org/10.1006/jeem.1999.1097
United Nations. (2019). World Urbanization Prospects The 2018 Revision. Available at: https://population.un.org/wup/assets/WUP2018-Report.pdf (Accessed 24 March 2023).
United Nations. (2022). World Population Prospects 2022: Summary of Results. https://www.un.org/development/desa/pd/sites/www.un.org.development.desa.pd/files/wpp2022_summary_of_results.pdf (Accessed 24 March 2023).
Wasson, J. R., McLeod, D. M., Bastian, C. T., & Rashford, B. S. (2013). The effects of environmental amenities on agricultural land values. Land Economics, 89, 466–478. https://www.jstor.org/stable/24243720
Wilhelmsson, M. (2019). Energy performance certificates and its capitalization in housing values in Sweden. Sustainability, 11(21), 6101. https://doi.org/10.3390/su11216101
Wu, C., Du, Y., Li, S., Liu, P., & Ye, X. (2022). Does visual contact with green space impact housing pricesʔ An integrated approach of machine learning and hedonic modeling based on the perception of green space. Land Use Policy, 115, 106048. https://doi.org/10.1016/j.landusepol.2022.106048
Zancanella, P., Bertoldi, P., & Bertoldi, P. (2018). Energy efficiency, the value of buildings and the payment default risk. EUR 29471 EN, Publications Office of the European Union, Luxembourg, JRC113215. https://doi.org/10.2760/267367