https://doi.org/10.36253/aestim-17653
Received: April 1, 2025; Accepted: May 26, 2025; Published: September 11, 2026
Assessing places’ liveability: informational entropy for the construction of a set of criteria and indicators
1Department of Architecture, University of Florence, Italy
2Department of Planning, Design, Architecture Technology, Sapienza University of Rome, Italy
E-mail: fabrizio.battisti@unifi.it, orazio.campo@uniroma1.it, melania.perdono@unifi.it
*Corresponding author
Abstract. The growing interest in well-being as a quality-of-life paradigm has led to a critical revision of its traditional conception. It is no longer limited to indicators of material prosperity and physical health (objective well-being indicators) but also individual perceptions of quality of life and happiness (subjective well-being indicators). In this new conception, the living environment plays a key role. The definition of well-being indicators based on the perceptual assessments of an urban environment crucially requires interdisciplinary skills. Using an investigative approach based on informational entropy, the objective of this paper is to construct a taxonomy that allows for the assessment of the quality of an environment to achieve adequate well-being standards and thus the improvement of quality of life. In detail, the article explains the methodological process to define a structured set of criteria, sub-criteria, and their associated indicators for evaluating the characteristics of an urban environment and the physical and functional variables that contribute to achieving specific well-being thresholds. Through the involvement of a significant sample of 100 subjects, the results of the work consist of a set of 132 sub-criteria for the assessment of liveability.
Keywords: wellbeing, liveability, informational entropy.
Contents
2.1 Well-being and liveability (or residential well-being)
2.2 The measurement of liveability at the international level
2.3 Informational entropy and detection of stated preferences
3.1 De-structuring of the 4 international indices
EIU: The Global Liveability Index
3.2 The recomposition of the set of criteria, sub-criteria and indicators
4. Experimentation and results
4.1 Weighting by informational entropy (applied to surveys)
5. Discussions and conclusions
1. Introduction
Some epochal changes and events have affected the world in recent years, such as globalization, the technological and digital revolution, increasing urbanization, pandemics, and climate uncertainties. This has led to rethinking the concept of well-being, no longer associated exclusively with indicators of material prosperity and physical health (objective well-being indicators), but rather related to individual perceptions of quality of life and happiness (subjective well-being indicators).
In Europe, over the past ten years and beyond, there has been a growing focus on the so-called “Economy of Wellbeing”. In this framework, well-being and quality of life are no longer analyzed and evaluated through traditional, objective economic indicators, such as gross domestic product (GDP) or the level of infrastructure of an area (services). Instead, holistic, subjective well-being indicators, linked to personal perceptions, aimed at better incorporating the dimensions that influence citizens’ quality of life (Varotto, 2019; Battisti, 2023), are adopted. Thus, in the most recent EU guidelines (see Personal and Social Well-Being from European Social Survey (ESS) Round 6) (European Social Survey, 2018), the concept of well-being is now unstructured and multidimensional (Bartolini and Bilancini, 2010); among the components affecting well-being, the community in which one lives, and thus the place, plays a key role. The idea that economic growth was the best way to maximize well-being has now been superseded (Layard, 2005a; Bartolini and Bilancini, 2010; Easterlin, 2013; European Commission, 2018). Instead, it is now recognized that the well-being of individuals is linked to the ability to create, or choose, an environment that allows them to realize their full potential and enjoy their fundamental rights (Āzena and Keiss, 2009; International Labour Organization, 2019; United Nations, 2015; World Bank Group, 2019). Particular emphasis is therefore placed on the liveability of territories.
In the scientific literature, liveability refers to similar concepts with different nuances: it can be defined as “suitability to human life” (Merriam-Webster, 2018), “quality of life, well-being, and happiness” (Veenhoven, 2000), “quality of place and its synonyms” (Burton, 2014). The concept of liveability is thus closely interdependent with that of well-being, being summarized as perceived well-being within a place, dependent on objective factors (characterizing the place) but also subjective factors (related to individuals’ perception).
Hence, the relationship between individuals’ well-being and place becomes a subject of scientific interest, not least in light of the momentous changes that have had a relevant impact on human life in recent years, among which is the digital revolution that has led to the digital transition, in particular.
The digital transition can be described as an overhaul of administrative, work, business, and even recreational practices, using digital technologies to make them more efficient while achieving easier and more accessible data collection and evaluation. Indeed, in this society undergoing a digital transition, more and more functions and services are being performed through computer networks and computers. This has changed habits, ways of working, and the use of leisure time (OECD, 2019).
The repercussions of the digital transition on the territory have begun to be studied, mainly focusing on the immaterial transfer of services that were historically delivered physically, and the impact of this change on mobility (traffic) and the reuse of buildings that have lost their original use. There are almost no studies on the impacts of the digital transition on residential mobility, well-being, and liveability of places. Online citizen services, e-commerce, social networks, and new modes of social relations, but especially “smart working”, can indeed significantly affect the type and quality of people’s lives and affect “residential mobility”.
Smart working, which potentially affects more than 15 million workers in Italy (employees in the service sector, according to ISTAT data) (ISTAT, 2021), expanded rapidly between 2020 and 2021 due to the COVID-19 pandemic and has demonstrated non-negligible merits, such as reduced management costs for employers, reduced time and costs dedicated to home-to-work commuting, and thus reduced environmental pollution. In some cases, this has even triggered repopulation phenomena in previously underpopulated or abandoned areas (Acampa and Pino, 2024).
This change is epochal, considering that it is taking place for the first time in modern human history; traditional “home-to-work” distance constraints, which have profoundly influenced people’s choice of living places since at least the 18th century, are superseded. This is even more significant, considering that they have not been effectively overcome even by the technological advancement of means of transportation, and represents a relevant factor in the study of mobility (Acampa et al., 2024).
While considering that the choice of where to live depends on various and heterogeneous factors (home ownership, social relationships, family history, and personal preferences), the opportunities offered by the digital transition can still expand the opportunities for choosing the place (i.e., the social, economic, and environmental context) where to spend one’s life, seeking liveability to increase one’s well-being.
This article is part of a Research Project of Relevant National Interest (PRIN; Italian: Progetto di Ricerca di Rilevante Interesse Nazionale) approved and funded by the Ministry of University and Research (MUR), entitled “Housing mobility and digital transition. Evaluation tools and technologies for understanding current and future people’s living needs, supporting territorial governance and regeneration processes”. It stands as a prodromal study and investigation activity for understanding the demographic phenomenon of residential mobility, which significantly affects urbanization dynamics. These affect land use and protection, urban regeneration, and also partly energy policies and housing access, which are relevant themes in the National Recovery and Resilience Plan (NRRP). In particular, the article presents some initial results of the aforementioned research, meeting the following objectives: i) understanding the concept of well-being in its multidimensional meaning, the meaning of liveability and how these two ideas interconnect, as well as examining the main indices of liveability; ii) proposing a procedure for the construction and weighting of a set of criteria, sub-criteria, and indicators for the assessment of liveability of a given area; iii) testing the procedure for the construction of a weighted taxonomy for evaluating the liveability of a place, as well as for defining benchmarks for assessing liveability levels.
Next, the literature review in Section 2 focuses on the multidimensional analysis of the change in the concept of well-being, proposing an in-depth look into the concept of liveability and how it is measured at the international level, analyzing the 4 main reports worldwide (Global Liveability Index; Global Power City Index; Innovation Cities Index; Smart City Index); Section 2 also illustrates the method of informational entropy, which aims to ensure proper weighting of criteria and sub-criteria.
Following the literature review, Section 3 defines the set of criteria, sub-criteria, and indicators for liveability assessment, proposing a hybrid approach based on the interaction between informational entropy and the detection of preferences stated through traditional social research tools. Informational entropy, first proposed by Shannon in 1948 and gradually introduced into many scientific fields, is used to explore the degree of order of a system, here initially represented by the items in the abovementioned indices. Thus, this hybrid approach consists of 3 consequential steps: i) de-structuring of the 4 international indices; ii) taxonomic re-aggregation of the liveability factors; iii) weighting of the taxonomy through informational entropy.
This procedure allowed defining and weighting a set of 132 sub-criteria (sub-criteria and indicators, subdivided into 13 thematic categories or criteria), using a sample of 100 interviews. The results are discussed in Section 4; in Section 5, the conclusions of the present work are drawn, and limitations and future improvements are identified.
2. Materials and methods
It is now generally acknowledged that GDP alone does not provide a complete picture of people’s well-being (Layard, 2005b; Bartolini and Bilancini, 2010; Easterlin, 2013). In the past, economic growth has been considered a priority for maximizing societal well-being; however, to date, the direct correlation between economic growth and perceived well-being of citizens is low and/or negligible, even at average levels of wealth. Indeed, there is evidence that in developed countries, increased economic prosperity may even be associated with increased rates of depression, divorce, and suicide (Helliwell, 2007). Following these deductions, it is clear that well-being is closely related to contextual conditions (place), and thus to the objective and subjective factors that characterize it (liveability). Based on the above, a literature review on the multidimensional concept of well-being and liveability is proposed to respond to the first objective of this article. This is followed by an analysis of the main indices for measuring liveability in the international arena to construct a taxonomy on the liveability conditions of a territory. Finally, the hybrid-type approach based on the interaction between informational entropy and preferences stated through traditional social research tools for the construction and weighting of the taxonomy is illustrated.
2.1 Well-being and liveability (or residential well-being)
The concept of well-being has been a hot topic in the analysis of quality of life throughout the world’s territories since the second half of the 20th century (Larson, 1978; Veenhoven and Ehrhardt, 1995). For a long time, it was believed that the well-being of a population was linked to income and therefore to the GDP of its country (Blanchard et al., 2016), the economist Easterlin developed the “happiness paradox” in 1974. He argued that the increase in income and material well-being of a society does not produce a directly proportional increase in people’s happiness (Easterlin, 1974).
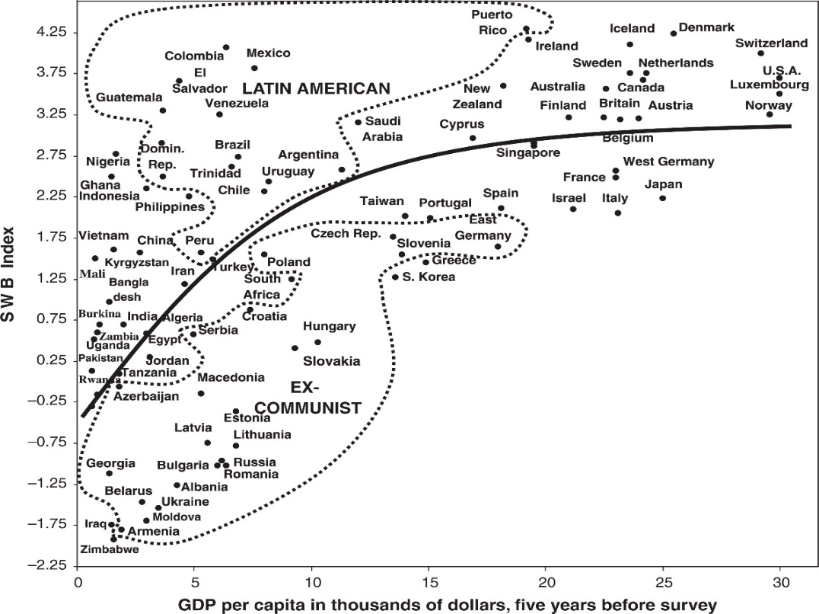
This theory was later confirmed by Inglehart and Klingemann (2000): they compared a plurality of countries at a defined point in time, as a function of their respective per capita income. This showed a positive correlation for the happiness index up to an income threshold of about $15,000; then, the values appear more dispersed, and the relationship between income and happiness stabilizes, as evidenced by the flat regression line (Fig. 1) (Inglehart and Klingemann, 2000).
However, the results of such studies were not new; the psychologist Maslow, as early as the 1950s, had intuited the nondependence between wealth and well-being. A founder of humanistic psychology, he is known for his “hierarchy of needs” theory (Maslow, 1954), which analyzes the factors affecting individuals in their pursuit of happiness and subjective well-being. According to this theory, human needs are hierarchized in a five-level pyramid, as follows (from bottom to top): physiological, safety, love, esteem, and self-actualization (Fig. 2).
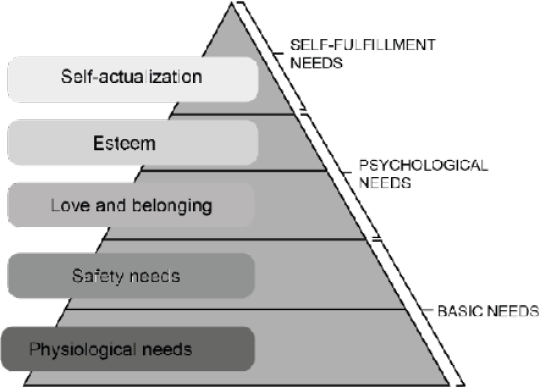
The theory exposes the limitations inherent in the use of money: the latter allows for the complete satisfaction of basic needs, while it fulfills social or self-related needs to a limited or even no extent. It follows that, regarding high standards of living, money will play an increasingly marginal role in one’s definition of well-being and happiness.
These reflections show that well-being depends on heterogeneous and complex factors and cannot be separated from its context, i.e., from liveability (Cummins, 2000; Jeffrey et al., 2018; Sen, 1999).
The liveability of an area is defined as a function that correlates environmental characteristics (objective and intrinsic) and personal characteristics (subjective, social, and place attachment) (Pacione, 1990; Ahmed et al., 2019). To date, the concept of “liveability” is widely debated and difficult to understand, as there can be multiple interpretations of it. To express the concept of “liveability”, the field of urban planning often uses the terms “quality of life” and “well-being”, which are sometimes substituted for each other. Although they are interrelated, liveability directly refers to a place and its conditions: it indicates the presence and quality of services in built and natural environments (Ahmed et al., 2019). It is highly dependent on the prevailing context and values within the community, whether they are economic, social, or cultural (Okulicz-Kozaryn and Valente, 2018; Viviani, 2016). Consequently, it can be said that a resident’s desire for a place determines the degree of liveability of that place (de Chazal, 2010; Lyndhurst, 2004).
Liveability, and thus residential well-being, can thus be positively and negatively affected by numerous factors, which we attempt to summarize below: spatial characteristics (architectural and urban design); human and social characteristics (population and type of social relations); functional characteristics (available services); contextual characteristics (lifestyle, pollution/health, maintenance, and care) (Bonaiuto et al., 2015; Bonaiuto and Alves, 2012). Citizens’ experience within their neighborhood appears to be influenced by its physical characteristics (Amérigo and Aragonés, 1990). When analyzing spatial characteristics, housing type, for example, appears to significantly affect housing well-being: the presence of single-family houses is associated with a higher level of well-being than townhouses or condominiums (Evans et al., 2003; Freeman, 1984). Spatial distances within the neighborhood have a direct impact on social interactions as well as safety (Abass and Tucker, 2018; Abu-Ghazzeh, 1999). In addition, people who live in well-designed environments that provide comfort, safety, and good air quality tend to have higher life satisfaction and lower levels of psychological stress (Evans, 2003). Moreover, the availability of shared public services (social characteristics) facilitates social connectedness, particularly if they have good location and visibility. (Francis et al., 2012). The presence of urban green spaces (contextual characteristics) is relevant to residential well-being, too. This term covers heterogeneous places, such as parks, community gardens, cemeteries, roof gardens, vertical gardens, lawns, street trees, and small green structures designed as green infrastructure. A growing body of research highlights the relationship between urban green spaces (UGS) and various dimensions of well-being (Syamili et al., 2023; Maas et al., 2006). These are just a few of the factors that contribute to the liveability of a place; field studies show that the correspondence between characteristics of the environment and the activities of people must be studied through a holistic and integrated system to obtain practical indications and guidelines for improvement interventions (Battisti et al., 2017; Bonaiuto et al., 2009).
In the European context, the assessment of residential well-being to date is a widely debated topic due to changing habits and lifestyles (ISTAT, 2024; United Nations, 2015; Gössling et al., 2012). For example, the Covid-19 pandemic accelerated the digitization process by several years, giving digital technologies a central role in daily life and giving rise to a new era of digital transition (Melluso et al., 2020). Traditional processes of innovation and development have been enhanced, and new forms of innovation have been created, concerning every segment of society. The detachment from the workplace and the online availability of many services (e-commerce, online citizen services, etc.) have enabled users to improve their lifestyles by decreasing their time schedules and thus fostering self-care. Moreover, these factors have set the stage for potential decentralization from urban centers, where most workplaces, businesses, services, etc., are located (Felici et al., 2022). In this context, measuring liveability becomes a matter of scientific interest and requires an approach that is as shared and objective as possible.
2.2 The measurement of liveability at the international level
In the early 2000s, various studies and analyses were already being conducted regarding liveability in various urban settings. These have generated international initiatives involving leading bodies, such as the Organisation for Economic Co-operation and Development (OECD) and the United Nations (UN). The latter has actively participated in the debate on the measurement of well-being by presenting concrete proposals, such as, respectively, the “Better Life Index” and the “17 Sustainable Development Goals”, defined by the UN and applied by all member countries (Speroni, 2019). To monitor well-being, various experiments have been developed in recent years, including the Global Liveability Index, the Global Power City Index, the Innovation Cities Index, and the Smart City Index. These analyses, which are summarized in annual reports, use concrete, reliable, and measurable indicators and also consider several factors that comprehensively describe the multidimensionality of urban liveability and well-being. Therefore, these approaches, of recognized relevance and validity in the international arena, are useful for the taxonomic definition of criteria and indicators for assessing liveability.
Global Liveability Index
The Global Liveability Index is an annual ranking published by the Economist Intelligence Unit (EIU, a division of The Economist Group), which evaluates the quality of life in 173 global cities. The methodology adopted for this evaluation is based on the integration of qualitative and quantitative indicators for a detailed and complex analysis focused on critical elements such as the quality of public services, personal safety, and the resilience of urban infrastructure (Economist Intelligence Unit, 2023). Data collected annually show how political stability and social security are determinants of a city’s quality of life, followed by factors such as the quality of infrastructure and access to educational services (OECD, 2021).
Global Power City Index
The Global Power City Index (GPCI) is an index developed by The Mori Memorial Foundation’s Institute for Urban Strategies. It rates and ranks the world’s major cities based on their “magnetism”, or ability to attract international people, capital, and businesses (The Mori Memorial Foundation, 2023). The index is coordinated by an Executive Committee, which includes a diverse group of experts from various disciplinary backgrounds, and an Operating Committee dedicated to detailed and meticulous analysis of the collected data. To ensure the objectivity and credibility of the classifications, the GPCI is also supported by external auditors. These professionals verify the accuracy and integrity of the data collected and provide advice and recommendations for possible improvements to the index. The GPCI’s aim is not limited to simply ranking cities: it provides an in-depth analysis of their strengths and areas of vulnerability and identifies emerging challenges facing global cities.
This index measures urban magnetism across six key functions: Economy, Research and Development, Cultural Interaction, Liveability, Environment, and Accessibility, offering a multidimensional and comprehensive view of urban competitiveness.
Innovation Cities Index
The Innovation Cities Index is an index developed by 2Thinknow within the Innovation Cities Program to rank cities based on their ability to foster innovation and competitiveness through technological, economic, and cultural factors. This index focuses mainly on aspects of digital connectivity, the presence of innovation infrastructure, the quality of education, and the ability to attract talent to measure how well cities can stimulate and host innovative initiatives. It aims to provide a solid and comparable basis for analyzing cities’ innovative capabilities, enabling analysts and decision makers to identify strengths, areas for improvement, and opportunities for targeted interventions.
Smart City Index
The Smart City Index, created by the IMD World Competitiveness Center in association with World Smart Sustainable Cities Organization (WeGO), an international consortium involving local government entities, is designed to act as a practical tool in the field of urban planning and management, emphasizing the importance of city perceptions through targeted surveys (IMD, 2023). Surveys are essential for understanding specific cities; therefore, questions are carefully worded to reflect the unique context of each city analyzed. For editions through 2021, the index relied on national Human Development Index (HDI) data provided by the United Nations Development Programme (UNDP) to integrate the perceptions collected with objective development indicators. Then, in 2022, the adoption of HDI data collected at the city level was experimented with to obtain a finer and more accurate understanding of city-specific socioeconomic conditions. This transition to more localized data aims to strengthen the accuracy of the index, enabling a more direct and meaningful assessment of the effectiveness of smart city policies and urban quality of life.
2.3 Informational entropy and detection of stated preferences
As already anticipated, the proposed study involves the definition of a set of criteria, sub-criteria and indicators to assess the liveability of a place. Following an analytical analysis of the above-mentioned international measurement methods followed by their de-structuring (Section 3.1) and subsequent taxonomic recomposition (Section 3.2), the selected sub-criteria are weighted through a hybrid approach, based on stated preferences obtained through social research methods and the application of the “informational entropy” method.
This “entropic” method is particularly useful for the proposed experimentation, as it allows for efficient management of the complexity arising from multiple indicators. The following is a summary of the method’s origin and structure.
Information theory was formulated by Shannon in 1948 in his paper “A Mathematical Theory of Communication”, in which he addressed the problem of optimizing a communication network. The system for quantifying information identified by Shannon turns out to be identical in form and properties to entropy, a quantity known in thermodynamics. Let H be an entropy function. The only variables on which H can depend are the probabilities of the different possible events. The original definition is given as H (p1, p2, …, pn), as a function of a generic discrete random variable X, which can be realized in n different possible events with respective probabilities p1, p2, …, pn. Entropy allows us to measure how close or far the probability distribution is from the uniform case. In other words, if a system has high entropy, its state is shrouded in as much uncertainty as possible. By contrast, low entropy corresponds to less freedom of change and thus preferential configurations among its options, making it more predictable. Uncertainty about a system state is interpreted as a quantity of the system itself, rather than as a cognitive limitation of the observer.
The properties that characterize the theory are three:
1. H (…) is a continuous function of each of the pi probabilities;
2. If the pi probabilities are all equal (pi = 1/n), H takes its maximum value, since it represents the condition of maximum uncertainty about the result of variable X. This maximum value must be a monotonically increasing function of the number n of possible states;
3. If the possible events of variable X are separated into n disjoint subsets, the total entropy H must be a weighted composition of the Hi entropies of the individual subsystems. This property is called consistency.
Given these three properties, Shannon verifies that there is only one proper function and that it must have the following form:
(1)
Let pi be the probability of event xi.
The methodological application process is divided as follows:
1. Identify the random variable X, i.e., the set of possible states of the analyzed system. This may represent, for example, a series of experimental measurements, discrete events in a decision-making process, or frequency distributions of observed data (Cover and Thomas, 2006);
2. Define the probability distribution associated with the random variable. If the system has n distinct states {x1, x2, …, xn}, the probability of each state is calculated as:
(2)
Let pi be the normalized probability of each state. The above formula allows the calculation of entropy.
This method requires information directly collected from a significant sample of subjects. To this end, social research uses various methodologies to analyze behaviors, opinions, and dynamics within a society. Among them is the survey method, a fundamental tool for collecting data (quantitative or qualitative) from many individuals. It is widely recognized for its ability to provide structured and comparable information regarding a large number of individuals (Delli Zotti, 2020). The method generally involves the use of standardized questionnaires, which allow the systematic collection of quantitative data, facilitating results processing (Babbie, 2021).
One of the key aspects in the use of surveys is the design of the questionnaire, which must ensure the validity and reliability of responses (Groves et al., 2009). Questionnaires can be administered through many channels, including face-to-face, telephone, or online interviews, with varying implications for the quality and representativeness of the sample (Couper, 2008). The wording of questions, choice of measurement scales, and response format significantly affect the quality of the collected data (De Leeuw et al., 2012). In addition, according to some studies, the use of structured questionnaire interviews is particularly effective when the research objective is to assign scores to certain criteria (Fowler, 2014).
3. Methodological proposal
The proposed method consists of two stages; the first stage involves the taxonomic analysis of the 4 liveability indices selected in the previous Section (Section 2.2) and thus the de-structuring of the sub-criteria that constitute them; the second phase involves the recomposition of a set of criteria, sub-criteria, and indicators inherent to the theme of liveability and residential well-being. First, it involves the definition of a questionnaire to be submitted to a substantial and heterogeneous number of individuals, and, secondly, the weighting of the results obtained through informational entropy.
3.1 De-structuring of the 4 international indices
The study focuses on four multidimensional approaches that collect data and define indicative parameters for the Global Liveability Index, Global Power City Index, Innovation City Index, and Smart City Index. Data and results of each report analyzed below refer to the year 2023, the latest available as of this article’s writing date.
EIU: The Global Liveability Index
The methodology adopted for this assessment is based on the integration of qualitative and quantitative indicators that allow for a detailed and complex analysis focused on critical elements such as the quality of public services, personal safety, and the resilience of urban infrastructure. Specifically, for ranking urban liveability, the EIU employs more than 30 criteria, distributed into five main categories (criteria): i) stability, ii) health care, iii) culture and environment, iv) education, and v) infrastructure (Table 1). Each criterion for a given city is rated on a scale ranging from “acceptable” to “intolerable” (acceptable, tolerable, uncomfortable, undesirable, or intolerable).
| EIU - Global Liveability Index | |
|---|---|
| Stability | (a) Prevalence of petty crime; (b) Prevalence of violent crime; (c) Threat of terror; (d) Threat of military conflict; (e)Threat of civil unrest/conflict |
| Healthcare | (a) Availability of private healthcare; (b) Quality of private healthcare; (c) Availability of public healthcare; (d) Quality of public healthcare; (e) Availability of over-the-counter drugs; (f) General healthcare indicators |
| Culture and environment | (a) Humidity/temperature rating; (b) Discomfort of climate to travelers; (c) Level of corruption; (d) Social or religious restrictions; (e) Level of censorship; (f) Sporting availability; (g) Cultural availability; (h) Food & drink; (i) Consumer goods & services |
| Education | (a) Availability of private education; (b) Quality of private education; (c) Public education indicators |
| Infrastructures | (a) Quality of road network; (b) Quality of public transport; (c) Quality of international links; (d) Availability of good quality housing; (e) Quality of energy provision; (f) Quality of water provision; (g) Quality of telecommunications |
This evaluation system enables precise identification of strengths and opportunities for each urban context analyzed, providing a clear and structured framework for urban policy decisions. For qualitative indicators, a score is assigned based on the judgment of internal analysts and local collaborators, while for quantitative indicators, a score is calculated based on performance relative to an external data set. The scores are then compiled and weighted to provide a score on a scale from 1 to 100, where 1 is considered intolerable and 100 is considered ideal. The liveability rating is provided both as an overall score and as a score for each category.
GPCI: Global Power City Index
The Global Power City Index (GPCI) developed by the Institute for Urban Strategies, owned by The Mori Memorial Foundation, measures “urban magnetism” through six key criteria: i) economy, ii) research and development, iii) cultural interaction, iv) liveability, v) environment, and vi) accessibility (Table 2), offering a multi-dimensional and comprehensive view of urban competitiveness. Each of these functions is divided into various groups of sub-criteria, for a total of 26 groups. These contain a total of 70 specific indicators used to analyze the characteristics and performance of cities in detail. For each indicator, a score is calculated and aggregated at the sub-criterion level, and then further combined to obtain a score for each urban function. The sum of the scores for all urban functions determines the city’s overall ranking in the GPCI, and the maximum score for a city is 2,600 points. The structure of the indicators and their weighting provides a balanced measure of the liveability, sustainability, and effectiveness of urban policies, which are crucial for land-use planning and evaluation in estimation.
| GPCI - Global Power City Index | |
|---|---|
| Economy | (a) Market size: i) Nominal GDP; ii) GDP per capita. (b) Market Attractiveness: i) GDP growth rate; ii) Economic freedom. (c) Economy Vitality: i) Stock Market Capitalization; ii) World’s Top 500 Companies. (d) Human Capital: i) Total Employment; ii) Employees in Business Support Services. (e) Business Environment: i) Wage Level; ii) Availability of Skilled Human Resources; iii) Variety of Workplace Options. (f) Ease of Doing Business: i) Corporate Tax Rate; ii) Political, Economic and Business Risk. |
| Research and Development (R&D) | (a) Academic resources: i) Number of Researchers; ii) World’s Top Universities. (b) Research Environment: i) Research and Development Expenditure; ii) Number of International Students; iii) Academic Performance. (c) Innovation: i) Number of Patents; ii) Winners of Prizes in Science; iii) Number of Startups. |
| Cultural interaction | (a) Trendsetting Potential: i) Number of International Conferences; ii) Number of Cultural Events; iii) Cultural Content Export Value; iv) Art Market Environment. (b) Tourism resources: i) Tourist Attractions; ii) Proximity to World Heritage Sites; iii) Nightlife Options. (c) Cultural facilities: i) Number of Theaters; ii) Number of Museums; iii) Number of Stadiums. (d) Visitor amenities: i) Number of Hotel Rooms; ii) Number of Luxury Hotel Rooms; iii) Attractiveness of Shopping Options; iv) Attractiveness of Dining Options. (e) International interaction: i) Number of Foreign Residents; ii) Number of Foreign Visitors. |
| Liveability | (a) Working Environment: i) Total Unemployment Rate; ii) Total Working Hours per capita; iii) Workstyle flexibility. (b) Cost of living: i) Housing Rent; ii) Price level. (c) Security and safety: i) Number of Murders; ii) Economic Risk of Natural Disaster. (d) Well-being: i) Life Expectancy; ii) Social Freedom and Equality; iii) Risk to Mental Health. (e) Ease of living: i) Number of Medical Doctors; ii) information and communication technology (ICT) readiness; iii) Number of Retail Shops; iv) Number of Restaurants. |
| Accessibility | (a) International Network: i) Cities with Direct International Flights; ii) International Freight Flows. (b) Air Transport Capacity: i) Number of Air Passengers; ii) Number of Arrivals and Departures at Airports; iii) Station Density; iv) Public Transportation Use; v) Travel Time to Airports. (c) Transport comfort: i) Commuting Time; ii) Average Driving Speed; iii) Ease of Mobility by Taxi or Bicycle. |
IMD: Smart City Index
The IMD Smart City Index quantifies residents’ perceptions of urban infrastructure and available technologies in their cities. This index includes a comparative assessment of 141 cities globally, based on the responses of 120 residents from each city. The final score assigned to each city is the result of a weighted average of the perceptions collected over the past three years, following a weight distribution of 3:2:1 for the years 2023, 2021, and 2020, respectively.
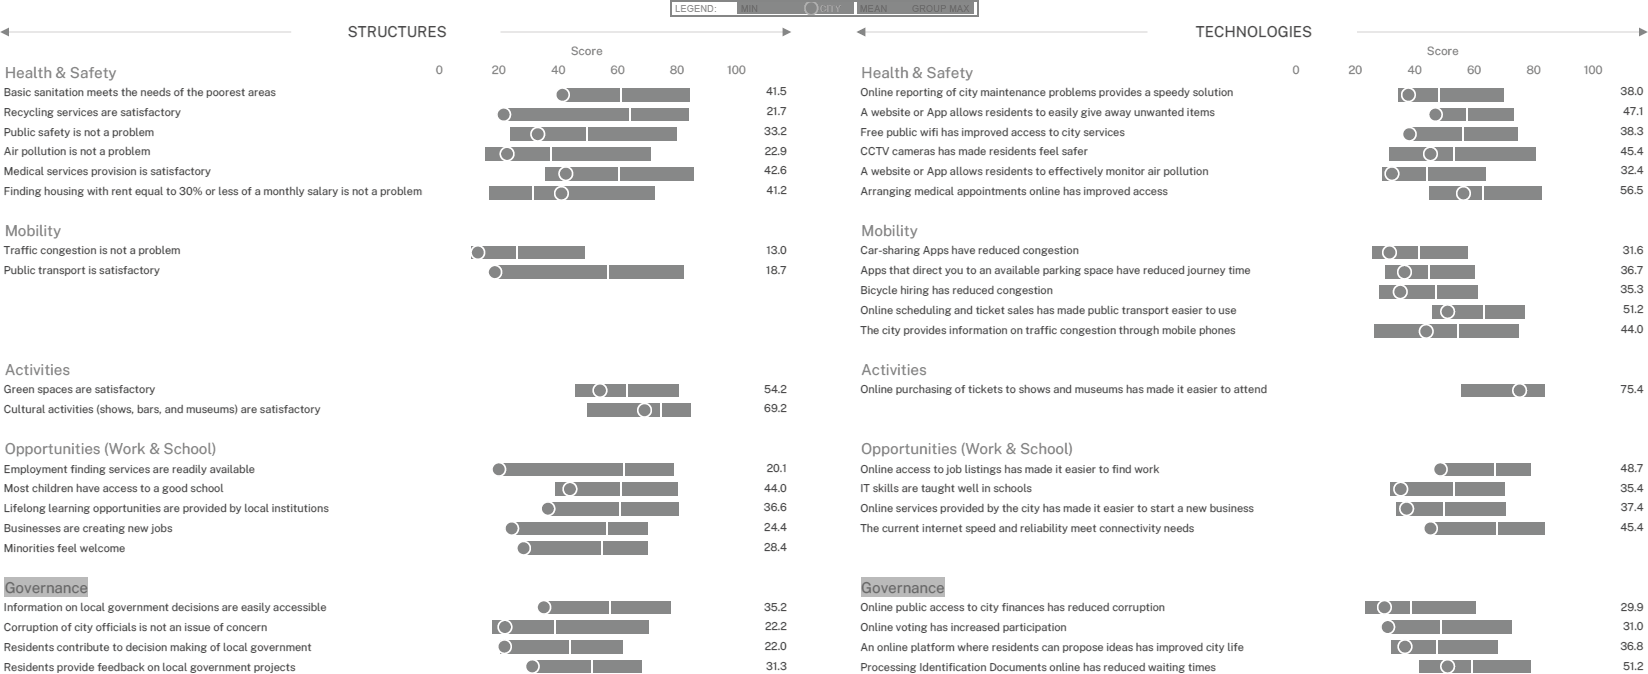
The Smart City Index methodology consists of two main evaluation pillars: Structures, i.e., the physical infrastructure of cities, and Technology, based on the technological development and digital services available to citizens. Each pillar is examined under five criteria: i) health and safety, ii) mobility, iii) activities, iv) opportunities, and v) governance (Fig. 3). To ensure a fair comparison, cities are categorized into four groups based on their score in the Global Data Lab’s Human Development Index (HDI). Thus, cities in a higher HDI group are not compared with those in lower HDI groups. Each city within these groups is assigned a ranking that varies according to their relative perception score. These classifications are organized as follows:
1. Group 1 (highest quartile of the HDI): classifications AAA to BB (AAA-AA-A-BBB-BB)
2. Group 2 (second quartile of the HDI): classifications A to CCC. (A-BBB-BB-B-CCC)
3. Group 3 (third quartile of the HDI): classifications BB to C. (BB-B-CCC-CC-C)
4. Group 4 (lowest quartile of the HDI): classifications CCC to D. (CCC-CC-C-D)
The results are presented both as an overall ranking, placing cities from 1 to 141, and as detailed ratings for each pillar and overall. This evaluation framework facilitates an in-depth understanding of a city’s ability to meet the needs of its residents through infrastructure and technology, providing essential data for urban analysis and planning in spatial and estimative assessment. An example of the evaluation structure is presented below.
Innovation Cities Index
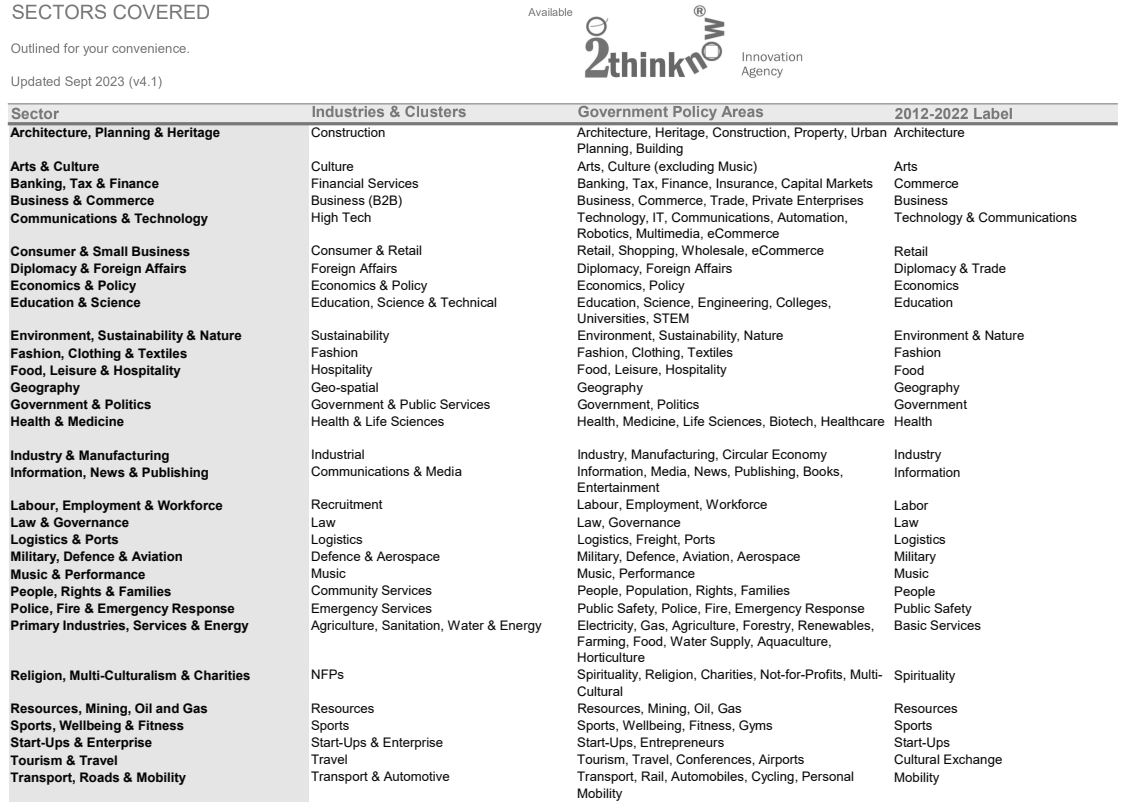
This index allows a broad and detailed comparison between different cities globally, based on a reference dataset consisting of 500 essential data points (2Thinknow, 2023). The indicators are carefully designed to collect all variables relevant to urban innovation, thus ensuring comprehensive coverage of the dynamics and conditions that influence city development (Fig. 4). In this way, the methodology is useful both for assessments and to support the continuous improvement of urban development strategies. Again, the process goes through several steps. First, criteria that reflect key aspects of innovation are chosen; they include i) quality of education, ii) availability of human capital, iii) technological infrastructure, iv) access to services, and v) impact on public policy. Following data collection through government reports and field surveys, the indicators are standardized to enable comparisons between different cities worldwide.
3.2 The recomposition of the set of criteria, sub-criteria and indicators
After analyzing the index above, a set of criteria, sub-criteria and indicators for urban liveability has been developed. An exhaustive list of all the sub-criteria in the above indices, totaling 183 sub-criteria, was defined in the first stage. As they outline heterogeneous aspects of life, they have been grouped according to their area of interest, defining thirteen criteria, as follows: 1) Safety; 2) Government and Politics; 3) Market; 4) Healthcare; 5) Environment; 6) Culture; 7) Services; 8) Education; 9) Tourism; 10) Communication and Technology; 11) Infrastructure; 12) Architecture; 13) Economy and Finance.
Since some aspects mentioned throughout the sub-criteria refer to similar concepts, a taxonomic recomposition of these has been carried out. Accordingly, the Table 3 has been further rationalised by aggregating similar sub-criteria under one sub-criterion. This reorganisation process allows the definition of a structured list of 132 sub-criteria (well-being indicators). Finally, a specific unit of measurement is assigned to each of them, allowing the multiple dimensions of urban liveability to be quantified and assessed. Through this multi-criteria approach, it is possible to interrelate the many dimensions that define liveability in relation to the place. This facilitates the identification of areas for intervention and improvement, supporting decision-making for urban planning and sustainable development projects.
| Well-being indicators | |||
|---|---|---|---|
| Criterion | Sub-criterion | Indicator | Reference report |
| 1. Safety | 1.1 Micro-crime | % | EIU Indicator |
| 1.2 Violent crime | % | EIU Indicator, GPCI 2023 | |
| 1.3 Military conflicts | qualitative | EIU Indicator | |
| 1.4 Protests and activism | % | EIU Indicator, Innovation Cities Index | |
| 1.5 Threat of natural disasters | qualitative | Innovation Cities Index | |
| 1.6 Health emergency locations | n. | Innovation Cities Index | |
| 2. Government and Politics | 2.1 Government responsiveness | qualitative | Innovation Cities Index |
| 2.2 Government stability | years | Innovation Cities Index | |
| 2.3 Political transparency | % | Innovation Cities Index | |
| 2.4 Professionalism of public employees | qualitative | Innovation Cities Index | |
| 2.5 Level of corruption | qualitative | EIU Indicator | |
| 3. Market | 3.1 Total unemployment rate | % | GPCI 2023 |
| 3.2 Working hours per capita | h | GPCI 2023 | |
| 3.3 Work style flexibility | % | GPCI 2023 | |
| 3.4 Average housing prices | €/m² | GPCI 2023, revisited | |
| 3.5 Handicrafts | % | Innovation Cities Index | |
| 4. Healthcare | 4.1 Private healthcare | % | EIU Indicator, Innovation Cities Index |
| 4.2 Public healthcare | % | EIU Indicator, Innovation Cities Index | |
| 4.3 Over-the-counter drugs | d | EIU Indicator | |
| 4.4 Healthcare staff | n. | Innovation Cities Index | |
| 4.5 Health emergencies | % | Innovation Cities Index | |
| 4.6 Population well-being | % | Innovation Cities Index | |
| 4.7 Life expectancy | years | GPCI 2023, Innovation Cities Index | |
| 4.8 Mental health | MH | GPCI 2023 | |
| 5. Environment | 5.1 Relative humidity | % | EIU Indicator, Innovation Cities Index |
| 5.2 CO2 emissions per capita | CO2/eq | GPCI 2023, Innovation Cities Index | |
| 5.3 Thermal comfort | °C | GPCI 2023 | |
| 5.4 Noise pollution | dBA | Innovation Cities Index | |
| 5.5 Water quality | service area | GPCI 2023, Innovation Cities Index | |
| 5.6 Air quality | qualitative | GPCI 2023, Innovation Cities Index | |
| 5.7 Nature | service area | Innovation Cities Index | |
| 5.8 Urban green space | % | GPCI 2023, Innovation Cities Index | |
| Green businesses | n. | Innovation Cities Index | |
| 5.10 Renewable energy tariff | - | GPCI 2023 | |
| 5.11 Waste recycling rate | % | GPCI 2023 | |
| 5.12 Urban cleanliness | % | GPCI 2023 | |
| 6. Culture | 6.1 Cultural activities | n. | GPCI 2023, EIU Indicator |
| 6.2 Religious freedom | % | EIU Indicator, GPCI 2023 | |
| 6.3 Gender equality | % | Innovation Cities Index | |
| 6.4 Citizen rights | qualitative | Innovation Cities Index | |
| 6.5 Press freedom | qualitative | EIU Indicator | |
| 7. Services | 7.1 Sports facilities availability | n./% | EIU Indicator, GPCI 2023 |
| 7.2 Business activities | n./% | EIU Indicator, GPCI 2023, Innovation Cities Index. | |
| 7.3 Youth activities | n./% | Innovation Cities Index, GPCI 2023 | |
| 7.4 Cultural assets | % | GPCI 2023 | |
| 7.5 Number of hotels | n./% | Innovation Cities Index | |
| 7.6 Postal services | n./% | Innovation Cities Index | |
| 7.7 Department stores | n./% | Innovation Cities Index | |
| 8. Education | 8.1 Private education | n. | EIU Indicator |
| 8.2 Public education | n. | EIU Indicator | |
| 8.3 Quality of private education | qualitative | EIU Indicator | |
| 8.4 Quality of public education | qualitative | EIU Indicator | |
| 8.5 Academic performance | % | GPCI 2023 | |
| 8.6 Number of researchers | n. | GPCI 2023 | |
| 8.7 Number of international students | n. | GPCI 2023, Innovation Cities Index | |
| 8.8 University supply | n. | Innovation Cities Index | |
| 8.9 Research and development funds | € | GPCI 2023 | |
| 8.10 Global ranking of universities | qualitative | GPCI 2023 | |
| 8.11 Number of patents | n. | GPCI 2023 | |
| 8.12 Award winners in science and technology | n. | GPCI 2023 | |
| 9. Tourism | 9.1 Availability of tourist information | - | Innovation Cities Index |
| 9.2 Number of tourists | n. | Innovation Cities Index | |
| 9.3 Multilingual city/language | n. | Innovation Cities Index | |
| 9.4 Tourist attractions | % | GPCI 2023 | |
| 10. Communication and Technology | 10.1 Adoption of new technologies | % | Innovation Cities Index |
| 10.2 Broadband internet | service area | Innovation Cities Index | |
| 10.3 Landline telephone network | service area | Innovation Cities Index | |
| 10.4 Mobile phone network | n. | Innovation Cities Index | |
| 10.5 Public wireless internet | % | Innovation Cities Index | |
| 10.6 Smart working | % | Innovation Cities Index | |
| 10.7 E-commerce sales | % | Innovation Cities Index | |
| 10.8 Internet users | % | Innovation Cities Index | |
| 10.9 ICT readiness | % | GPCI 2023 | |
| 10.10 Government IT policy/digital infrastructure | qualitative | Innovation Cities Index, EIU Indicator |
|
| 10.11 Metaverse | % | Innovation Cities Index | |
| 10.12 Mass transportation automation | % | Innovation Cities Index | |
| 10.13 Smart devices | qualitative | Innovation Cities Index | |
| 11. Infrastructure | 11.1 Quality of the road network | qualitative | Innovation Cities Index, EIU Indicator |
| 11.2 Car sharing | n. | Innovation Cities Index | |
| 11.3 Traffic accidents | % | GPCI 2023 | |
| 11.4 Road signs | qualitative | Innovation Cities Index | |
| 11.5 Number of stations | n. | GPCI 2023 | |
| 11.6 Use of public transportation | % | GPCI 2023 | |
| 11.7 Commuting time | min | GPCI 2023 | |
| 11.8 Travel time to airports | min | GPCI 2023 | |
| 11.9 Availability/frequency of public services | service area | Innovation Cities Index | |
| 11.10 Quality of public transportation | % satisfaction | Innovation Cities Index, EIU Indicator | |
| 11.11 Ease of cab mobility | n. | GPCI 2023, Innovation Cities Index | |
| 11.12 Presence of international airports | n. | Innovation Cities Index | |
| 11.13 Cities with direct international flights | n. | GPCI 2023 | |
| 11.14 Number of arrivals and departures at airports | n. | GPCI 2023 | |
| 11.15 Airport transfers | n. | Innovation Cities Index | |
| 11.16 Transportation accessibility | % | Innovation Cities Index | |
| 11.17 Walkable city | route density | Innovation Cities Index | |
| 11.18 Bikeable city | route density | Innovation Cities Index | |
| 11.19 Quality of energy supply | service area | EIU Indicator | |
| 12. Architecture | 12.1 Architectural stratification | % | Innovation Cities Index |
| 12.2 Decorative characteristics of buildings | qualitative | Innovation Cities Index | |
| 12.3 Green architecture | % | Innovation Cities Index | |
| 12.4 Historical architecture | n. | Innovation Cities Index | |
| 12.5 Quality of neighborhoods | % | Innovation Cities Index | |
| 12.6 Vertical constructions | n. | Innovation Cities Index | |
| 12.7 Public meeting spaces | n. | Innovation Cities Index | |
| 12.8 Good-quality accommodation | qualitative | EIU Indicator | |
| 12.9 New construction technologies | qualitative | Innovation Cities Index | |
| 13. Economy and Finance | 13.1 Nominal GDP | € | GPCI 2023 |
| 13.2 GDP per capita | € | GPCI 2023 | |
| 13.3 GDP growth rate | % | GPCI 2023 | |
| 13.4 Stock market capitalization | € | GPCI 2023 | |
| 13.5 Employment rate | % | GPCI 2023 | |
| 13.6 Salary level | € | GPCI 2023 | |
| 13.7 Professional Services | % | Innovation Cities Index | |
| 13.8 Economic freedom | qualitative | GPCI 2023 | |
| 13.9 Banking stability | CAR/LCR/ROA | Innovation Cities Index | |
| 13.10 Corporate income tax | % | Innovation Cities Index | |
| 13.11 Accessibility to finance for growing businesses | % | Innovation Cities Index | |
| 13.12 Acceptance of major credit cards | % | Innovation Cities Index | |
| 13.13 Start-up | n. | Innovation Cities Index, GPCI 2023 | |
| 13.14 Economic risk of natural disasters | risk | GPCI 2023 | |
| 13.15 Employees in business support services | n. | GPCI 2023 | |
| 13.16 Availability of qualified human resources | % | GPCI 2023 | |
| 13.17 Variety of options in the workplace | %/n. | GPCI 2023 | |
| 13.18 Political, economic and business risk | risk | GPCI 2023 | |
| 13.19 Cryptocurrency | % | Innovation Cities Index | |
| 13.20 Currency exchange | RER | Innovation Cities Index | |
| 13.21 Headquarters of multinational corporations | % | Innovation Cities Index | |
| 13.22 Value-added tax | % | Innovation Cities Index | |
| 13.23 Advertising in the media | % | Innovation Cities Index | |
| 13.24 Business approach | qualitative | Innovation Cities Index | |
| 13.25 Designers | % | Innovation Cities Index | |
| 13.26 Industrial diversity | % | Innovation Cities Index | |
| 13.27 Professional services | % | Innovation Cities Index | |
The definition of the residential well-being criteria proposed in the table required a process of data selection and systematization. In particular, 51 sub-criteria were eliminated from the original table of all the criteria drawn from the previously mentioned international reports, as they were repeated two or more times and therefore not relevant to the research.
The table is organised into four parts: i) Criteria (thematic dimensions); ii) Sub-criteria (specific well-being factors); iii) Indicators (units of measurement); iv) Reference reports (source documents). This structure allows for a rigorous systematization of the evaluation process, providing a solid basis for measuring residential well-being. However, it must be noted that although much data is readily available through official sources or standardized tools, for others, the availability of information may be more limited. Some sub-criteria would require further studies regarding data collection, particularly for subjective aspects related to the individual’s perceptions.
4. Experimentation and results
4.1 Weighting by informational entropy (applied to surveys)
To identify the most relevant well-being indicators of liveability, a systematic review of the indices underlying the experiment has been conducted. 132 sub-criteria belonging to different criteria (thematic dimensions of well-being) have been defined; social categories with a direct interest in residential well-being (students, workers, immigrants, senior citizens, etc.) have been identified. Then, questionnaires were administered regarding the perceived relevance of the indicators with a numerical scale from 1 to 10 to weigh the criteria according to their importance. The attribution of different weights to each sub-criterion by the survey sample generates informational entropy; that is, given the variability of the data obtained, a situation of informational uncertainty occurs, possibly leading to unclear and unmanageable results. The decision matrix generated from the collected data is defined and normalized into the matrix through appropriate formulas. The R matrix is converted to the matrix using the normalized values, and the entropy attributed to the equivalent indicators is calculated. Finally, attribute weighting takes place. Since the entropic method attaches more importance to sub-criteria with more variability in respondents’ responses (high entropy) and less importance to sub-criteria with less variability (low entropy), the theoretical method based on entropic information is supplemented with the simple weighted and normalized mean of the scores for each sub-criterion. This is because, if all (or most) respondents attribute the highest score to a specific sub-criterion, it must have a high final weight since it reflects an important aspect for the social groups surveyed (Guarini et al., 2014; Guarini and Battisti, 2014).
Surveys
The experimentation surveyed a sample of 100 individuals from heterogeneous social groups in terms of employment and educational status. Therefore, the following groups of respondents were considered: i) on-campus students, ii) off-campus students, iii) smart workers, iv) non-smart workers, v) NEETs (not in employment, education or training), and vi) retirees. To assign a weight to each well-being sub-criterion, questionnaires are administered to respondents regarding the evaluation by importance of the sub-criteria; the importance scale consists of Irrelevant; Unimportant; Slightly important; Moderately important; Neither important nor unimportant (neutral); Somewhat important; Important; Very important; Fundamental; Essential. Next, the interview results were converted into numerical values from 1 to 10.
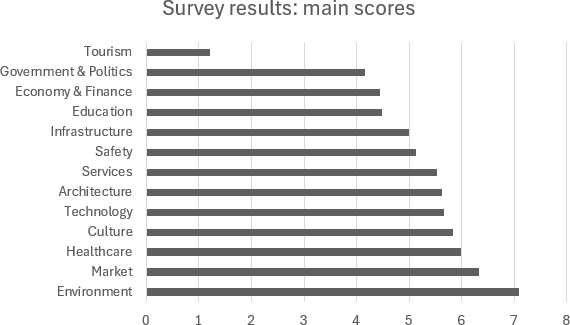
Figure 5 summarizes the average scores attributed to each of the 13 thematic categories. Environmental quality, market-related factors, and healthcare emerge as the most valued dimensions, reflecting the priority attributed to sustainability, economic vitality, and health infrastructure in determining residential well-being. Conversely, criteria such as tourism and governance are perceived as having a more marginal impact on daily life.
Entropy calculation
As a result of the data collected through the questionnaires referring to the various categories of selected individuals, some sub-criteria with heterogeneous opinions, which must be focused on, are highlighted. Thus, weights are determined by considering: i) the variability of the answers given by the respondents; ii) the importance that respondents give to each indicator.
The procedure proposed and explained in Section 2.3 is applied to weight the various sub-criteria optimally and minimize errors with the following assumptions:
– High entropy (≥0.6) and high mean (≥0.6) → High weight;
– Low entropy (< 0.6) and high mean (≥ 0.6) → High weight;
– High entropy (≥ 0.6) and low mean (< 0.6) → Moderate weight;
– Low entropy (< 0.6) and low mean (< 0.6) → Low weight.
First, each indicator was normalized to standardize the data in the decision matrix. The following formula was used:
(3)
where:
– xi represents the response given by unit i for the indicator
– min(xi) and max(xi) are the minimum and maximum values (1 to 10), respectively
– π is a constant to ensure that βi is always different from zero
Then, the entropy for each indicator is calculated as:
(4)
Below is the table of standardized well-being indices (Table 4).
| Results and weighting | |||||
|---|---|---|---|---|---|
| Indicator no. | Entropy | Mean (min/max) | Weight (0-1) | Weight (%) | Weight (qualitative) |
| Ind. 1.1 | 0.87 | 0.61 | 0.865 | 1.51 | High |
| Ind. 1.2 | 1.00 | 0.55 | 0.573 | 1.00 | Moderate |
| Ind. 1.3 | 0.25 | 0.14 | 0.088 | 0.15 | Low |
| Ind. 1.4 | 0.36 | 0.18 | 0.132 | 0.23 | Low |
| Ind. 1.5 | 0.69 | 0.71 | 0.819 | 1.43 | High |
| Ind. 1.6 | 0.69 | 0.71 | 0.819 | 1.43 | High |
| Ind. 2.1 | 0.87 | 0.31 | 0.495 | 0.87 | Moderate |
| Ind. 2.2 | 0.87 | 0.43 | 0.495 | 0.87 | Moderate |
| Ind. 2.3 | 0.48 | 0.43 | 0.245 | 0.43 | Low |
| Ind. 2.4 | 0.56 | 0.24 | 0.213 | 0.37 | Low |
| Ind. 2.5 | 0.69 | 0.43 | 0.388 | 0.68 | Moderate |
| Ind. 3.1 | 0.69 | 0.73 | 0.831 | 1.46 | High |
| Ind. 3.2 | 0.74 | 0.47 | 0.417 | 0.73 | Moderate |
| Ind. 3.3 | 0.87 | 0.84 | 1.000 | 1.75 | High |
| Ind. 3.4 | 0.56 | 0.82 | 0.462 | 0.81 | High |
| Ind. 3.5 | 0.36 | 0.31 | 0.169 | 0.30 | Low |
| Ind. 4.1 | 0.74 | 0.39 | 0.417 | 0.73 | Moderate |
| Ind. 4.2 | 0.69 | 0.86 | 0.905 | 1.58 | High |
| Ind. 4.3 | 0.48 | 0.78 | 0.437 | 0.77 | High |
| Ind. 4.4 | 0.56 | 0.57 | 0.312 | 0.55 | Low |
| Ind. 4.5 | 0.74 | 0.49 | 0.417 | 0.73 | Moderate |
| Ind. 4.6 | 0.56 | 0.39 | 0.257 | 0.45 | Low |
| Ind. 4.7 | 0.74 | 0.57 | 0.417 | 0.73 | Moderate |
| Ind. 4.8 | 0.74 | 0.67 | 0.824 | 1.44 | High |
| Ind. 5.1 | 0.56 | 0.80 | 0.450 | 0.79 | High |
| Ind. 5.2 | 0.74 | 0.67 | 0.824 | 1.44 | High |
| Ind. 5.3 | 0.56 | 0.80 | 0.450 | 0.79 | High |
| Ind. 5.4 | 0.48 | 0.84 | 0.474 | 0.83 | High |
| Ind. 5.5 | 0.48 | 0.67 | 0.376 | 0.66 | High |
| Ind. 5.6 | 0.74 | 0.67 | 0.824 | 1.44 | High |
| Ind. 5.7 | 0.56 | 0.71 | 0.400 | 0.70 | High |
| Ind. 5.8 | 0.74 | 0.86 | 0.934 | 1.64 | High |
| Ind. 5.9 | 0.56 | 0.57 | 0.312 | 0.55 | Low |
| Ind. 5.10 | 0.56 | 0.55 | 0.306 | 0.54 | Low |
| Ind. 5.11 | 0.69 | 0.80 | 0.868 | 1.52 | High |
| Ind. 5.12 | 0.69 | 0.76 | 0.844 | 1.48 | High |
| Ind. 6.1 | 0.69 | 0.53 | 0.388 | 0.68 | Moderate |
| Ind. 6.2 | 0.69 | 0.43 | 0.388 | 0.68 | Moderate |
| Ind. 6.3 | 0.74 | 0.67 | 0.824 | 1.44 | High |
| Ind. 6.4 | 0.74 | 0.61 | 0.787 | 1.38 | High |
| Ind. 6.5 | 0.25 | 0.61 | 0.339 | 0.59 | High |
| Ind. 7.1 | 0.74 | 0.78 | 0.885 | 1.55 | High |
| Ind. 7.2 | 0.25 | 0.73 | 0.413 | 0.72 | High |
| Ind. 7.3 | 0.69 | 0.63 | 0.770 | 1.35 | High |
| Ind. 7.4 | 0.56 | 0.37 | 0.250 | 0.44 | Low |
| Ind. 7.5 | 0.48 | 0.10 | 0.146 | 0.26 | Low |
| Ind. 7.6 | 0.69 | 0.41 | 0.388 | 0.68 | Moderate |
| Ind. 7.7 | 0.48 | 0.71 | 0.400 | 0.70 | High |
| Ind. 8.1 | 0.56 | 0.14 | 0.183 | 0.32 | Low |
| Ind. 8.2 | 0.61 | 0.84 | 0.844 | 1.48 | High |
| Ind. 8.3 | 0.36 | 0.14 | 0.120 | 0.21 | Low |
| Ind. 8.4 | 0.25 | 0.80 | 0.450 | 0.79 | High |
| Ind. 8.5 | 0.69 | 0.57 | 0.388 | 0.68 | Moderate |
| Ind. 8.6 | 0.69 | 0.31 | 0.388 | 0.68 | Moderate |
| Ind. 8.7 | 0.87 | 0.29 | 0.495 | 0.87 | Moderate |
| Ind. 8.8 | 0.74 | 0.69 | 0.836 | 1.46 | High |
| Ind. 8.9 | 0.87 | 0.43 | 0.495 | 0.87 | Moderate |
| Ind. 8.10 | 0.36 | 0.22 | 0.144 | 0.25 | Low |
| Ind. 8.11 | 0.36 | 0.22 | 0.144 | 0.25 | Low |
| Ind. 8.12 | 0.36 | 0.22 | 0.144 | 0.25 | Low |
| Ind. 9.1 | 0.25 | 0.00 | 0.045 | 0.08 | Low |
| Ind. 9.2 | 0.25 | 0.00 | 0.045 | 0.08 | Low |
| Ind. 9.3 | 0.25 | 0.02 | 0.051 | 0.09 | Low |
| Ind. 9.4 | 0.25 | 0.00 | 0.045 | 0.08 | Low |
| Ind. 10.1 | 0.56 | 0.67 | 0.376 | 0.66 | High |
| Ind. 10.2 | 0.56 | 0.67 | 0.376 | 0.66 | High |
| Ind. 10.3 | 0.48 | 0.14 | 0.158 | 0.28 | Low |
| Ind. 10.4 | 0.48 | 0.84 | 0.474 | 0.83 | High |
| Ind. 10.5 | 0.48 | 0.94 | 0.536 | 0.94 | High |
| Ind. 10.6 | 0.69 | 0.69 | 0.807 | 1.41 | High |
| Ind. 10.7 | 0.87 | 0.29 | 0.495 | 0.87 | Moderate |
| Ind. 10.8 | 0.48 | 0.18 | 0.171 | 0.30 | Low |
| Ind. 10.9 | 0.87 | 0.57 | 0.495 | 0.87 | Moderate |
| Ind. 10.10 | 1.00 | 0.51 | 0.573 | 1.00 | Moderate |
| Ind. 10.11 | 0.74 | 0.55 | 0.417 | 0.73 | Moderate |
| Ind. 10.12 | 0.74 | 0.45 | 0.417 | 0.73 | Moderate |
| Ind. 10.13 | 0.87 | 0.63 | 0.877 | 1.54 | High |
| Ind. 11.1 | 0.69 | 0.41 | 0.388 | 0.68 | Moderate |
| Ind. 11.2 | 0.87 | 0.33 | 0.495 | 0.87 | Moderate |
| Ind. 11.3 | 0.36 | 0.76 | 0.425 | 0.74 | High |
| Ind. 11.4 | 0.56 | 0.31 | 0.232 | 0.41 | Low |
| Ind. 11.5 | 0.87 | 0.73 | 0.938 | 1.64 | High |
| Ind. 11.6 | 0.69 | 0.59 | 0.388 | 0.68 | Moderate |
| Ind. 11.7 | 0.74 | 0.43 | 0.417 | 0.73 | Moderate |
| Ind. 11.8 | 0.00 | 0.10 | 0.000 | 0.00 | Low |
| Ind. 11.9 | 0.56 | 0.73 | 0.413 | 0.72 | High |
| Ind. 11.10 | 0.36 | 0.59 | 0.255 | 0.45 | Low |
| Ind. 11.11 | 0.56 | 0.14 | 0.183 | 0.32 | Low |
| Ind. 11.12 | 0.48 | 0.33 | 0.214 | 0.37 | Low |
| Ind. 11.13 | 0.56 | 0.22 | 0.207 | 0.36 | Low |
| Ind. 11.14 | 0.56 | 0.08 | 0.164 | 0.29 | Low |
| Ind. 11.15 | 0.61 | 0.43 | 0.339 | 0.59 | Moderate |
| Ind. 11.16 | 0.69 | 0.73 | 0.831 | 1.46 | High |
| Ind. 11.17 | 0.48 | 0.84 | 0.474 | 0.83 | High |
| Ind. 11.18 | 0.36 | 0.90 | 0.511 | 0.90 | High |
| Ind. 11.19 | 0.87 | 0.27 | 0.495 | 0.87 | Moderate |
| Ind. 12.1 | 0.36 | 0.06 | 0.095 | 0.17 | Low |
| Ind. 12.2 | 0.87 | 0.63 | 0.877 | 1.54 | High |
| Ind. 12.3 | 0.87 | 0.55 | 0.495 | 0.87 | Moderate |
| Ind. 12.4 | 0.48 | 0.43 | 0.245 | 0.43 | Low |
| Ind. 12.5 | 0.48 | 1.00 | 0.573 | 1.00 | High |
| Ind. 12.6 | 0.48 | 0.12 | 0.152 | 0.27 | Low |
| Ind. 12.7 | 0.56 | 0.80 | 0.450 | 0.79 | High |
| Ind. 12.8 | 0.48 | 0.90 | 0.511 | 0.90 | High |
| Ind. 12.9 | 0.87 | 0.43 | 0.495 | 0.87 | Moderate |
| Ind. 13.1 | 0.39 | 0.65 | 0.363 | 0.64 | High |
| Ind. 13.2 | 0.56 | 0.31 | 0.232 | 0.41 | Low |
| Ind. 13.3 | 0.56 | 0.31 | 0.232 | 0.41 | Low |
| Ind. 13.4 | 0.69 | 0.29 | 0.388 | 0.68 | Moderate |
| Ind. 13.5 | 0.74 | 0.78 | 0.885 | 1.55 | High |
| Ind. 13.6 | 0.56 | 0.67 | 0.376 | 0.66 | High |
| Ind. 13.7 | 0.69 | 0.37 | 0.388 | 0.68 | Moderate |
| Ind. 13.8 | 0.36 | 0.80 | 0.450 | 0.79 | High |
| Ind. 13.9 | 0.74 | 0.73 | 0.861 | 1.51 | High |
| Ind. 13.10 | 0.25 | 0.00 | 0.045 | 0.08 | Low |
| Ind. 13.11 | 0.56 | 0.20 | 0.201 | 0.35 | Low |
| Ind. 13.12 | 0.69 | 0.43 | 0.388 | 0.68 | Moderate |
| Ind. 13.13 | 0.56 | 0.69 | 0.388 | 0.68 | High |
| Ind. 13.14 | 0.87 | 0.53 | 0.495 | 0.87 | Moderate |
| Ind. 13.15 | 0.25 | 0.00 | 0.045 | 0.08 | Low |
| Ind. 13.16 | 0.56 | 0.14 | 0.183 | 0.32 | Low |
| Ind. 13.17 | 0.87 | 0.71 | 0.926 | 1.62 | High |
| Ind. 13.18 | 0.74 | 0.27 | 0.417 | 0.73 | Moderate |
| Ind. 13.19 | 0.87 | 0.33 | 0.495 | 0.87 | Moderate |
| Ind. 13.20 | 0.48 | 0.22 | 0.183 | 0.32 | Low |
| Ind. 13.21 | 0.74 | 0.55 | 0.417 | 0.73 | Moderate |
| Ind. 13.22 | 0.74 | 0.37 | 0.417 | 0.73 | Moderate |
| Ind. 13.23 | 0.36 | 0.02 | 0.083 | 0.14 | Low |
| Ind. 13.24 | 0.56 | 0.41 | 0.263 | 0.46 | Low |
| Ind. 13.25 | 0.48 | 0.41 | 0.239 | 0.42 | Low |
| Ind. 13.26 | 0.69 | 0.53 | 0.388 | 0.68 | Moderate |
| Ind. 13.27 | 0.25 | 0.12 | 0.082 | 0.14 | Low |
The percentages obtained are a determinant for defining liveability criteria because they provide a quantitative measure of the survey participants’ perceived relevance.
Through the interpolation of arithmetic averages and the variability of the scores assigned by the individuals surveyed, urban liveability indicators are weighted (see below, Table 4). Table 4 shows both the percentage weights of each indicator and a qualitative assessment of the sub-criteria, ranked according to their significance as previously specified: high, moderate, or low. High-importance sub-criteria total 52 and are mainly concentrated in the environmental and labor market areas. Sub-criteria with more variability in responses (entropy of 1) included violent crime (sub-criterion 1.2) and government IT policy (sub-criterion 10.10). By contrast, sub-criteria such as travel time to airports (sub-criterion 11.8) and tourist attractions (sub-criterion 9.4) generated low entropy.
5. Discussions and conclusions
The results obtained in the analysis phase, involving the categories of respondents defined before, show a clear hierarchy among well-being sub-criteria. The results bring out the importance of factors such as environment, public health, and employment/unemployment agreed upon by all. This means that environmental quality, access to accessible, high-quality public healthcare, and employment opportunities are generally recognized as crucial elements of quality of life. In the environmental criterion, almost all indicators scored high, well above 0.8; in particular, good design of green and natural areas is considered crucial in the urban context. Healthcare, too, is a major factor, as it achieved very high results. Regardless of their income range, people believe that access to high-quality public health facilities is essential, especially in a post-pandemic context.
Another sub-criterion of considerable interest is smart or flexible working. This factor is considered important mainly because of the variability of the responses; in the middle-income categories, working remotely is found to be an indicator with increasing relevance compared to the others. This reflects a global trend, accelerated by the Covid-19 pandemic, in which smart working has been seen as an advantageous solution for balancing work and personal life. Although not all participants attached the same degree of importance to this factor, the general perception is that work flexibility can contribute significantly to improving personal well-being, and the indicator is important precisely because it elicits different opinions and thus deserves more debate and attention.
In contrast to the highly rated sub-criteria, factors such as tourism, the presence of facilities such as airports, or services such as hotels scored much lower. They have been considered marginal or even deleterious factors for residential well-being, especially for people in the low, low-middle, and upper-middle income categories. This could be due, for example, to the increase in housing rental and sale prices caused precisely by the strong tourist attractiveness of the place. Similarly, the presence of large facilities such as international airports negatively affects residential well-being. Although access to global infrastructure may be perceived as important in terms of economic development and mobility, its direct impact on individual well-being was found to be less significant than other factors more related to everyday life, such as access to healthcare or environmental protection. To ensure a fair assessment of the importance of the various criteria, each criterion was assigned a weight, expressed as a percentage. The methodological process included the following steps: i) sum of the weights assigned to the individual sub-criteria for each criterion, so that each criterion is given an overall score; ii) definition of each criterion’s mean weight, to avoid distortions due to the different numbers of sub-criteria contained in each criterion; iii) conversion of the mean scores of each criterion into percentage weights. Table 5 summarizes the process.
| Determination of percentage points for each criterion | ||||
|---|---|---|---|---|
| Criteria | Sum of subcriteria weights | n. of subcriteria by category | Mean weight by category |
Percentage weight |
| Safety | 5.76972 | 6 | 0.96 | 9.7 |
| Government and politics | 3.21448 | 5 | 0.64 | 6.5 |
| Market | 5.04121 | 5 | 1.01 | 10.1 |
| Healthcare | 6.97945 | 8 | 0.87 | 8.8 |
| Environment | 12.36337 | 12 | 1.03 | 10.4 |
| Culture | 4.77064 | 5 | 0.95 | 9.6 |
| Services | 5.69443 | 7 | 0.81 | 8.2 |
| Education | 8.10709 | 12 | 0.68 | 6.8 |
| Tourism | 0.32663 | 4 | 0.08 | 0.8 |
| Communication and technology | 10.80545 | 13 | 0.83 | 8.4 |
| Infrastructure | 12.90403 | 19 | 0.68 | 6.8 |
| Architecture | 6.81520 | 9 | 0.76 | 7.6 |
| Economy | 17.20831 | 27 | 0.64 | 6.4 |
The summary graph below provides a better visualization of the discussed data (Fig. 6).
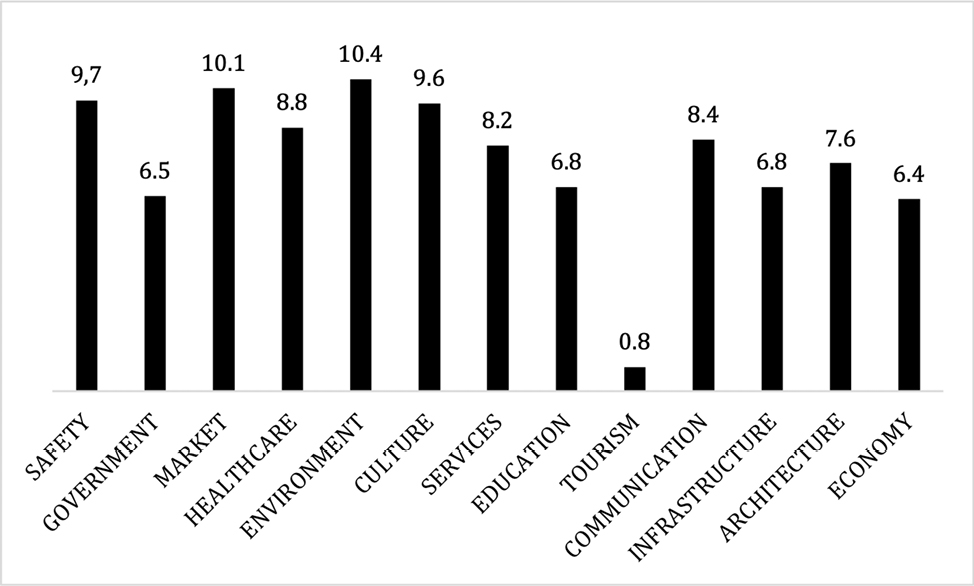
The results suggest that public policies should focus on criteria that are most relevant to well-being, such as environment, health, and employment. In a perspective of optimization of resource allocation to achieve the highest urban benefits (Acampa and Pino, 2023), policies should be focused on improving these criteria, which are perceived as fundamental by citizens. Ecological policies, universal access to health care, and job creation are, therefore, the key areas in which to invest to increase collective well-being. Moreover, housing accessibility also appears as one of the key sub-criteria for residential well-being.
In addition, the fact that smart working is emerging as an important sub-criterion also suggests that future policies may encourage the adoption of more flexible work patterns that allow workers to better balance professional and personal needs.
The analysis of indicators of residential well-being identified the most relevant aspects for citizens’ perceived quality of life. The results obtained confirm the importance of criteria such as environment, health, and market, with weights above 8.5 percent compared to the total of thirteen dimensions. These results align with the literature suggesting that environmental quality, access to healthcare, and job stability are among the main determinants of well-being. In particular, the importance attached to the environment and health reflects the growing awareness of global ecological and health challenges, while employment is perceived as a key factor in ensuring economic and psychological well-being. In terms of policy implications, the results indicate that public policies should focus on interventions that improve environmental quality, access to health services, and employment opportunities, as these factors are perceived as essential to the population’s well-being. In addition, the growing relevance of remote work suggests the need to promote more flexible and inclusive work solutions that can meet the needs of an evolving world of work.
However, it is important to recognise the limitations of this study: for example, in the study, a sample of 100 persons diversified by status (e.g. students, workers and pensioners) was considered. This sample size is relatively small compared to the complexity of the phenomenon under investigation. A small sample size reduces the statistical power of the analysis and increases the margin of error, potentially obscuring significant trends or correlations. Furthermore, it may not accurately reflect the diversity of urban populations, which limits the generalisability of the results to larger or different socio-spatial contexts. Moreover, the methodology relies almost exclusively on quantitative data, yet this information could be supplemented with qualitative data, capturing the subjective nuances of how individuals perceive well-being and liveability. This could be developed through open-ended surveys, focus groups or interviews that would provide a more perceptive and emotional version of the results obtained. Finally, the timing of the survey – possibly influenced by post-pandemic perceptions – may have skewed responses on topics such as healthcare, green spaces, or remote work. In conclusion, this study has provided valuable information on how various criteria influence well-being perception for different socioeconomic categories, with important implications for the formulation of public policies geared toward improving the population’s quality of life.
References
2Thinknow (2023). Innovation Cities Index. Melbourne: 2Thinknow. Available at: www.2thinknow.com/innovation-cities-index (Accessed 28 February 2025).
Abass, Z. I., & Tucker, R. (2018). Residential satisfaction in low-density Australian suburbs: the impact of social and physical context on neighbourhood contentment. Journal of Environmental Psychology, 56, 36–45.
Abu-Ghazzeh, T. M. (1999). Housing layout, social interaction, and the place of contact in Abu-Nuseir, Jordan. Journal of Environmental Psychology, 19(1), 41–73.
Acampa, G., & Pino, A. (2023). Optimal computing budget allocation for urban regeneration: An unprecedented match between economic/extra-economic evaluations and urban planning. In: Gervasi, O., Murgante, B., Rocha, A. M. A. C., Garau, C., Scorza, F., Karaca, Y., & Torre, C. M. (Eds.). Computational Science and Its Applications – ICCSA 2023 Workshops. ICCSA 2023. Lecture Notes in Computer Science, vol. 14112. Cham, Springer, 69–79.
Acampa, G., & Pino, A. (2024). Filling the old with new life. Application of original indicators for evaluating ecovillages as village repopulation initiatives. Aestimum, 85, 73–86.
Acampa, G., Pino, A., Alberti, F., & Rossi, G. (2024). The URGET VADEMECUM 2030–2050 Project: Applying Threshold Theory to Sustainable Urban Mobility. In Calabrò, F., Madureira, L., Morabito, F. C., & Piñeira Mantiñán, M. J. (Eds.). Networks, Markets & People. NMP 2024. Lecture Notes in Networks and Systems, vol 1186. Cham, Springer, 172–181.
Ahmed, N. O., El-Halafawy, A. M., & Amin, A. M. (2019). A critical review of urban liveability. European Journal of Sustainable Development, 8(1), 165–182.
Amérigo, M., & Aragonés, J. I. (1990). Residential satisfaction in council housing. Journal of Environmental Psychology, 10, 313–325.
Āzena, L., & Keiss, S. (2009). Specifics of territorial marketing strategy planning. European Integration Studies, 2009(3), 162–168.
Babbie, E. (2021). The practice of social research (15th ed.). Boston, Cengage Learning.
Bartolini, S., & Bilancini, E. (2010). If not only GDP, what else? Using relational goods to predict the trends of subjective well-being. International Review of Economics, 57(2), 199–213.
Battisti, F. (2023). SDGs and ESG criteria in housing: defining local evaluation criteria and indicators for verifying project sustainability using Florence metropolitan area as a case study. Sustainability, 15(12), 9372. https://doi.org/10.3390/su15129372
Battisti, F., Guarini, M. R., & Chiovitti, A. (2017). The assessment of real estate initiatives to be included in the socially-responsible funds. Sustainability, 9, 973–991. https://doi.org/10.3390/su9060973
Blanchard, O., Amighini, A., & Giavazzi, F. (2016). Macroeconomia. Una prospettiva europea. Bologna, Società Editrice il Mulino.
Bonaiuto, M., & Alves, S. (2012). Residential places and neighborhoods: toward healthy life, social integration, and reputable residence. In Clayton, S. D. (Ed.). The Oxford handbook of environmental and conservation psychology. Oxford, Oxford University Press, 221–247.
Bonaiuto, M., Bilotta, E., & Bonnes, M. (2009). Percezione e valutazione dei luoghi urbani per un progettare e abitare riflessivi. In Amendola, G. (Ed.). Il progettista riflessivo: scienze sociali e progettazione architettonica. Bari, Laterza, 75–95.
Bonaiuto, M., Fornara, F., Ariccio, S., Cancellieri, U. G., & Rahimi, L. (2015). Perceived residential environment quality indicators (PREQIs) relevance for UN-HABITAT City Prosperity Index (CPI). Habitat International, 45, 53–63.
Burton, M. (2014). Quality of place. In Michalos, A.C. (Ed.). Encyclopedia of quality of life and Well-Being research. Dordrecht, Springer, 5312–5314. https://doi.org/10.1007/978-94-007-0753-5_2381
Couper, M. P. (2008). Designing effective web surveys. Cambridge, Cambridge University Press.
Cover, T. M., & Thomas, J. A. (2006). Elements of information theory. Hoboken, John Wiley & Sons.
Cummins, R. A. (2000). Objective and subjective quality of life: an Interactive Model. Social Indicators Research, 52, 55–72. https://doi.org/10.1023/A:1007027822521
de Chazal, J. D. (2010). A systems approach to livability and sustainability: defining terms and mapping relationships to link desires with ecological opportunities and constraints. Systems Research and Behavioral Science, 27(5), 585–597.
De Leeuw, E. D., Hox, J. J., & Dillman, D. A. (2012). International handbook of survey methodology. London, Routledge.
Delli Zotti, G. (2020). Metodi e tecniche della ricerca sociale. Trieste, EUT Edizioni Università di Trieste.
Easterlin, R. A. (2013). Happiness and economic growth: The evidence. In Glatzer, W., Camfield, L., Møller, V., & Rojas, M. (Eds.). Global Handbook of Quality of Life. International Handbooks of Quality-of-Life. Dordrecht, Springer.
Easterlin, R. A. (1974). Does economic growth improve the human lot? Some empirical evidence. In David, P. A., & Reder, M. W. (Eds.). Nations and households in economic growth: essays in honor of Moses Abramovitz. New York, Academic Press, 89–125. https://doi.org/10.1016/B978-0-12-205050-3.50008-7
Economist Intelligence Unit (2023). THE GLOBAL LIVEABILITY INDEX 2023. London. Available at: https://www.eiu.com/n/campaigns/global-liveability-index-2023/ (Accessed 28 April 2025).
European Commission (2018). Good practices in mental health and well-being. Available at: https://health.ec.europa.eu/system/files/2018-03/2018_goodpractices_en_0.pdf (Accessed 28 February 2025).
European Social Survey (2018). Il benessere personale e sociale degli europei. Principali risultati del Round 6 della European Social Survey. ESS Topline Result Series n. 5. Available at: https://www.europeansocialsurvey.org/docs/findings/TL5_Wellbeing-Italian.pdf (Accessed 28 April 2025).
Evans, G. W. (2003). The built environment and mental health. Journal of Urban Health, 80(4), 536–555.
Evans, G. W., Wells, N. M., & Moch, A. (2003). Housing and mental health: a review of the evidence and a methodological and conceptual critique. Journal of Social Issues, 59(3), 475–500.
Felici, B., Penna, M., Rao, M., Roberto, R., & Zini, A. (2022). Smart Working: prospettive di cambiamento per la sostenibilità urbana. Un’analisi comparata in 4 province italiane. Roma, ENEA. ISBN: 978-88-8286-431-6
Fowler, F. J. (2014). Survey research methods (5th ed.). Thousand Oaks, Sage Publications.
Francis, J., Giles-Corti, B., Wood, L., & Knuiman, M. (2012). Creating sense of community: the role of public space. Journal of Environmental Psychology, 32(4), 401–409.
Freeman, H. L. (1984). Housing. In Freeman, H. L. (Ed.). Mental health and the environment. London, Churchill Livingstone, 197–225.
Gössling, S., Hall, C. M., & Scott, D. (2012). Tourism and climate change: impacts, adaptation and mitigation. London, Routledge.
Groves, R. M., Fowler, F. J., Couper, M. P., Lepkowski, J. M., Singer, E., & Tourangeau, R. (2009). Survey methodology (2nd ed.). Hoboken, Wiley.
Guarini, M. R., & Battisti, F. (2014). Evaluation and management of land-development processes based on the public-private partnership. Advanced Materials Research, 869-870, 154–161. https://doi.org/10.4028/www.scientific.net/AMR.869-870.154
Guarini, M. R., Battisti, F., & Buccarini, C. (2014). Rome: Re-qualification program for the street markets in public-private partnership. A further proposal for the Flaminio II street market. Advanced Materials Research, 838–841, 2928–2933. https://doi.org/10.4028/www.scientific.net/AMR.838-841.2928
Helliwell, J. F. (2007). Well-being and social capital: Does suicide pose a puzzle? Social Indicators Research, 81(3), 455–496. https://doi.org/10.1007/s11205-006-0022-y
IMD (2023). IMD Smart City Index 2023. Lausanne, IMD. Available at: www.imd.org/smart-city-index (Accessed 10 November 2024).
Inglehart, R., & Klingemann, H. D. (2000). Gender and Well-Being. In Diener, E., & Suh, E. M. (Eds.). Culture and subjective well-being. Cambridge, MA, MIT Press.
International Labour Organization (2019). The centenary declaration for the future of work. Available at: https://www.ilo.org/wcmsp5/groups/public/@ed_norm/@relconf/documents/meetingdocument/wcms_711674.pdf (Accessed 28 February 2025).
ISTAT (2021). Annuario statistico italiano 2021. Available at: https://www.istat.it/it/archivio/annuario+statistico+italiano (Accessed 28 February 2025).
ISTAT (2024). Relazione sul Benessere Equo e Sostenibile (BES) 2024. Available at: https://www.dt.mef.gov.it/export/sites/sitodt/modules/documenti_it/analisi_progammazione/documenti_programmatici/Relazione-BES-2024_finale.pdf (Accessed 28 April 2025).
Jeffrey, K., Abdallah, S., & Quick, A. (2018). Il benessere personale e sociale degli europei: principali risultati del Round 6 della European Social Survey. City, University of London, European Social Survey ERIC.
Larson, R. (1978). Thirty years of research on the subjective well-being of older Americans. Journal of Gerontology, 33, 109–125.
Layard, R. (2005a). Rethinking public economics: the implications of rivalry and habit. Economics and Happiness, 1(1), 147–170.
Layard, R. (2005b). Happiness: lessons from a new science. New York, Penguin.
Lyndhurst, B. (2004). Liveability & sustainable development: bad habits & hard choices. Final report for the Office of the Deputy Prime Minister, London.
Maas, J., Verheij, R. A., Groenewegen, P. P., de Vries, S., & Spreeuwenberg, P. (2006). Green space, urbanity, and health: How strong is the relation? Journal of Epidemiology & Community Health, 60(7), 587-592. https://doi.org/10.1136/jech.2005.043125
Maslow, A. H. (1954). Motivation and Personality. New York, Harper & Row.
Melluso, N., Bonaccorsi, A., Chiarello, F., & Fantoni, G. (2020). Rapid detection of fast innovation under the pressure of COVID-19. PLOS ONE, 15(12), e0244175. https://doi.org/10.1371/journal.pone.0244175
Merriam-Webster (2018). Available at: https://www.merriam-webster.com/dictionary/liveability (Accessed 28 April 2025).
OECD (2019). How’s life in the digital age? Opportunities and risks of the digital transformation for people’s well-being. Paris, OECD Publishing. https://doi.org/10.1787/9789264311800-en
OECD (2021). Economic Policy Reforms 2021. Going for growth: shaping a vibrant recovery. Paris, OECD Publishing.
Okulicz-Kozaryn, A., & Valente, R. R. (2018). Livability and subjective well-being across Europe. Applied Research Quality Life, 14, 197–220. https://doi.org/10.1007/s11482-017-9587-7
Pacione, M. (1990). Urban liveability: a review. Urban Geography, 11(1), 1–30.
Sen, A. (1999). Development as freedom. Oxford, Oxford University Press.
Shannon, C. E. (1948). A mathematical theory of communication. The Bell System Technical Journal, 27(3), 379–423.
Speroni, D. (2019). “Stiglitz due”: la mancata attenzione agli indicatori “oltre il Pil” ha aggravato la crisi economica. Corriere della Sera. Available at: https://numerus.corriere.it/2019/01/02/stiglitz-due-la-mancata-attenzione-agli-indicatori-oltre-il-pil-ha-aggravato-la-crisi-economica/ (Accessed 28 April 2025).
Syamili, M. S., Takala, T., Korrensalo, A., & Tuittila, E. S. (2023). Happiness in urban green spaces: a systematic literature review. Urban Forestry & Urban Greening, vol. 86, art. 128042. https://doi.org/10.1016/j.ufug.2023.128042
The Mori Memorial Foundation (2023). Global Power City Index 2023. Tokyo, Mori Memorial Foundation. Available at: https://mori-m-foundation.or.jp/english/ius2/gpci2/2023.shtml (Accessed 10 November 2024).
United Nations (2015). Risoluzione adottata dall’Assemblea Generale il 25 settembre 2015, 70/1. Trasformare il nostro mondo: l’Agenda 2030 per lo Sviluppo Sostenibile. Available at: https://unric.org/it/wp-content/uploads/sites/3/2019/11/Agenda-2030-Onu-italia.pdf (Accessed 28 February 2025).
Varotto, M. (2019). L’economia del benessere: prospettive europee dopo la strategia Europa 2020. Available at: https://maurovarottoblog.com/2019/12/20/leconomia-del-benessere-prospettive-europee-dopo-la-strategia-europa-2020/ (Accessed 28 February 2025).
Veenhoven, R. (2000). The four qualities of life. Journal of Happiness Studies, 1, 1–39.
Veenhoven, R., & Ehrhardt, J. (1995). The cross-national pattern of happiness: test of predictions implied in three theories of happiness. Social Indicators Research, 34, 33–68.
Viviani, S. (2016). L’Italia dei piccoli comuni e l’urbanistica del cambiamento. Testimonianze, 507/508.
World Bank Group (2019). The World Development Report (WDR) 2019: The Changing Nature of Work. Available at: https://documents1.worldbank.org/curated/en/816281518818814423/2019-WDR-Report.pdf (Accessed 28 February 2025).