https://doi.org/10.36253/aestim-19711
Received: September 23, 2025; Accepted: January 23, 2026; Published: September 11, 2026
The impact of energy certification on the real estate market and its effect in the short-run: an analysis using Big Data and hedonic pricing
Department of Land, Environment, Agriculture and Forestry - TESAF, University of Padua, Italy
E-mail: daniel.vecchiato@unipd.it; carolina.bonardipellizzari@phd.unipd.it; andrea.dominici@unipd.it; tiziano.tempesta@unipd.it
*Corresponding author
Abstract. This study analyses the effect of Energy Performance Certificates (EPC) on residential buildings in Padua (Italy). Introduced by the 2002/91/EC Directive, EPCs became mandatory in European Union countries for buildings for sale or lease. Using web-scraping we collected 5,188 real estate offers in 2022 and 2023, of which 1,738 were in the ‘apartment’ category and suitable for data analysis. We examined EPC effects on prices both in aggregate terms (2022–2023 combined) and by year, to test short-run stability. Results confirm previous findings: a price premium emerges as energy classes improve, with the highest values for top EPC ratings. While most housing characteristics showed stable short-run effects, EPC classes revealed a stronger and more significant impact over time, especially for lower energy classes.
Keywords: appraisal, hedonic pricing, energy, energy performance certificates, big data, web crawling.
Contents
Appendix. Additional statistics and figures
1. Introduction
The last few decades have been marked by an unprecedented increase in energy consumption. According to the International Energy Agency’s (IEA) 2021 report, demand grew even more sharply after COVID-19 years. Coupled with pressures to adopt renewable energy sources and challenges related to ongoing conflicts, such as the war in Ukraine, this has led to rising energy prices and further pressure on the energy transition (IEA, 2021).
To reduce energy consumption while maintaining performance, various technologies and policies have been developed to improve energy efficiency. In the housing sector, energy efficiency can be translated into technologies to improve the sustainability of apartments, houses, or entire buildings in terms of energy use and CO2 emissions. Examples include solar panels, modern heating systems, efficient lighting and appliances, wall insulation, and window frames (Nicolae and George-Vlad, 2015). These technologies are applied not only to new buildings but also to renew older dwellings, resulting in enhanced energy performance, health benefits by improving indoor temperature comfort and creating new green jobs (Meijer et al., 2012).
Energy efficiency initiatives have become increasingly important at the European Union (EU) level, where buildings account for 40% of the EU’s energy consumption and 36% of energy-related greenhouse gas emissions (European Commission, 2021). To reduce energy demand and improve energy efficiency, the EU introduced the Energy Performance Certificate (hereafter EPC), a tool that allows the measurement of the dwelling’s energy efficiency and its comparison with other dwellings. First mentioned in the Energy Performance of Buildings Directive (EPBD) 2002/91/EC, the EPC became mandatory in the EU member states, so any building, house or apartment must have an EPC at the time of sale or lease to inform potential buyers about the energy performance of the dwelling, with a validity of 10 years (European Commission, 2002). The directive was revised in 2010 (Directive 2010/31/EU-Recast), in 2018 (Directive 2018/2002/EU), and in 2024 (Directive 2024/1275/EU). The first laws introduced increased standards, such as stating the EPC in advertisements of dwellings and setting mandatory targets of energy coming from renewable sources (European Commission, 2010, 2018), while the last revised directive aims to achieve more ambitious climate goals, improve energy efficiency, reduce greenhouse gas emissions, and combat energy poverty. In particular, the objective is to reach the targets of cutting greenhouse gas emissions by at least 60% in the building sector by 2030 compared to 2015, while aiming for a fully decarbonized, zero-emission building stock by 2050 (European Commission, 2024). Moreover, other measures in the revised directive include the gradual introduction of minimum energy performance standards for non-residential buildings, and the increase in the average energy performance of the national residential building stock by 16% by 2030 (compared to 2020), and 20-22% by 2035, based on national trajectories (European Commission, 2024).
As an EU member state, Italy adopted the EPC requirements for all properties offered for sale or rent in 2005 (Legislative Decree n.192 of 19 August 2005), then made inclusions in sales and rent advertisements mandatory from 2012 (Legislative Decree n. 28 of 3 March 2011). The EU Directive 2010/31/EU was then adopted in Italy (Legislative Decree n. 63 of 4 June 2013), and the Law n.90 of 3 August 2013 established a new approach for calculating the energy performance of buildings. The Italian EPC is known as APE (Attestato di Prestazione Energetica) and rates energy performance in ten classes, from Class G (worst performance) to A4 (best performance).
Since the creation of EPC in Europe, a price premium was expected for dwellings with higher energy performance due to a greater awareness of the cost savings derived from investments in energy efficiency (Wilkinson and Sayce, 2020). In other words, EPC is not only a policy tool, but could also be a market tool in real estate. In recent decades, many studies have been carried out to analyse the influence of EPC on the listing and transaction prices of dwellings, and most of them recognize a price premium for more energy efficient properties (see the review of Ou et al. (2025)). However, the findings show greater variability in the magnitude of the results. Moreover, few authors found a weak or negligible impact of energy certifications on transaction prices (Fregonara et al., 2014; Marmolejo-Duarte and Chen, 2019a; Olaussen et al., 2017, 2021; Olaussen et al., 2019; Wilhelmsson, 2019).
Within this framework, our study aims to contribute to the debate on the impact of energy performance in the real estate market by providing new insights. In particular, our analyses aim to determine whether the EPC of apartments affects their advertised prices in the city of Padua, Italy. Padua is a medium-sized city in northern Italy, characterized by a mix of newer and older residential buildings. The presence of a major university contributes to a dynamic housing market, influenced by both short and long-term demand. This context provides a relevant setting for examining the impact of EPCs in urban environments. More specifically, our study has two objectives: i) to test if the EPC has an impact on the price of the dwellings; and ii) to test if this effect can be considered stable in the short-run, namely in a year time span (we considered the years 2022 and 2023). To this end, we leverage Big Data in real estate through web scraping algorithms. The use of web scraping in real estate research is a recent development that enables the collection of all dwellings listed for sale or rent on target websites in real time (Chapelle and Eyméoud, 2022; Grybauskas et al., 2021; Jach, 2021; Wei et al., 2022). These recent technologies involving Big Data facilitate the collection of larger samples in a shorter amount of time and help reduce mistakes associated with manual data collection (Khder, 2021). Moreover, web scraping can be a suitable approach for obtaining reliable data to analyze price dynamics in a context like Italy, where access to real transaction contracts is limited, costly, and subject to some limitations for professionals.
The remainder of this paper is structured as follows: the second section (Section 2) offers a review of the literature involving the influence of energy efficiency on dwelling values and whether there is a market premium for those presenting higher energy performance certificates, with a special focus on Italy. The third section (Section 3) includes the methodology, from data collection involving web scraping of Big Data to the regression analysis through hedonic models. The fourth section (Section 4) presents the characteristics of the housing market in the study area, and which characteristics are influential on apartments’ price per m2 in Padua, including energy efficiency. Finally, the last section (Section 5) builds on the results and presents conclusions and suggestions for further research.
2. Background
In the literature, several studies have investigated the influence of the EPC on the real estate market. The findings provided have to be evaluated in the framework in which each study was conducted, namely considering the data used, the geographic area, the variables included, and the methodology implemented. For example, economic trends of a specific area, demography, cultural influences, and household behaviours may significantly impact real estate, limiting comparisons between different areas.
The literature reveals significant differences in how energy efficiency affects property prices depending on the type of dwelling. Evangelista et al. (2020) found that in Portugal, energy-efficient apartments (rated A and B) command higher price premiums when compared to less efficient properties, equal to 13.1% for new and 12.5% for existing units. In contrast, houses show more modest increases, with premiums of 5.7% for new and 4.6% for existing units. In the UK, Perez et al. (2025) observed that detached houses yield slightly higher capitalization coefficients for EPC bands compared to flats; however, all property types exhibit positive price premiums for higher energy performance, confirming the capitalization of EPC across the housing market. Still in the UK, McCord et al. (2020) highlighted a complex relationship between property type, energy efficiency, and price, arguing that different dwelling types have varying likelihoods of presenting a certain energy performance rating.
Besides those just mentioned, other studies in Europe also point to price premiums and show differences between residential and commercial buildings, as well as between sales and rental markets. For residential buildings, improved energy efficiency is associated with price increases of approximately 3-8%, while rental premiums range from 3-5%. The increase in prices is higher for commercial buildings, with premium prices above 10% and rental prices being positively affected by 2-5% (Zancanella et al., 2018). Other studies also suggest that premiums tend to be larger in the sales market than in the rental market. For instance, Gerassimenko et al. (2024) found that in the Belgian sales market, compared to D-rated properties, the A, B, and C-labeled dwellings have a price premium of 42.70%, 27.27%, and 11.02%, respectively. In contrast, rental premiums for A, B, and C-labeled dwellings were 13.38%, 8.97%, and 5.24%, respectively. Stenvall et al. (2022), in a study conducted in Sweden, argue that the lower premiums observed for tenant-owned apartments may be partly explained by the fact that heating costs are typically included in the monthly fee paid to the tenant association, which tends to remain stable in the short term. Beyond direct energy expenditure, this premium for energy-efficient rentals, or lower values for energy-inefficient homes, seems to have increased in recent years. This trend may be explained by EPC regulations, which enhance transparency by allowing tenants to assess energy performance prior to renting, as well as by a growing awareness of environmental issues (Pommeranz and Steininger, 2021). This capitalization of energy efficiency over time has also been observed in other rental markets, such as in the UK and the Netherlands (Chegut et al., 2020). Furthermore, the relationship between EPC ratings and price premiums may vary depending on the location of the dwelling. For instance, the premium tends to be weaker in city centres and stronger in the rural or peripheral areas of Germany and Spain, due to the housing shortage and the higher purchasing power per capita found in the city (Marmolejo-Duarte and Chen, 2019a; Taruttis and Weber, 2022). Differences were also found according to the climatic areas in Spain, with a higher premium on the asking price for the coastal area compared to the cooler climatic zone, related to weather instabilities along the coast and a worse isolation system installed in the houses (de La Paz et al., 2019).
At the country level, Taruttis and Weber (2022), using a hedonic price model with 422,242 comparables from 2009 to 2017 in Germany, found that if energy efficiency increases by 100 kWh/m2 per year, asking prices for single-family homes increase by 6.9% on average. In the UK, a unit increase in the numerical energy performance score (from 1 to 100) showed a 0.18% increase in the transaction price per unit area (Goel, 2023). In Portugal, dwellings with better energy performance (based on EPC) had a higher transaction price per m2, and those associated with non-green housing decreased the sales value (Koengkan and Fuinhas, 2022). In Spain, the premium on the listing prices is equal to 1.7% for each EPC ranking (Marmolejo-Duarte et al., 2019b). However, some studies that also used hedonic models showed that EPC only modestly impacted listing prices (Fregonara et al., 2014; Marmolejo-Duarte and Chen, 2019a) or did not affect price (Olaussen et al., 2017, 2021; Olaussen et al., 2019; Wilhelmsson, 2019).
In Italy, a general picture was provided by Loberto et al. (2023), who analysing 2.5 million listings between 2018 and 2022, found that for houses with energy label A the premium is about 25% compared to houses with energy label G. However, they found a very heterogeneous effect throughout the country, partly explained by the different climate conditions that characterized different areas of Italy. Other scholars have studied the impact of EPC certification on house price focusing on specific cities or areas: Turin, Bolzano, Padua, Bari, and Reggio Calabria. The first study to analyse EPC ratings on real estate was carried out in 2014 in the city of Torino by Fregonara et al. (2014), using 577 comparables collected in 2012, the year that marked the beginning of the inclusion of EPC in advertisements for dwellings for sale in Italy. The results revealed a weak relationship between the listing price and high energy efficiency levels. An explanation for this was that potential buyers were not yet aware that a higher investment in energy-efficient houses would result in lower maintenance costs in the future, and as such, this was not reflected in the listings of real estate agencies (Fregonara et al., 2014). Later, in 2017, Fregonara et al. (2017) found the same weak relationship, but this time using real transaction data instead of listing prices. However, Dell’Anna et al. (2019) using 15,288 listing prices found that the impact of the energy class on prices in Turin was, according to the methodology implemented (hedonic price method and spatial model), equal to +6.8% and +6.3% respectively for each class jump from G to A. Therefore, considering six EPC class jumps, the maximum price increase from the lowest class (G) to the highest (A) is, respectively, 40.8% and 37.8%. This maximum price of property value decreased to 25.2% (+4.2% increase for each incremental improvement in the EPC rating scale) in a following study of Dell’Anna (2025), who used machine learning techniques on 2,783 listings. Also, Barreca et al. (2021) highlighted a price premium for Turin, with low EPC labels (E, F and G) significantly and negatively affecting listing prices (-3.3% in the hedonic model, -2.7% in the spatial model) compared to the C-D labels taken as reference, while high EPC labels (B, A1, A2, A3 and A4) present a positive influence on them (+6.2% in the spatial model). The depreciating effect on house prices caused by lower energy efficiency in Turin was recently confirmed by Loro et al. (2024), with a sample of 100 listing prices. Still in Northern Italy, Bisello et al. (2020) used hedonic models to detect the impact of EPC on 825 listing prices in Bolzano. A premium of around 6% was found for properties moving from the worst energy performance class (G) to the best (A), while the premium price for class B is almost 5%, and for class C around 2.8%. It should be noted that in the dataset analysed by Bisello et al. (2020), collected in 2018, nearly 80% of observations were in class G, while only about 10% were in class A-B.
Specifically in Padua, Copiello and Bonifaci (2015) by using the hedonic price model found not only that EPC has a statistically significant influence on house asking prices, but also that it can reach up to 21.9% of the premium price if the dwelling is class A (the highest EPC) compared to class G (the lowest EPC). The premium price detected for class B is slightly lower (+20.2%), while class C and class D increase the price by 17.4% and 17.1%, respectively. The premium price drops to 9.5% for the properties of class F and to 2.3% for level E, compared to the G class. In 2021, Copiello and Donati (2021) confirmed the trend but detected higher value magnitudes. Specifically, compared to the G label, they found a price premium of 14.8% for the F label, 24.3% for the E class, 30.1% for the D class, and 32.3% in the energy class C. For an EPC equal to B and A, the impact of listing prices is higher at 61.1% and 61.7%, respectively. More recently, Copiello and Coletto (2023), by using different models, found a premium between 54.7% and 53.4% for the A4 properties (the most efficient class) compared to class D, a premium between 42.0% and 45.3% for the A to A3 bands, and a decrease in unit price between 29.3% and 10.8% for the G band.
Moving from Northern to Southern Italy, in the city of Bari, Manganelli et al. (2019) found an impact of EPC on transaction prices, increasing the price premium moving from levels G to levels A. However, they show different dynamics according to the area of the city considered. For dwellings in the central area of Bari, the price premium slightly increases from class G to class F, then remains unchanged up to class C, until it skyrockets in class A (+29.4% compared to class G). In the suburban area of Bari, the marginal contribution of the EPC is quite constant moving from level G to level A, reaching a price premium of +45.5% for this last class. Morano et al. (2019) further investigate the role of the EPC in the transaction prices of housing in Bari, identifying premiums of 27.94% for the A level and of −26.44% for the G label with respect to a macro-aggregation of all other central EPC classes. In Reggio Calabria, a dataset of 515 comparables of residential properties derived from information communicated by direct actors, such as buyers and sellers, promoters, realtors, agencies, and notaries, was collected and analysed by means of an evolutionary polynomial regression. The authors found a premium of 41.52% on sale prices of properties presenting the highest energy performances (EPC class A or B) (Massimo et al., 2022).
Most of the studies found in Italy used the hedonic price model as a methodological approach (Bisello et al., 2020; Copiello and Bonifaci, 2015; Dell’Anna et al., 2019; Fregonara et al., 2017), even if some of them have been integrated with spatial specifications. Considering the data source, except for a few studies that used real transactions, the most frequent approach was to rely on samples derived from listing prices, in line with findings of Fregonara and Rubino (2021), who conducted a systematic review of studies published between 2016 and 2021 investigating the relationship between energy efficiency and real estate prices. Specifically in Italy, this is explained by the challenges involved in obtaining such data, since the transaction prices are not publicly available in the country and the procedures to access and collect the transaction data make it difficult to use in hedonic models (Bisello et al., 2020; Manganelli et al., 2019).
3. Materials and Methods
The present study applies the Hedonic Pricing Method (HPM), originally developed by Court (1939) (see also Goodman (1998)), to a dataset created using Big Data, specifically listing prices collected by web scraping (Diouf et al., 2019; Gonzalez and Erba, 2024; Khalil and Fakir, 2017) from a leading real estate advertising website in Italy. In the following subsections we will describe the data collection approach, the sample of data analysed and the specification of the hedonic models applied during data analysis.
3.1 Data collection
A custom crawler was developed in the Python programming language to collect the data used in this study. This crawler was specifically tuned to harvest real estate listings from a specialized Italian website. Data were collected focusing on residential listings in the municipality of Padua, a medium-sized city with a relatively dynamic real estate market located in the Veneto region, Northern Italy. The data collection was performed in two rounds, first on the 14th of February 2022 and then on the 13th of February 2023. The 2022 collection resulted in a dataset of 2,000 real estate offers, of which 1,318 fell into the ‘apartment’ category. The distinction is essential, as it would be incorrect to compare properties from different categories, such as apartments with detached houses or attics. Considering the 2023 data collection, the initial dataset consisted of 3,188 records, 2,000 of which were falling in the ‘apartment’ category. Aggregating the 2022 and 2023 datasets (3,318 records), we then performed some further data-cleaning removing all records with missing data like price or surface, and limited the final dataset to dwellings with a surface greater than or equal to 30 m2 and a minimum price of 12,000 €. Such cleaning left 1,835 potentially usable records. From such a dataset of 1,835 real estate offers, we performed a further analysis to detect if some dwellings were unsold in 2022 and still present in the database of 2023: 97 records were present in both years and, therefore, we kept only the 2022 version of the data. The final dataset consisted of 1,738 records, 705 for the year 2022 and the remaining 1,033 for the year 2023. Therefore, from an initial dataset of 5,188 records (aggregating 2022 and 2023), only 33.5% of the data (1,738 records) was usable in our data analysis.
The use of web scraping algorithms allowed to collect a huge amount of data in a short time: the most time-consuming aspect was the development of the web-crawler, but once it was implemented it required a short time to feed a database for data analysis. Another advantage of this method is that the crawler can be used in future data collection, saving time during future research activities. Since just 33.5% of the collected data were suitable for our data analysis due to missing or incomplete data, this should be taken into consideration as a limitation. However, a similar issue could be encountered when analysing real transaction contracts, at least in Italy, where some data could be missing or difficult to understand without visiting or knowing the real estate. The greatest criticism or limitation of this data collection methodology lies on the fact that the listing price will often differ from the final transaction price of the real estate. This is because listing prices could be defined as the ‘wish prices’ of sellers, which can change after a proper exposure of the listing and the eventual bargain process between seller and buyer. Nevertheless, a listing price that greatly differs from the real value of the real estate would lead to delays in the selling times and, in the worst scenario, prevent the property from getting sold. According to some informal discussions with real estate agents, listing prices differ from real prices by 10% on average. This figure is supported by the Bank of Italy’s quarterly report (Banca d’Italia, 2025). According to feedback from real estate agents, the average margin was 8% in Q1 2022 and 8.2% in Q1 2023. Importantly, the Bank of Italy’s data indicates that the divergence between transaction prices and listing prices exhibits both temporal and spatial variation. Despite this discrepancy with transaction prices, listing prices could offer important information about the relative value of the property characteristic and could be quite easily accessible. As a consequence of the previous consideration, the marginal prices derived in absolute (and not relative) terms from listing prices should be used with caution, while the opposite applies while doing consideration in relative terms, namely working with percentages as we did in this study.
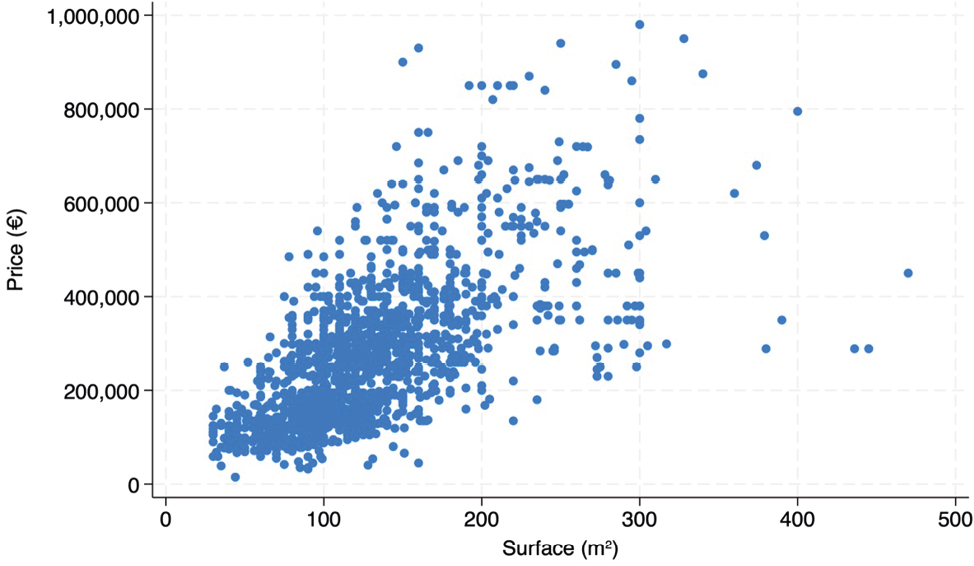
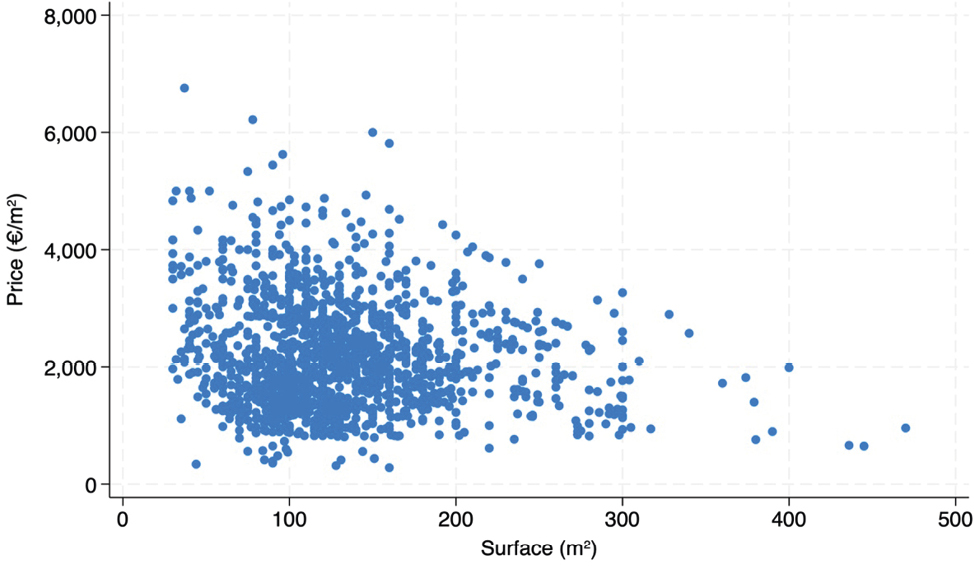
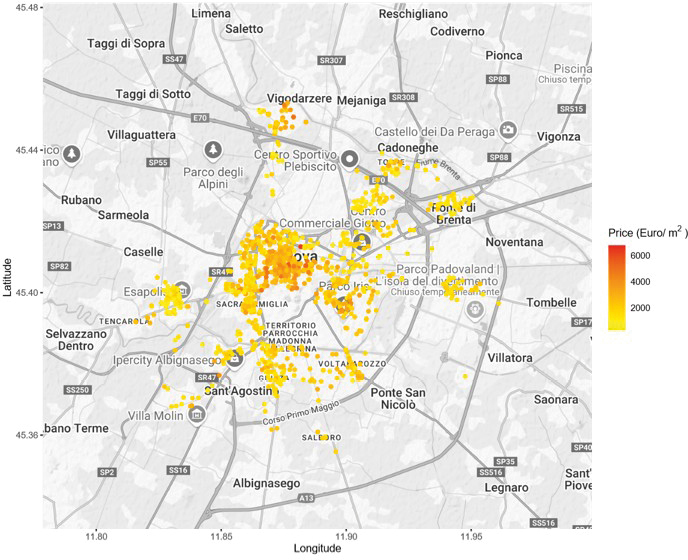
The summary statistics of the collected data, suitable for the analysis of the hedonic pricing model, are summarized in Table 1 and Table 2 for the continuous and discrete variables, respectively. The average list price for the full sample is about €277,558.7 per housing unit (Figure 1 and Figure A1 in the Appendix), with an average unit price (per square meter) equal to €2,153.6 (Figure 2, and Figure A2 in the Appendix). Focusing on the distribution of the EPC in the full sample, it should be noted that almost a quarter (24.1%) of the listed property presents the highest level of EPC A, while the dwellings with the EPC labels B and C cover a small share of the market (2.4% and 3.1%, respectively). However, most of the dwellings (27.4%) are in the lowest energy category, G, and about a third of the sample is represented by classes E and F (13.4% and 19.9%, respectively). The spatial distribution of the data is presented in Figure 3.
| Variable | n | Min | q1 | Median | Mean | q3 | Max | SD | Missing |
|---|---|---|---|---|---|---|---|---|---|
| Full sample | |||||||||
| Listing Price (€) | 1,738 | 15,000.0 | 160,000.0 | 258,000.0 | 277,558.7 | 355,000.0 | 980,000.0 | 152,941.1 | 0 |
| Listing Price (€/m2) | 1,738 | 281.2 | 1,466.7 | 2,037.7 | 2,153.6 | 2,706.0 | 6,756.8 | 909.1 | 0 |
| Surface (m2) | 1,738 | 30.0 | 95.0 | 124.0 | 132.9 | 160.0 | 470.0 | 58.4 | 0 |
| Bathrooms | 1,738 | 1.0 | 1.0 | 2.0 | 1.9 | 2.0 | 4.0 | 0.7 | 0 |
| Year = 2022 | |||||||||
| Listing Price (€) | 705 | 59,000.0 | 150,000.0 | 249,000.0 | 269,393.3 | 325,000.0 | 980,000.0 | 150,599.6 | 0 |
| Listing Price (€/m2) | 705 | 613.6 | 1,486.5 | 2,000.0 | 2,136.8 | 2,615.4 | 6,217.9 | 877.6 | 0 |
| Surface (m2) | 705 | 30.0 | 95.0 | 122.0 | 130.6 | 155.0 | 445.0 | 56.7 | 0 |
| Bathrooms | 705 | 1.0 | 1.0 | 2.0 | 1.9 | 2.0 | 4.0 | 0.7 | 0 |
| Year = 2023 | |||||||||
| Listing Price (€) | 1,033 | 15,000.0 | 165,000.0 | 260,000.0 | 283,131.5 | 368,000.0 | 950,000.0 | 154,343.3 | 0 |
| Listing Price (€/m2) | 1,033 | 281.2 | 1,454.5 | 2,063.5 | 2,165.0 | 2,743.4 | 6,756.8 | 930.2 | 0 |
| Surface (m2) | 1,033 | 30.0 | 96.0 | 125.0 | 134.5 | 160.0 | 470.0 | 59.6 | 0 |
| Bathrooms | 1,033 | 1.0 | 1.0 | 2.0 | 1.8 | 2.0 | 4.0 | 0.7 | 0 |
| Variable | Levels | Full sample | year=2022 | year=2023 | ||||||
|---|---|---|---|---|---|---|---|---|---|---|
| n | % | å% | n | % | å% | n | % | å% | ||
| Zone | Camin, Zona Industriale | 45 | 2.6 | 2.6 | 11 | 1.6 | 1.6 | 34 | 3.3 | 3.3 |
| Forcellini, San Camillo, Nazareth, Terranegra | 145 | 8.3 | 10.9 | 66 | 9.4 | 10.9 | 79 | 7.7 | 10.9 | |
| Guizza, Crocifisso, Ponte Quattro Martiri, Voltabarozzo, Salboro | 221 | 12.7 | 23.6 | 98 | 13.9 | 24.8 | 123 | 11.9 | 22.9 | |
| Piazza Mazzini, Ospedale Militare, Porta Trento, Stazione | 76 | 4.4 | 28.0 | 33 | 4.7 | 29.5 | 43 | 4.2 | 27.0 | |
| Piazze, Duomo, Santo, Santa Sofia, Altinate, Savonarola, Ponte Molino | 390 | 22.4 | 50.5 | 149 | 21.1 | 50.6 | 241 | 23.3 | 50.3 | |
| Sacra Famiglia, Basso Isonzo, Brusegana, Aeroporto, Paltana, Mandria | 278 | 16.0 | 66.5 | 135 | 19.1 | 69.8 | 143 | 13.8 | 64.2 | |
| Sacro Cuore, Altichiero | 106 | 6.1 | 72.6 | 41 | 5.8 | 75.6 | 65 | 6.3 | 70.5 | |
| Scrovegni, Portello, Ospedali, Stanga, Pio X | 160 | 9.2 | 81.8 | 57 | 8.1 | 83.7 | 103 | 10.0 | 80.4 | |
| Specola, Riviere, San Giuseppe, San Giovanni | 144 | 8.3 | 90.1 | 43 | 6.1 | 89.8 | 101 | 9.8 | 90.2 | |
| Torre, Mortise, Ponte di Brenta | 173 | 9.9 | 100.0 | 72 | 10.2 | 100.0 | 101 | 9.8 | 100.0 | |
| all | 1,738 | 100.0 | 705 | 100.0 | 1,033 | 100.0 | ||||
| Elevator | 0 (absent) | 791 | 45.5 | 45.5 | 307 | 43.5 | 43.5 | 484 | 46.9 | 46.9 |
| 1 (present) | 947 | 54.5 | 100.0 | 398 | 56.5 | 100.0 | 549 | 53.1 | 100.0 | |
| all | 1,738 | 100.0 | 705 | 100.0 | 1,033 | 100.0 | ||||
| Alarm | 0 (absent) | 1416 | 81.5 | 81.5 | 562 | 79.7 | 79.7 | 854 | 82.7 | 82.7 |
| 1 (present) | 322 | 18.5 | 100.0 | 143 | 20.3 | 100.0 | 179 | 17.3 | 100.0 | |
| all | 1,738 | 100.0 | 705 | 100.0 | 1,033 | 100.0 | ||||
| Energy label | >=A | 418 | 24.1 | 24.1 | 159 | 22.6 | 22.6 | 259 | 25.1 | 25.1 |
| B | 42 | 2.4 | 26.5 | 24 | 3.4 | 25.9 | 18 | 1.7 | 26.8 | |
| C | 54 | 3.1 | 29.6 | 29 | 4.1 | 30.1 | 25 | 2.4 | 29.2 | |
| D | 169 | 9.7 | 39.3 | 58 | 8.2 | 38.3 | 111 | 10.8 | 40.0 | |
| E | 233 | 13.4 | 52.7 | 106 | 15.0 | 53.3 | 127 | 12.3 | 52.3 | |
| F | 345 | 19.9 | 72.6 | 120 | 17.0 | 70.3 | 225 | 21.8 | 74.0 | |
| G | 477 | 27.4 | 100.0 | 209 | 29.6 | 100.0 | 268 | 25.9 | 100.0 | |
| all | 1,738 | 100.0 | 705 | 100.0 | 1,033 | 100.0 | ||||
The distribution of listings across energy labels appears to be consistent with the data from the official EPC register for the city of Padua (Regione del Veneto, 2025) considering residential buildings (Table A1). Each year, the register includes EPCs related to properties involved in various types of real estate operations: not only property sales, but also new rental contracts, new constructions, and major renovations. Furthermore, the EPC register includes a broader range of properties compared to our dataset: not only those actively for sale, and it aggregates all different types of residential buildings (apartments, detached houses, etc), while in our dataset we only consider residential apartments for sale. Notably, the representation of high-performing dwellings is greater in our dataset, where these classes account for an average of 24.1% (about 14% in the registered EPCs) in the full sample, while the lower-class F is underrepresented (19.9% vs 26%). This discrepancy is likely due that more energy efficient properties are overrepresented in real estate listings, which tend to reflect more dynamic segments of the market. The under-representation of class F and over-representation of class G might be because when an EPC is missing, agents can still advertise the apartment but are required to obtain the EPC within one month, and have to insert in the listing the lowest energy class G.
3.2 The Hedonic Pricing Model
While other approaches could have been considered to accomplish the objective of our study, we decided to rely on the HPM approach. Typically, HPMs are estimated using linear or semi-logarithmic models. Specifically, we investigated the impact of different characteristics on dwelling price formation ceteris paribus. In this context, the HPM approach offers clear advantages over, for example, machine learning approaches (e.g., Neural Networks or Random Forests), particularly when the focus is on the interpretability of coefficients to quantify the specific economic value added by structural or locational attributes. When the focus is on prediction accuracy, machine learning models may offer marginally superior performance, but they often lack the transparency required to isolate the ceteris paribus effect of individual independent variables.
The HPM approach, made popular in the early 1960s through applications of Griliches (1958), is founded on the principles of ‘Lancaster’s Consumer Theory’ (Lancaster, 1966) and theoretical insights from Rosen (1974). According to Lancaster, the utility a consumer derives from a good depends on its characteristics, making it possible to hypothesize that the value a consumer associates with a good depends on its characteristics. In this context, when HPM is applied to real estate, it derives the marginal price of each characteristic of a good, establishing the following functional form within a regression equation:
(1)
where P, the listing price of the real estate good, is a function of its intrinsic characteristics Xi and its extrinsic characteristics Yj.
In more detail, the marginal value of a property’s characteristic can be estimated using the following regression equation, which assumes an additive and linear relationship between the price and the good’s characteristics:
(2)
where K is a constant term (intercept), and βs represent the coefficients estimated by the regression equation, which correspond to the marginal values of the characteristics of the good in economic terms, and ε represents the stochastic error.
When Eq. 2 assumes the dependent variable P as logarithmic, the β-coefficients can be interpreted as the percentage change in the value of P for a unit change in the independent variable. More properly, as described by Halvorsen and Palmquist (1980), the estimated coefficients can be interpreted as the percentage variation of the dependent variable (Y) due to a marginal change in categorical or dummy variables. This interpretation holds accurately for small coefficient values (up to about 0.25, namely 25%); while for larger values, the percentage should be computed as:
(3)
If we assume the dependent variable P as logarithmic, Eq. 2 therefore becomes:
(4)
We used the standardised dependent variable listing price per square meter (P/m2), and therefore Eq. 2 becomes:
(5)
In our analysis, we modelled the relationship between the listing price of apartments and their characteristics as specified in Eq.5, and we estimated the hedonic model considering the following characteristics:
1. the marketable surface of the apartment (m2)
2. the EPC class
3. the number of toilets/bathrooms in the apartment
4. the presence or absence of an elevator
5. the presence or absence of an alarm system
6. the city zone where the apartment is located.
Other variables were considered in the analysis but were ultimately excluded from the final model due to their lack of statistical significance. For example, the “status” of the dwelling was not considered for two reasons: first, because, at least in Italy, this variable cannot be deduced from the purchase contract, and therefore this characteristic is not observable in the appraisal profession without an in-person and in-situ inspection of each comparable (in other words, to ensure the realism of the valuation, given that for professional purposes real transactions, rather than listing prices should be used); second, because it exhibits a high degree of collinearity with the EPC variable.
Considering our specification of the hedonic model, it should be clarified that dummy or factor variables were used in Eq. 4 to model all categorical variables, namely, all variables except the surface of the dwelling and the number of bathrooms.
4. Results
Considering the first objective of the study, the hedonic regression method was used to investigate whether the EPC of the buildings affects their advertised price. The results of the estimated models are reported in Table 3 (the same results considering EPC class D as reference rather than G are reported in Table A3 in the Appendix for comparison purposes with other studies), while the estimated percentage changes estimated applying equation (3), according to Halvorsen and Palmquist (1980), are reported in Table 4. In addition, Figure 4 displays the coefficients estimated in Table 3. Models’ performance (Table 3) was assessed using standard goodness-of-fit indicators. The models explain a substantial share of the variance in the dependent variable (R² ranging from 0.529 to 0.622; Adjusted R² between 0.521 and 0.612). While these values indicate a moderate goodness-of-fit, they are consistent with standard empirical findings in hedonic price analyses utilizing cross-sectional data. The unexplained variance is largely attributable to unobserved heterogeneity inherent to the real estate market (e.g., interior condition, architectural style, or seller motivation), which cannot be fully captured by structural variables. Crucially, the statistical significance of nearly all independent variables confirms the robustness of the model specification. This indicates that, despite the unobserved heterogeneity reflected in the R2, the identified structural and locational drivers are reliable and precise determinants of value. Furthermore, we performed a Variance Inflation Factor (VIF) analysis on the full sample model presented in Tables 3 to assess multicollinearity among the independent variables. The mean VIF is 1.66 (see Table A2 in the Appendix), with all individual values falling well below the critical threshold of 5. This indicates that multicollinearity does not affect the stability or significance of the estimates, confirming the robustness of our HPM specification.
| Dependent variable: ln(P/m2) | |||||||||||||||||||
|---|---|---|---|---|---|---|---|---|---|---|---|---|---|---|---|---|---|---|---|
| Full sample | year=2022 | year=2023 | |||||||||||||||||
| Constant | 7.126*** | 7.185*** | 7.102*** | ||||||||||||||||
| [7.063, 7.189] | [7.100, 7.271] | [7.013, 7.191] | |||||||||||||||||
| Surface (m2) | -0.003*** | -0.003*** | -0.003*** | ||||||||||||||||
| [-0.003, -0.003] | [-0.003, -0.002] | [-0.004, -0.003] | |||||||||||||||||
| Bathrooms | 0.149*** | 0.091*** | 0.170*** | ||||||||||||||||
| [0.118, 0.179] | [0.047, 0.136] | [0.129, 0.212] | |||||||||||||||||
| Zone: Camin, Zona Industriale | 0.082 | 0.060 | 0.091 | ||||||||||||||||
| [-0.017, 0.181] | [-0.102, 0.223] | [-0.036, 0.218] | |||||||||||||||||
| Zone: Forcellini, San Camillo, Nazareth, Terranegra | 0.417*** | 0.400*** | 0.441*** | ||||||||||||||||
| [0.350, 0.484] | [0.314, 0.485] | [0.342, 0.540] | |||||||||||||||||
| Zone: Guizza, Crocifisso, Ponte Quattro Martiri, Voltabarozzo, Salboro | 0.195*** | 0.181*** | 0.209*** | ||||||||||||||||
| [0.134, 0.255] | [0.102, 0.260] | [0.123, 0.296] | |||||||||||||||||
| Zone: Piazza Mazzini, Ospedale Militare, Porta Trento, Stazione | 0.402*** | 0.383*** | 0.423*** | ||||||||||||||||
| [0.319, 0.485] | [0.275, 0.490] | [0.303, 0.543] | |||||||||||||||||
| Zone: Piazze, Duomo, Santo, Santa Sofia, Altinate, Savonarola, Ponte Molino | 0.778*** | 0.806*** | 0.764*** | ||||||||||||||||
| [0.721, 0.835] | [0.731, 0.882] | [0.683, 0.845] | |||||||||||||||||
| Zone: Sacra Famiglia, Basso Isonzo, Brusegana, Aeroporto, Paltana, Mandria | 0.174*** | 0.175*** | 0.166*** | ||||||||||||||||
| [0.116, 0.232] | [0.101, 0.250] | [0.082, 0.251] | |||||||||||||||||
| Zone: Sacro Cuore, Altichiero | 0.199*** | 0.161*** | 0.234*** | ||||||||||||||||
| [0.124, 0.274] | [0.061, 0.260] | [0.128, 0.340] | |||||||||||||||||
| Zone: Scrovegni, Portello, Ospedali, Stanga, Pio X | 0.118*** | 0.253*** | 0.055 | ||||||||||||||||
| [0.052, 0.184] | [0.162, 0.344] | [-0.036, 0.146] | |||||||||||||||||
| Zone: Specola, Riviere, San Giuseppe, San Giovanni | 0.442*** | 0.408*** | 0.459*** | ||||||||||||||||
| [0.374, 0.511] | [0.308, 0.508] | [0.367, 0.551] | |||||||||||||||||
| Zone: Torre, Mortise, Ponte di Brenta | reference | ||||||||||||||||||
| EPC: >=A | 0.506*** | 0.473*** | 0.517*** | ||||||||||||||||
| [0.459, 0.553] | [0.410, 0.536] | [0.449, 0.585] | |||||||||||||||||
| EPC: B | 0.361*** | 0.312*** | 0.361*** | ||||||||||||||||
| [0.265, 0.458] | [0.202, 0.421] | [0.200, 0.522] | |||||||||||||||||
| EPC: C | 0.253*** | 0.183*** | 0.321*** | ||||||||||||||||
| [0.167, 0.339] | [0.080, 0.287] | [0.185, 0.457] | |||||||||||||||||
| EPC: D | 0.245*** | 0.165*** | 0.279*** | ||||||||||||||||
| [0.192, 0.299] | [0.089, 0.241] | [0.205, 0.352] | |||||||||||||||||
| EPC: E | 0.091*** | 0.077** | 0.095*** | ||||||||||||||||
| [0.043, 0.139] | [0.016, 0.139] | [0.025, 0.166] | |||||||||||||||||
| EPC: F | 0.071*** | 0.026 | 0.097*** | ||||||||||||||||
| [0.029, 0.113] | [-0.032, 0.084] | [0.039, 0.155] | |||||||||||||||||
| EPC: G | reference | ||||||||||||||||||
| Elevator (present) | 0.103*** | 0.093*** | 0.093*** | ||||||||||||||||
| [0.070, 0.135] | [0.049, 0.136] | [0.047, 0.139] | |||||||||||||||||
| Alarm System (present) | 0.033* | 0.087*** | 0.005 | ||||||||||||||||
| [-0.005, 0.070] | [0.037, 0.138] | [-0.049, 0.059] | |||||||||||||||||
| Observations | 1,738 | 705 | 1,033 | ||||||||||||||||
| R2 | 0.550 | 0.622 | 0.529 | ||||||||||||||||
| Adjusted R2 | 0.545 | 0.612 | 0.521 | ||||||||||||||||
| AIC | 758.055 | 84.128 | 622.167 | ||||||||||||||||
| BIC | 867.265 | 175.292 | 720.972 | ||||||||||||||||
| Note: 95% confidence intervals in brackets. * p < 0.10, ** p < 0.05, *** p < 0.01. | |||||||||||||||||||
| Dependent variable: ln(P/m2) | |||||||||||||||||||
|---|---|---|---|---|---|---|---|---|---|---|---|---|---|---|---|---|---|---|---|
| % change† | |||||||||||||||||||
| (Full sample) | (year=2022) | (year=2023) | |||||||||||||||||
| Surface (m2) | −0.309 | −0.257 | −0.325 | ||||||||||||||||
| Bathrooms | 14.871 | 9.137 | 17.039 | ||||||||||||||||
| Zone: Camin, Zona Industriale | - | - | - | ||||||||||||||||
| Zone: Forcellini, San Camillo, Nazareth, Terranegra | 51.769 | 49.123 | 55.413 | ||||||||||||||||
| Zone: Guizza, Crocifisso, Ponte Quattro Martiri, Voltabarozzo, Salboro | 21.506 | 19.821 | 23.303 | ||||||||||||||||
| Zone: Piazza Mazzini, Ospedale Militare, Porta Trento, Stazione | 49.524 | 46.613 | 52.657 | ||||||||||||||||
| Zone: Piazze, Duomo, Santo, Santa Sofia, Altinate, Savonarola, Ponte Molino | 117.745 | 124.002 | 114.665 | ||||||||||||||||
| Zone: Sacra Famiglia, Basso Isonzo, Brusegana, Aeroporto, Paltana, Mandria | 18.970 | 19.172 | 18.085 | ||||||||||||||||
| Zone: Sacro Cuore, Altichiero | 21.994 | 17.417 | 26.349 | ||||||||||||||||
| Zone: Scrovegni, Portello, Ospedali, Stanga, Pio X | 12.514 | 28.815 | - | ||||||||||||||||
| Zone: Specola, Riviere, San Giuseppe, San Giovanni | 55.657 | 50.403 | 58.229 | ||||||||||||||||
| Zone: Torre, Mortise, Ponte di Brenta | reference | ||||||||||||||||||
| EPC: >=A | 65.833 | 60.429 | 67.656 | ||||||||||||||||
| EPC: B | 43.504 | 36.551 | 43.475 | ||||||||||||||||
| EPC: C | 28.799 | 20.131 | 37.865 | ||||||||||||||||
| EPC: D | 27.777 | 17.907 | 32.130 | ||||||||||||||||
| EPC: E | 9.516 | 8.038 | 10.013 | ||||||||||||||||
| EPC: F | 7.323 | - | 10.173 | ||||||||||||||||
| EPC: G | reference | ||||||||||||||||||
| Elevator (present) | 10.820 | 9.721 | 9.738 | ||||||||||||||||
| Alarm System (present) | 3.307 | 9.139 | - | ||||||||||||||||
| Note: † For categorical and dummy variables, the percentage change was calculated using Eq. 3. | |||||||||||||||||||
| Reference levels and statistically not significant coefficients were omitted. | |||||||||||||||||||
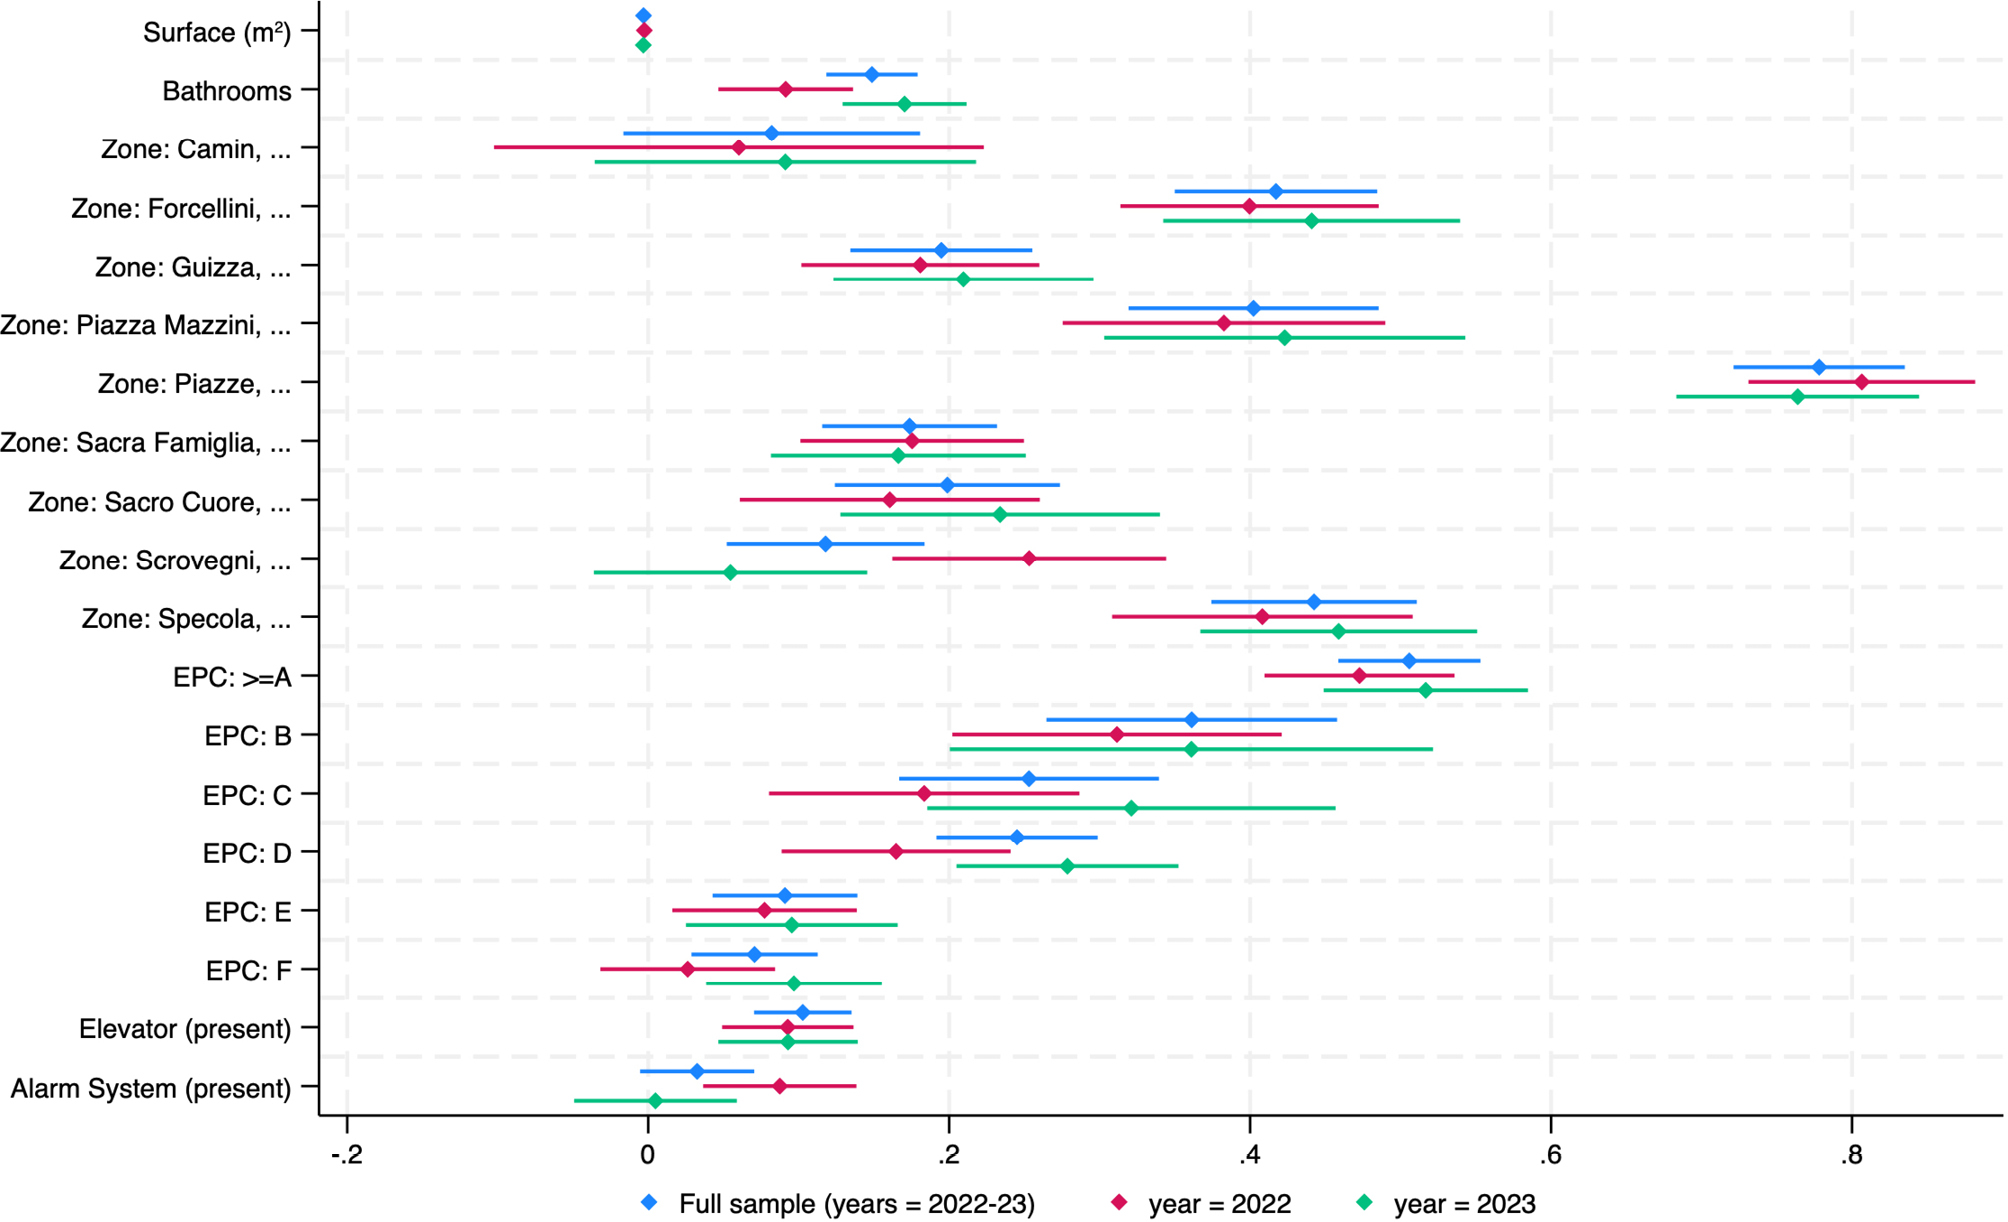
The results underscore the significance of the conventional factors typically considered in HPM real estate applications. Almost all independent variables included in the model exhibit a statistically significant relationship with the dependent variable, namely the dwelling price, expressed as ln(P/m2). Focusing on the full sample, the influence of the EPC is statistically significant for all levels. In particular, the results demonstrated that the higher the EPC level, the higher the asking price. A dwelling of EPC class >= A is worth, on average, 65.8% more than a similar counterpart in class G, while a dwelling with a B label presents a price premium of 43.5%. The influence of the EPC C, D, and E labels is lower, with a price premium of 28.8%, 27.8%, and 9.5%, respectively, compared to the G label. Class F has the lowest effect on the dwellings, with a price premium of 7.3%. The surface of the dwelling (in m2) presented a negative coefficient: this was expected and consistent with theory given that the dependent variable in our model is the price per square meter and it usually decreases with the dwelling size. The higher the number of bathrooms, the higher the impact on real estate prices. Each additional bathroom increases the premium price by 14.9%. In the same direction, the presence of an elevator and an alarm system command a price premium of 10.8% and 3.3%, respectively. All the zone estimations are positive and statistically significant, except for “Camin, Zona Industriale”, which is not statistically significant. Since the zone of reference in our model (zone: “Torre, Mortise, Ponte di Brenta”) was an industrial area located in the north-east part of the city, results suggested that areas closer to the city centre present a positive effect on the price given factors such as accessibility and prestige. The price ranges from 12.5% of the zone “Scrovegni, Portello, Ospedali, Stanga, Pio X” to 117.7% of the zone “Piazze, Duomo, Santo, Santa Sofia, Altinate, Savonarola, Molino”, which is the most central, historical and attractive district of the city.
Regarding the second objective, namely to study the stability of the EPC effect in the short run, we adopted a sequential approach. First, we draw some general considerations investigating the results of the single models of the two years considered (Table 3); second, we did a more detailed investigation to check if the results of the two years could be considered statistically different (Table 5). In the second model (Table 5) all variables (apart from the surface) have been interacted with a dummy indicating if the data were collected in 2023, keeping 2022 as the base level. Considering the results of the single models (general approach), from Table 3 it is possible to observe that some differences, despite being of small magnitude, between the two years considered emerge. More specifically, all EPC classes have a greater influence on dwelling prices in 2023 compared to 2022. A similar result can be observed for the number of bathrooms, and in 5 cases out of 8 if we look at the urban zone. The impact on price of the presence of an elevator is nearly unchanged between the timespan considered, while the presence of an alarm system has a positive effect in 2022, and it is not significant in 2023.
| Dependent variable: ln(P/m2) | |||||||||||||||||||
|---|---|---|---|---|---|---|---|---|---|---|---|---|---|---|---|---|---|---|---|
| β | 95% Conf. Int. | ||||||||||||||||||
| Constant | 7.192*** | [7.091, 7.292] | |||||||||||||||||
| Surface (m2) | -0.003*** | [-0.003, -0.003] | |||||||||||||||||
| Bathrooms | 0.122*** | [0.081, 0.163] | |||||||||||||||||
| Year = 2023 | -0.096 | [-0.225, 0.032] | |||||||||||||||||
| 2023 × Bathrooms | 0.036 | [-0.010, 0.082] | |||||||||||||||||
| Zone | |||||||||||||||||||
| Camin, Zona Industriale | 0.056 | [-0.135, 0.247] | |||||||||||||||||
| Forcellini, San Camillo, Nazareth, Terranegra | 0.403*** | [0.302, 0.503] | |||||||||||||||||
| Guizza, Crocifisso, Ponte Quattro Martiri, Voltabarozzo, Salboro | 0.180*** | [0.087, 0.272] | |||||||||||||||||
| Piazza Mazzini, Ospedale Militare, Porta Trento, Stazione | 0.390*** | [0.265, 0.516] | |||||||||||||||||
| Piazze, Duomo, Santo, Santa Sofia, Altinate, Savonarola, Ponte Molino | 0.808*** | [0.720, 0.897] | |||||||||||||||||
| Sacra Famiglia, Basso Isonzo, Brusegana, Aeroporto, Paltana, Mandria | 0.179*** | [0.092, 0.266] | |||||||||||||||||
| Sacro Cuore, Altichiero | 0.160*** | [0.043, 0.277] | |||||||||||||||||
| Scrovegni, Portello, Ospedali, Stanga, Pio X | 0.254*** | [0.148, 0.361] | |||||||||||||||||
| Specola, Riviere, San Giuseppe, San Giovanni | 0.407*** | [0.290, 0.525] | |||||||||||||||||
| Torre, Mortise, Ponte di Brenta | reference | ||||||||||||||||||
| Camin, Zona Industriale × 2023 | 0.035 | [-0.188, 0.259] | |||||||||||||||||
| Forcellini, San Camillo, Nazareth, Terranegra × 2023 | 0.036 | [-0.100, 0.171] | |||||||||||||||||
| Guizza, Crocifisso, Ponte Quattro Martiri, Voltabarozzo, Salboro × 2023 | 0.031 | [-0.091, 0.153] | |||||||||||||||||
| Piazza Mazzini, Ospedale Militare, Porta Trento, Stazione × 2023 | 0.032 | [-0.135, 0.199] | |||||||||||||||||
| Piazze, Duomo, Santo, Santa Sofia, Altinate, Savonarola, Ponte Molino × 2023 | -0.050 | [-0.165, 0.066] | |||||||||||||||||
| Sacra Famiglia, Basso Isonzo, Brusegana, Aeroporto, Paltana, Mandria × 2023 | -0.017 | [-0.133, 0.100] | |||||||||||||||||
| Sacro Cuore, Altichiero × 2023 | 0.077 | [-0.076, 0.229] | |||||||||||||||||
| Scrovegni, Portello, Ospedali, Stanga, Pio X × 2023 | -0.198*** | [-0.334, -0.063] | |||||||||||||||||
| Specola, Riviere, San Giuseppe, San Giovanni × 2023 | 0.051 | [-0.094, 0.195] | |||||||||||||||||
| EPC | |||||||||||||||||||
| >=A | 0.466*** | [0.392, 0.540] | |||||||||||||||||
| B | 0.311*** | [0.182, 0.439] | |||||||||||||||||
| C | 0.180*** | [0.059, 0.301] | |||||||||||||||||
| D | 0.157*** | [0.068, 0.246] | |||||||||||||||||
| E | 0.070* | [-0.002, 0.141] | |||||||||||||||||
| F | 0.022 | [-0.046, 0.090] | |||||||||||||||||
| G | reference | ||||||||||||||||||
| >=A × 2023 | 0.053 | [-0.044, 0.149] | |||||||||||||||||
| B × 2023 | 0.051 | [-0.144, 0.247] | |||||||||||||||||
| C × 2023 | 0.147* | [-0.027, 0.320] | |||||||||||||||||
| D × 2023 | 0.124** | [0.012, 0.235] | |||||||||||||||||
| E × 2023 | 0.029 | [-0.067, 0.125] | |||||||||||||||||
| F × 2023 | 0.076* | [-0.011, 0.162] | |||||||||||||||||
| Elevator (present) | 0.093*** | [0.042, 0.144] | |||||||||||||||||
| 2023 × Elevator (present) | 0.001 | [-0.066, 0.068] | |||||||||||||||||
| Alarm System (present) | 0.089*** | [0.029, 0.149] | |||||||||||||||||
| 2023 × Alarm System (present) | -0.087** | [-0.165, -0.010] | |||||||||||||||||
| Observations | 1,738 | ||||||||||||||||||
| R2 | 0.560 | ||||||||||||||||||
| Adjusted R2 | 0.550 | ||||||||||||||||||
| AIC | 758.230 | ||||||||||||||||||
| BIC | 971.190 | ||||||||||||||||||
| Note: 95% confidence intervals in brackets. * p < 0.10, ** p < 0.05, *** p < 0.01. | |||||||||||||||||||
Nevertheless, checking if the results of the two years could be considered statistically different (detailed analysis, Table 5), it is possible to notice that the dummy variable Year=2023 is not significant, indicating that the dwelling price does not depend on the year of the listing prices, and, therefore, that prices are not influenced by market dynamics or inflation between the two years. Looking at the stability of the EPC effect in the short term, from our results, it emerges that such a difference is significant only for some EPC classes. More specifically, there is no statistically significant effect in the most energy efficient classes (>= A and B) with respect to G, while for the other classes, apart from class E, the effect is positive and increasing, and it ranges from 8% (class F) to nearly 15% (class C). It is therefore possible to observe that in 3 EPC classes out of 6, namely in 50 % of cases, there is a different effect of EPC between the two years examined. On the contrary, we can observe that all other variables have no significant differences between the two years, apart from the presence of an alarm system (negative effect) and one case out of 9 for what concerns the location of the dwelling.
5. Discussion and Conclusions
This study contributes to the growing body of research on the impact of energy performance certificates on residential property prices, with a specific focus on the city of Padua, Italy. Our results confirm the trend found by previous authors, where the premium price increases passing from lower energy classes to the best performing EPC class, confirming the findings of other studies conducted on the impact of EPC on residential properties in Padua by Copiello and Bonifaci (2015), Copiello and Donati (2021) and Copiello and Coletto (2023). More in detail, from our results the price for an apartment presenting EPC class >= A is 65.8% higher compared to the worst-performing apartments (belonging to class G). In comparison with the findings reported for the city of Padua, this outcome is higher than that of 21.9% detected by Copiello and Bonifaci (2015), but it is consistent with the 61.7% highlighted by Copiello and Donati (2021) and with the band found by Copiello and Coletto (2023). Even if these studies have the same urban area in common with our application, a direct comparison of the results is not straightforward due to some differences. Even if all these studies used as data listing prices, the timing of data collection and the sample size were not the same. Moreover, we have to consider the different analytical approaches implemented and the independent variables included in the models. For example, Copiello and Bonifaci (2015) focused on residential buildings using listing prices collected from April to July 2013, namely around ten years before our application. Such a time gap might be one of the causes of the discrepancy of our results with those of the authors, since the impact of the EPC might have changed as a result of numerous dynamics over nearly a decade. Such a hypothesis is supported by Barreca et al. (2021), who found that, contrary to empirical evidence, in the first years after the implementation of EPC in Italy, these labels are increasingly exerting a significant influence on price variations. If the data of Copiello and Donati (2021) refer to around a few years before our study (third quarter of 2019), the authors analysed the data with a spatial dynamic model. Findings of Copiello and Coletto (2023) are referred to 2022 but are limited to a specific period of the year (March-July), so including 321 observations. Moreover, the different analytical approaches implemented and the independent variables included in the models make it challenging to compare the results across studies. Lastly, it should be noted that we have adjusted our estimates as suggested by Halvorsen and Palmquist (1980) for discrete variables (see Eq. 3), and therefore the magnitude of the estimates, when greater than 25%, could be even greater in the case where estimates were not adjusted. Our findings showed that while for other characteristics results could be considered quite stable in the short run, for the EPC classes there seems to be a greater effect with time, an effect that proved significant for lower energy classes. Such a result, despite needing further validation, is quite interesting and could be explained with some considerations. First, it might well be that, as highlighted by Olaussen et al. (2017), the EPC, being potentially highly correlated with other characteristics of the building or dwelling, captures, along with the premium price for energy efficiency, other aspects related to the dwelling, like for example its maintenance status or whether it was recently renovated. In this respect, it is possible that old dwellings with low EPC classes were partially renovated, with an improvement of the EPC class. Partial renovation could improve the EPC but not bring it to the highest levels, which could be an explanation for the difference between the two years found to be significant only for lower EPC classes, rewarding the niche market of partially renovated dwellings.
The observed price premiums associated with higher EPC ratings could serve as an incentive for homeowners to invest in energy-efficient upgrades and renovations. Beyond the potential for reducing energy costs and enhancing environmental sustainability, our findings suggest that such investments may also translate into tangible increases in property values. This dual benefit could motivate homeowners to prioritize energy efficiency measures, contributing to the EU’s overall goal of decarbonizing the building stock.
Our study suggests some lines for future research. First, our results should be validated given that they could be ‘context-dependent’ both in space and time, and therefore similar studies would be necessary to validate our results considering different cities in different periods. A further aspect that deserves attention is the understanding of the reliability of the use of listing prices in the appraisal practice, especially when using results in absolute values rather than relative percentages. In this respect, it would be interesting to scientifically estimate the average discrepancy of listing prices from real transaction prices. For now, it is possible to affirm that the relative percentages of the premium prices derived in listing price studies could be used, subject to further validation, in classical appraisal approaches like, for example, the Market Comparison Approach. Such analytical effort would be particularly relevant given that the use of Big Data collected with the web crawling technique resulted particularly effective and therefore allows to overcome the difficulty of operating with real transaction data, especially in the Italian or similar context, where data are available, but of difficult accessibility. Furthermore, Italian data need to be carefully studied, given that they depend on the data reported in transaction documents (they are not readily available in a ‘database’ form), which do not follow a standard format, and often miss some important information like the status of the dwelling, while for example the EPC is nowadays always reported given that it is compulsory by law.
References
Banca d’Italia. (2025). Sondaggio congiunturale sul mercato delle abitazioni in Italia. Available at: https://www.bancaditalia.it/pubblicazioni/sondaggio-abitazioni/2025-sondaggio-abitazioni/03/statistiche_SAB_20251120.pdf (Accessed 17 January 2026).
Barreca, A., Fregonara, E., & Rolando, D. (2021). EPC Labels and Building Features: Spatial Implications over Housing Prices. Sustainability, 13(5), 2838. https://doi.org/10.3390/su13052838
Bisello, A., Antoniucci, V., & Marella, G. (2020). Measuring the price premium of energy efficiency: A two-step analysis in the Italian housing market. Energy and Buildings, 208, 109670. https://doi.org/10.1016/j.enbuild.2019.109670
Chapelle, G., & Eyméoud, J. B. (2022). Can big data increase our knowledge of local rental markets? A dataset on the rental sector in France. PloS one, 17(1), e0260405. https://doi.org/10.1371/journal.pone.0260405
Chegut, A., Eichholtz, P., Holtermans, R., & Palacios, J. (2020). Energy efficiency information and valuation practices in rental housing. The Journal of Real Estate Finance and Economics, 60(1), 181–204. https://doi.org/10.1007/s11146-019-09720-0
Copiello, S., & Bonifaci, P. (2015). Price premium for buildings energy efficiency: empirical findings from a hedonic model. Valori e valutazioni, 14, 5–15.
Copiello, S., & Coletto, S. (2023). The price premium in green buildings: A spatial autoregressive model and a multi-criteria optimization approach. Buildings, 13(2), 276. https://doi.org/10.3390/buildings13020276
Copiello, S., & Donati, E. (2021). Is investing in energy efficiency worth it? Evidence for substantial price premiums but limited profitability in the housing sector. Energy and Buildings, 251, 111371. https://doi.org/10.1016/j.enbuild.2021.111371
Court, A. T. (1939). Hedonic price indexes with automotive examples. In The Dynamics of Automobile Demand, 99–119. General Motors Corporation.
de La Paz, P. T., Perez-Sanchez, V. R., Mora-Garcia, R.-T., & Perez-Sanchez, J.-C. (2019). Green premium evidence from climatic areas: A case in Southern Europe, Alicante (Spain). Sustainability, 11(3), 1–29. https://doi.org/10.3390/su11030686
Dell’Anna, F. (2025). Machine learning framework for evaluating energy performance certificate (EPC) effectiveness in real estate: A case study of Turin’s private residential market. Energy Policy, 198, 114407. https://doi.org/10.1016/j.enpol.2024.114407
Dell’Anna, F., Bravi, M., Marmolejo-Duarte, C., Bottero, M. C., & Chen, A. (2019). EPC green premium in two different European climate zones: A comparative study between Barcelona and Turin. Sustainability, 11(20), 5605. https://doi.org/10.3390/su11205605
Diouf, R., Sarr, E. N., Sall, O., Birregah, B., Bousso, M., & Mbaye, S. N. (2019). Web scraping: state-of-the-art and areas of application. In 2019 IEEE International Conference on Big Data (Big Data), Los Angeles, CA, USA, pp. 6040–6042. https://doi.org/10.1109/BigData47090.2019.9005594
European Commission. (2010). Directive 2010/31/eu of the european parliament and of the council of 19 may 2010 on the energy performance of buildings. Available at: https://eur-lex.europa.eu/eli/dir/2010/31/oj/eng (Accessed 18 September 2025).
European Commission. (2018). Directive (eu) 2018/2002 of the european parliament and of the council of 11 december 2018 amending directive 2012/27/eu on energy efficiency. Available at: https://eur-lex.europa.eu/eli/dir/2018/2002/oj/eng (Accessed 18 September 2025).
European Commission. (2021). Making our homes and buildings fit for a greener future. Available at: https://ec.europa.eu/commission/presscorner/api/files/attachment/870607/Factsheet%20BuildingsEN.pdf (Accessed 18 September 2025).
European Commission. (2024). Directive (eu) 2024/1275 of the european parliament and of the council of 24 april 2024 on the energy performance of buildings (recast). Available at: https://eur-lex.europa.eu/eli/dir/2024/1275/oj/eng (Accessed 18 September 2025).
Evangelista, R., Ramalho, E. A., & e Silva, J. A. (2020). On the use of hedonic regression models to measure the effect of energy efficiency on residential property transaction prices: Evidence for Portugal and selected data issues. Energy Economics, 86, 104699. https://doi.org/10.1016/j.eneco.2020.104699
Fregonara, E., Rolando, D., & Semeraro, P. (2017). Energy performance certificates in the Turin real estate market. Journal of European Real Estate Research, 10(2), 149–169. https://doi.org/10.1108/JERER-05-2016-0022
Fregonara, E., Rolando, D., Semeraro, P., & Vella, M. (2014). The impact of Energy Performance Certificate level on house listing prices. First evidence from Italian real estate. Aestimum, 65, 143–163. https://doi.org/10.13128/Aestimum-15459
Fregonara, E., & Rubino, I. (2021). Buildings’ energy performance, green attributes and real estate prices: Methodological perspectives from the European literature. Aestimum, 79, 43–73. https://doi.org/10.36253/aestim-10785
Gerassimenko, A., Defau, L., & De Moor, L. (2024). The impact of energy certificates on sales and rental prices: a comparative analysis. International Journal of Housing Markets and Analysis, 17(5), 1267–1281. https://doi.org/10.1108/IJHMA-03-2023-0041
Goel, M. (2023). Green Expectations: Climate Change and Homeowner Valuation of Dwelling Sustainability. http://dx.doi.org/10.2139/ssrn.4340288
Gonzalez, M. A. S., & Erba, D. A. (2024). Alternative methods for measuring the influence of location in hedonic pricing models. Aestimum, 85, 55–71. https://doi.org/10.36253/aestim-15472
Goodman, A. C. (1998). Andrew Court and the Invention of Hedonic Price Analysis. Journal of Urban Economics, 44(2), 291–298. https://doi.org/https://doi.org/10.1006/juec.1997.2071
Griliches, Z. (1958). The demand for fertilizer: an economic interpretation of a technical change. Journal of Farm Economics, 40(3), 591–606. https://doi.org/10.2307/1235370
Grybauskas, A., Pilinkienė, V., & Stundžienė, A. (2021). Predictive analytics using Big Data for the real estate market during the COVID-19 pandemic. Journal of big data, 8(1), 105. https://doi.org/10.1186/s40537-021-00476-0
Halvorsen, R., & Palmquist, R. (1980). The interpretation of dummy variables in semilogarithmic equations. American Economic Review, 70(3), 474–475.
IEA. (2021). Electricity Market Report. Available at: www.iea.org (Accessed 18 September 2025).
Jach, T. (2021). Web scraping methods used in predicting real estate prices. In Wojtkiewicz, K., Treur, J., Pimenidis, E., & Maleszka, M. (Eds.). Advances in Computational Collective Intelligence. ICCCI 2021. Communications in Computer and Information Science, vol 1463. Cham, Springer. https://doi.org/10.1007/978-3-030-88113-9_30
Khalil, S., & Fakir, M. (2017). RCrawler: An R package for parallel web crawling and scraping. SoftwareX, 6, 98–106. https://doi.org/10.1016/j.softx.2017.04.004
Khder, M. A. (2021). Web scraping or web crawling: State of art, techniques, approaches and application. International Journal of Advances in Soft Computing & Its Applications, 13(3), 145–168. https://doi.org/10.15849/IJASCA.211128.11
Koengkan, M., & Fuinhas, J. A. (2022). Heterogeneous effect of “eco-friendly” dwellings on transaction prices in real estate market in Portugal. Energies, 15(18), 6784. https://doi.org/10.3390/en15186784
Lancaster, K. J. (1966). A new approach to consumer theory. Journal of Political Economy, 74(2), 132–157. https://doi.org/10.1086/259131
Loberto, M., Mistretta, A., & Spuri, M. (2023). The capitalization of energy labels into house prices. Evidence from Italy. Bank of Italy Occasional Paper No. 818. https://doi.org/10.2139/ssrn.4849415
Loro, S., Verso, V. R. L., Fregonara, E., & Barreca, A. (2024). Influence of daylight on real estate housing prices. A multiple regression model application in Turin. Journal of Building Engineering, 96, 110413. https://doi.org/10.1016/j.jobe.2024.110413
Manganelli, B., Morano, P., Tajani, F., & Salvo, F. (2019). Affordability assessment of energy-efficient building construction in Italy. Sustainability, 11(1), 249. https://doi.org/10.3390/su11010249
Marmolejo-Duarte, C., & Chen, A. (2019a). The uneven price impact of energy efficiency ratings on housing segments. Implications for public policy and private markets. Sustainability, 11(2), 372. https://doi.org/10.3390/su11020372
Marmolejo-Duarte, C., Chen, A., & Bravi, M. (2019b). Spatial implications of EPC rankings over residential prices. In Mondini, G., Oppio, A., Stanghellini, S., Bottero, M., & Abastante, F. (Eds.). Values and Functions for Future Cities. Green Energy and Technology. Cham, Springer. https://doi.org/10.1007/978-3-030-23786-8_4
Massimo, D. E., De Paola, P., Musolino, M., Malerba, A., & Del Giudice, F. P. (2022). Green and gold buildings? Detecting real estate market premium for green buildings through evolutionary polynomial regression. Buildings, 12(5), 621. https://doi.org/10.3390/buildings12050621
McCord, M., Davis, P., McCord, J., Haran, M., & Davison, K. (2020). An exploratory investigation into the relationship between energy performance certificates and sales price: a polytomous universal model approach. Journal of Financial Management of Property and Construction, 25(2), 247–271. https://doi.org/10.1108/JFMPC-08-2019-0068
Meijer, F., Visscher, H., Nieboer, N., & Kroese, R. (2012). Jobs creation through energy renovation of the housing stock. NEUJOBS Working Paper D14.2.
Morano, P., Rosato, P., Tajani, F., & Di Liddo, F. (2019). An analysis of the energy efficiency impacts on the residential property prices in the city of Bari (Italy). In Mondini, G., Oppio, A., Stanghellini, S., Bottero, M., & Abastante, F. (Eds.). Values and Functions for Future Cities. Green Energy and Technology. Cham, Springer. https://doi.org/10.1007/978-3-030-23786-8_5
Nicolae, B., & George-Vlad, B. (2015). Life cycle analysis in refurbishment of the buildings as intervention practices in energy saving. Energy and Buildings, 86, 74–85. https://doi.org/10.1016/j.enbuild.2014.10.021
Olaussen, J. O., Oust, A., & Solstad, J. T. (2017). Energy performance certificates–Informing the informed or the indifferent? Energy Policy, 111, 246–254. https://doi.org/10.1016/j.enpol.2017.09.029
Olaussen, J. O., Oust, A., & Solstad, J. T. (2021). Real estate price formation: energy performance certificates and the role of real estate agents. Journal of Sustainable Real Estate, 13(1), 1–11. https://doi.org/10.1080/19498276.2021.2006875
Olaussen, J. O., Oust, A., Solstad, J. T., & Kristiansen, L. (2019). Energy performance certificates—The role of the energy Price. Energies, 12(18), 3563. https://doi.org/10.3390/en12183563
Ou, Y., Bailey, N., McArthur, D. P., & Zhao, Q. (2025). The price premium of residential energy performance certificates: A scoping review of the European literature. Energy and Buildings, 332, 115377. https://doi.org/10.1016/j.enbuild.2025.115377
Perez, H., Amoudi, O., Famuyiwa, F., & HM Tah, J. (2025). An investigation of the impact of energy performance certificate (EPC) ratings on residential property prices in Oxfordshire: a hedonic study. Advances in Building Energy Research, 19(1), 66–86. https://doi.org/10.1080/17512549.2024.2411263
Pommeranz, C., & Steininger, B. I. (2021). What drives the premium for energy-efficient apartments–green awareness or purchasing power? The Journal of Real Estate Finance and Economics, 62(2), 220–241. https://doi.org/10.1007/s11146-020-09755-8
Regione del Veneto. (2025). Ve.Net.energia-edifici. Available at: https://venet-energia-edifici.regione.veneto.it/ (Accessed 18 September 2025).
Rosen, S. (1974). Hedonic prices and implicit markets: product differentiation in pure competition. Journal of Political Economy, 82(1), 34–55. https://doi.org/10.1086/260169
Stenvall, D., Cerin, P., Sjö, B., & Salah Uddin, G. (2022). Does energy efficiency matter for prices of tenant-owned apartments? Environmental Science and Pollution Research, 29(44), 66793–66807. https://doi.org/10.1007/s11356-022-20482-w
Taruttis, L., & Weber, C. (2022). Estimating the impact of energy efficiency on housing prices in Germany: Does regional disparity matter? Energy Economics, 105, 105750. https://doi.org/10.1016/j.eneco.2021.105750
Wei, C., Fu, M., Wang, L., Yang, H., Tang, F., & Xiong, Y. (2022). The research development of hedonic price model-based real estate appraisal in the era of big data. Land, 11(3), 334. https://doi.org/10.3390/land11030334
Wilhelmsson, M. (2019). Energy performance certificates and its capitalization in housing values in Sweden. Sustainability, 11(21), 6101. https://doi.org/10.3390/su11216101
Wilkinson, S. J., & Sayce, S. (2020). Decarbonising real estate: The evolving relationship between energy efficiency and housing in Europe. Journal of European Real Estate Research, 13(3), 387–408. https://doi.org/10.1108/JERER-11-2019-0045
Zancanella, P., Bertoldi, P., & Boza-Kiss, B. (2018). Energy efficiency, the value of buildings and the payment default risk. EUR 29471 EN. Luxembourg, Publications Office of the European Union. https://doi.org/10.2760/267367.
Appendix. Additional statistics and figures
Figure A1
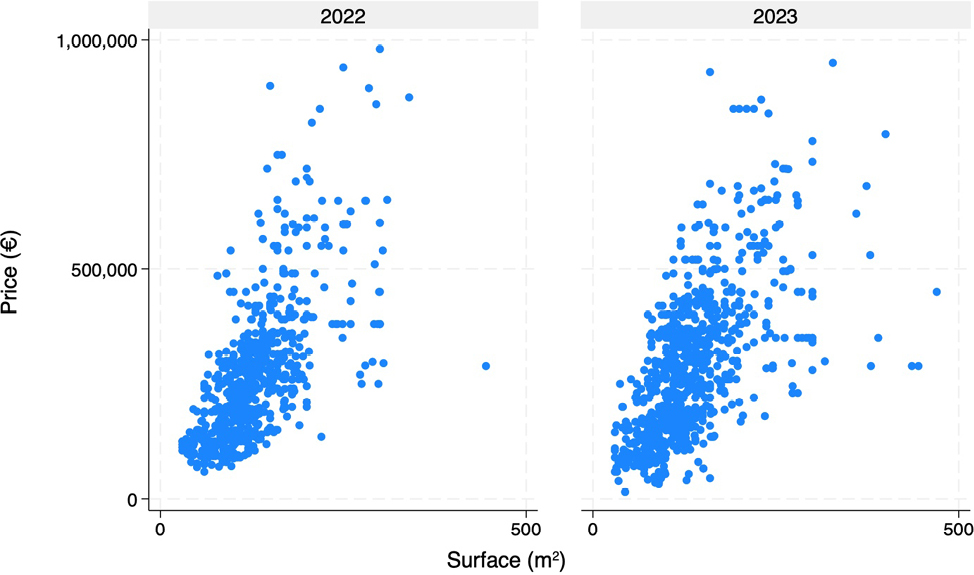
Figure A2
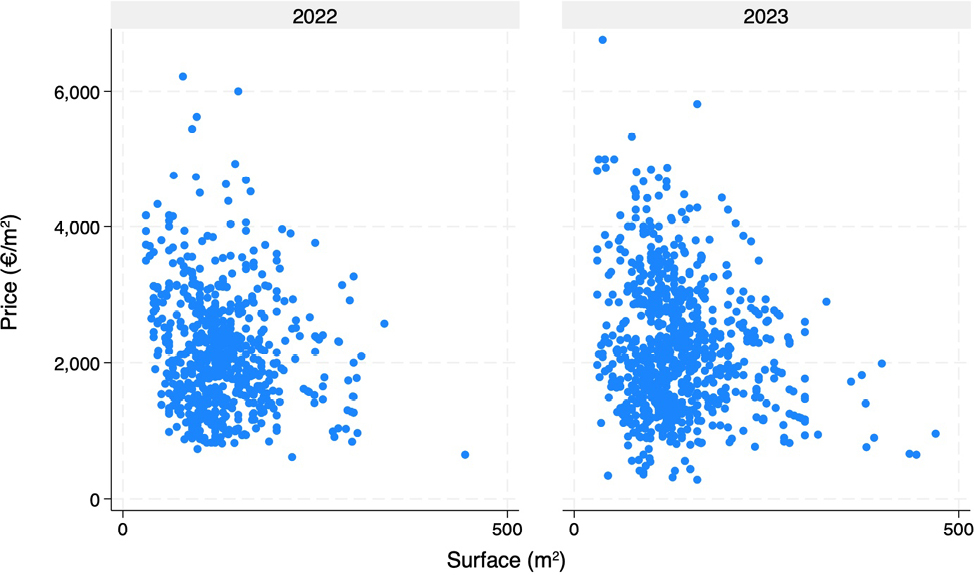
Table A1
| Energy label | Full sample | Study Sample | Municipal Registered EPCs * | ||||||||||||||||
|---|---|---|---|---|---|---|---|---|---|---|---|---|---|---|---|---|---|---|---|
| year=2022 | year=2023 | year=2022 | year=2023 | ||||||||||||||||
| n | % | n | % | n | % | n | % | n | % | ||||||||||
| >=A | 418 | 24.1 | 159 | 22.6 | 259 | 25.1 | 649 | 13.3 | 924 | 14.8 | |||||||||
| B | 42 | 2.4 | 24 | 3.4 | 18 | 1.7 | 129 | 2.6 | 221 | 3.5 | |||||||||
| C | 54 | 3.1 | 29 | 4.1 | 25 | 2.4 | 220 | 4.5 | 381 | 6.1 | |||||||||
| D | 169 | 9.7 | 58 | 8.2 | 111 | 10.8 | 494 | 10.1 | 699 | 11.2 | |||||||||
| E | 233 | 13.4 | 106 | 15 | 127 | 12.3 | 799 | 16.4 | 1,085 | 17.3 | |||||||||
| F | 345 | 19.9 | 120 | 17 | 225 | 21.8 | 1,330 | 27.3 | 1,542 | 24.6 | |||||||||
| G | 477 | 27.4 | 209 | 29.6 | 268 | 25.9 | 1,247 | 25.6 | 1,407 | 22.5 | |||||||||
| all | 1,738 | 100.0 | 705 | 100.0 | 1,033 | 100.0 | 4,868 | 100.0 | 6,259 | 100.0 | |||||||||
| Note: * data refer to the registered EPCs in the municipality of Padua for residential buildings (Regione del Veneto, 2025) of all types (apartments, detached houses, etc.). The considered municipality data included all registered EPCs, not only those for buildings on sale, while the study sample considered only residential buildings in the apartments category for sale. | |||||||||||||||||||
Table A2
| Variable | VIF | 1/VIF |
|---|---|---|
| Surface (m2) | 1.94 | 0.515517 |
| Bathrooms | 2.01 | 0.498356 |
| Zone: | ||
| Camin, Zona Industriale | 1.24 | 0.808198 |
| Forcellini, San Camillo, Nazareth, Terranegra | 1.75 | 0.572506 |
| Guizza, Crocifisso, Ponte Quattro Martiri, Voltabarozzo, Salboro | 2.05 | 0.48838 |
| Piazza Mazzini, Ospedale Militare, Porta Trento, Stazione | 1.46 | 0.686173 |
| Piazze, Duomo, Santo, Santa Sofia, Altinate, Savonarola, Ponte Molino | 2.84 | 0.351695 |
| Sacra Famiglia, Basso Isonzo, Brusegana, Aeroporto, Paltana, Mandria | 2.29 | 0.437268 |
| Sacro Cuore, Altichiero | 1.62 | 0.618551 |
| Scrovegni, Portello, Ospedali, Stanga, Pio X | 1.82 | 0.548833 |
| Specola, Riviere, San Giuseppe, San Giovanni | 1.79 | 0.559873 |
| EPC: | ||
| >=A | 2.06 | 0.486187 |
| B | 1.11 | 0.9012 |
| C | 1.13 | 0.88326 |
| D | 1.27 | 0.786563 |
| E | 1.35 | 0.738194 |
| F | 1.41 | 0.707525 |
| Elevator (present) | 1.31 | 0.760979 |
| Alarm System (present) | 1.1 | 0.912921 |
| Mean VIF | 1.66 |
Table A3
| Dependent variable: ln(P/m2) | |||||||||||||||||||
|---|---|---|---|---|---|---|---|---|---|---|---|---|---|---|---|---|---|---|---|
| Full sample | year=2022 | year=2023 | |||||||||||||||||
| Constant | 7.371*** | 7.350*** | 7.380*** | ||||||||||||||||
| [7.296, 7.446] | [7.247, 7.453] | [7.277, 7.484] | |||||||||||||||||
| Surface (m2) | -0.003*** | -0.003*** | -0.003*** | ||||||||||||||||
| [-0.003, -0.003] | [-0.003, -0.002] | [-0.004, -0.003] | |||||||||||||||||
| Bathrooms | 0.149*** | 0.091*** | 0.170*** | ||||||||||||||||
| [0.118, 0.179] | [0.047, 0.136] | [0.129, 0.212] | |||||||||||||||||
| Zone: Camin, Zona Industriale | 0.082 | 0.060 | 0.091 | ||||||||||||||||
| [-0.017, 0.181] | [-0.102, 0.223] | [-0.036, 0.218] | |||||||||||||||||
| Zone: Forcellini, San Camillo, Nazareth, Terranegra | 0.417*** | 0.400*** | 0.441*** | ||||||||||||||||
| [0.350, 0.484] | [0.314, 0.485] | [0.342, 0.540] | |||||||||||||||||
| Zone: Guizza, Crocifisso, Ponte Quattro Martiri, Voltabarozzo, Salboro | 0.195*** | 0.181*** | 0.209*** | ||||||||||||||||
| [0.134, 0.255] | [0.102, 0.260] | [0.123, 0.296] | |||||||||||||||||
| Zone: Piazza Mazzini, Ospedale Militare, Porta Trento, Stazione | 0.402*** | 0.383*** | 0.423*** | ||||||||||||||||
| [0.319, 0.485] | [0.275, 0.490] | [0.303, 0.543] | |||||||||||||||||
| Zone: Piazze, Duomo, Santo, Santa Sofia, Altinate, Savonarola, Ponte Molino | 0.778*** | 0.806*** | 0.764*** | ||||||||||||||||
| [0.721, 0.835] | [0.731, 0.882] | [0.683, 0.845] | |||||||||||||||||
| Zone: Sacra Famiglia, Basso Isonzo, Brusegana, Aeroporto, Paltana, Mandria | 0.174*** | 0.175*** | 0.166*** | ||||||||||||||||
| [0.116, 0.232] | [0.101, 0.250] | [0.082, 0.251] | |||||||||||||||||
| Zone: Sacro Cuore, Altichiero | 0.199*** | 0.161*** | 0.234*** | ||||||||||||||||
| [0.124, 0.274] | [0.061, 0.260] | [0.128, 0.340] | |||||||||||||||||
| Zone: Scrovegni, Portello, Ospedali, Stanga, Pio X | 0.118*** | 0.253*** | 0.055 | ||||||||||||||||
| [0.052, 0.184] | [0.162, 0.344] | [-0.036, 0.146] | |||||||||||||||||
| Zone: Specola, Riviere, San Giuseppe, San Giovanni | 0.442*** | 0.408*** | 0.459*** | ||||||||||||||||
| [0.374, 0.511] | [0.308, 0.508] | [0.367, 0.551] | |||||||||||||||||
| Zone: Torre, Mortise, Ponte di Brenta | reference | ||||||||||||||||||
| EPC: >=A | 0.261*** | 0.308*** | 0.238*** | ||||||||||||||||
| [0.203, 0.319] | [0.226, 0.390] | [0.159, 0.317] | |||||||||||||||||
| EPC: B | 0.116** | 0.147** | 0.082 | ||||||||||||||||
| [0.013, 0.219] | [0.024, 0.269] | [-0.083, 0.248] | |||||||||||||||||
| EPC: C | 0.008 | 0.019 | 0.042 | ||||||||||||||||
| [-0.085, 0.101] | [-0.097, 0.134] | [-0.100, 0.185] | |||||||||||||||||
| EPC: D | Reference | ||||||||||||||||||
| EPC: E | -0.154*** | -0.087** | -0.183*** | ||||||||||||||||
| [-0.214, -0.094] | [-0.170, -0.005] | [-0.267, -0.100] | |||||||||||||||||
| EPC: F | -0.174*** | -0.138*** | -0.182*** | ||||||||||||||||
| [-0.230, -0.119] | [-0.219, -0.058] | [-0.256, -0.107] | |||||||||||||||||
| EPC: G | -0.245*** | -0.165*** | -0.279*** | ||||||||||||||||
| [-0.299, -0.192] | [-0.241, -0.089] | [-0.352, -0.205] | |||||||||||||||||
| Elevator (present) | 0.103*** | 0.093*** | 0.093*** | ||||||||||||||||
| [0.070, 0.135] | [0.049, 0.136] | [0.047, 0.139] | |||||||||||||||||
| Alarm System (present) | 0.033* | 0.087*** | 0.005 | ||||||||||||||||
| [-0.005, 0.070] | [0.037, 0.138] | [-0.049, 0.059] | |||||||||||||||||
| Observations | 1738 | 705 | 1033 | ||||||||||||||||
| Adjusted R2 | 0.545 | 0.612 | 0.521 | ||||||||||||||||
| AIC | 758.055 | 84.128 | 622.167 | ||||||||||||||||
| BIC | 867.265 | 175.292 | 720.972 | ||||||||||||||||
| Note: 95% confidence intervals in brackets. * p < 0.10, ** p < 0.05, *** p < 0.01. | |||||||||||||||||||