Competitiveness of wine cooperatives in light of pricing strategies and marketing channels: Evidence from Germany
Institute of Agricultural Policy and Markets, Research Centre of Cooperatives, University of Hohenheim, 70599 Stuttgart, Germany
*Corresponding author. Email: rebecca.hansen@uni-hohenheim.de
Abstract. For decades, the literature has engaged in a robust debate regarding the competitiveness of wine cooperatives. Many studies suggest that these cooperatives may exhibit lower pricing competitiveness compared to other enterprise forms, while others have found the opposite. To clarify these conflicting findings, this study employs two datasets focused on German winegrowers’ cooperatives to compare their competitiveness across various price segments of the wine market through hedonic price analyses. The first dataset encompasses the premium wine segment, comprising 1,320 observations derived from wine guide data. The second dataset, which includes 18,740 observations, reflects the broader market characterized by lower average wine prices. The results reveal that the heterogeneity in cooperative sizes influences diverse marketing strategies within the German wine market. Especially larger cooperatives operating in the broader market at lower price segments tend to achieve relatively lower prices compared to other enterprise types. However, this competitive disadvantage dissipates within the high-price, high-quality segment, particularly for wines recognized in wine guides. The findings indicate that the organizational structure of cooperatives in the wine sector does not inherently confer a competitive disadvantage relative to other enterprise forms; rather, it is the heterogeneity among cooperatives that explains the variability in competitiveness. Furthermore, the findings suggest that wine prices in the lower price segments are particularly sensitive to signalling of quality attributes. Thus, cooperatives may enhance their competitiveness by emphasizing the quality attributes of their wines to offset any pricing disadvantages.
Keywords: competitiveness of cooperatives, wine cooperatives, hedonic price analysis, Hausman-Taylor estimation, quantile regression.
Index
2.1 Structural developments in the cooperative German wine sector
2.2 State of the art in hedonic price analyses of wine
5.1 Descriptive statistics of the samples
5.3 Quantile Regression Models
The German wine market has been considered saturated since the 1970s and is under increasing competitive pressure from national and international producers [1,2].
In this market environment, agricultural cooperatives are often assumed to be providers of standard, low or inferior quality products in a direct comparison with other forms of enterprises [3]. The majority of the existing literature suggests that wine cooperatives are less competitive when marketing their wines [4–6]. In the case of German winegrowers’ cooperatives, it is concluded that they receive lower prices for the wines they produce and have a lower reputation than non-cooperative winegrowers [5,7–9]. The somewhat negative reputation of cooperatives is based on the familiar structural problems leading to obstacles in decision-making processes and inefficiencies in marketing, as well as a disadvantage compared with competitors that have a different kind of organisational form. This is particularly apparent when the cooperatives’ aim is to market products of higher quality [10].
However, winegrowers’ cooperatives still account for one third of wine production in Germany. In some wine-growing regions, they even dominate in terms of regional acreage [11]. Their relevance for the German wine market can therefore not be neglected. Why then do different strands of the literature come to different conclusions about the competitiveness of wine cooperatives? Are the differences rooted in datasets that picture parts, but not all, of the wine market? Are certain estimation methods producing varying results or should the heterogeneity of wine cooperatives be taken into consideration?
To the best of the authors’ knowledge, no previous cross-segment studies have simultaneously examined premium price segments and wines sold in food retail and discount outlets. This study aims to close this gap. It analyses the extent to which company characteristics and product attributes influence wine pricing. Specifically, the study investigates the effects of the organizational form and size of cooperatives, alongside production decisions related to product characteristics such as quality, reputation, vintage, and storage methods. The objective is to determine whether cooperatives market wines of equivalent quality at lower prices, at adjusted prices within lower quality segments, or at relatively high prices. This analysis seeks to provide a comprehensive conclusion regarding the competitiveness of cooperatives compared to wine producers operating under other organizational forms.
To gain clearer insights into the competitiveness of cooperatives compared to wine producers with other organizational forms, as well as the differences among cooperatives that market wines in various price segments of the German wine market, this article analyses two datasets:
First, a panel dataset of German wine guide ratings with 1,320 observations was used to analyse the premium wine segment. To include additional, i.e. lower price segments, the analysis was complemented by a dataset of 18,740 observations in the evaluations undertaken by the German Federal Wine Awards. This data set offers the ability to look into the structural differences of wine cooperatives (regarding size and the price segment in which they are marketing their wine) in a greater detail than previous studies did so far.
The following section provides a brief literature review of the competitive situation within the German wine market, specifically focusing on existing studies that have analysed the market position of wine cooperatives, as well as current model approaches to hedonic price analysis. Subsequently hypotheses are derived. In sections 3 and 4, the uniqueness of the data basis used for the present analysis is elaborated in detail and the underlying models are explained. The results of the estimated price models are then presented and discussed in order to derive recommendations for wine cooperatives out of the key findings of the analysis. The paper ends with conclusions.
2.1 Structural developments in the cooperative German wine sector
Geographically, Germany can be divided into 13 traditional wine-growing regions, which have been producing wine for over 200 years. In Germany in 2021, the market share of domestic wines was 45 %, followed by wines from Italy (17 %) and France (11 %) [12]. Primarily due to Germany’s high income levels and almost constant wine consumption habits, the country offers an attractive trading platform for the European wine market in which German vintners and winegrowers in all forms of enterprises have to compete in terms of price, quality and marketing [13].
In fact of the high market competition, there has been a reduction in the number of vineyards in the German wine sector. Cooperatives are affected by this change, as can be seen in the decrease in winegrowers’ cooperatives. The change in the structure of German wine cooperatives can therefore be described as a concentration to fewer, larger cooperatives with an increased number of members and a larger cultivated area [14]. However, the wine market is affected not only by structural changes among wine producers, but also by consumers focusing increasingly on quality attributes. Since wine is considered to be an experience good and can only be evaluated by consumers after consumption, evaluation platforms can help reduce uncertainty and information asymmetries on the part of consumers and support their purchase decision [15–17]. Therefore, external ratings are used as a guide to build consumers’ individual willingness to pay for a wine [18]. For wine producers, the listing in wine guides or independent organisations, such as the German Agricultural Society (DLG), can have a positive effect on the wine price achieved [8,19]. These rating institutions conduct external evaluations of the quality of the produced wine and the reputation of the wine producer, which is defined as the perception associated with the consistent production of high-quality products. Especially when there is uncertainty about the quality of a wine, reputation constructs can support consumers’ decision-making [19]. Therefore, for wine producers the promotion of their wines’ quality and reputation can lead to the development of consumers’ preferences for these certain wine or winery that may evolve to consumer loyalty in the future [20].
However, a strand of literature suggests that wine cooperatives in Germany lack of success in using these wine guides: The arguments of Frick [4], Dilger [5] and Schäufele et al. [7] reveal that cooperatives would not invest in quality-oriented production efforts, might fail to serve consumers’ preferences and would rather follow low-quality mass production strategies. As a result, they conclude that wine cooperatives achieve lower wine prices compared to non-cooperative wine producers.
Nonetheless, as it is well known that a cooperative’s business performance is highly dependent on structural characteristics [21] and their market orientation [22], it is the logic consequence to incorporate these factors in the analysis of competitiveness.
The findings of Richter and Hanf [11] indicate that winegrowers’ cooperatives are increasingly focussing on implementing quality management strategies, which include monitoring their members’ production process, thereby aiming to enhance the quality of the wines produced [11]. These findings suggest certain cooperatives possess specific firm characteristics that allow them to overcome deficiencies and do not align with groups identified as less competitive. Studies by Schamel [23], Couderc and Marchini [22] and Valette et al. [24] provide supporting evidence from examples in France and Italy, demonstrating that winegrowers’ cooperatives can operate competitively and secure price advantages in particular regions.
Schamel [23] compared the price premiums that cooperative and non-cooperative achieve for quality and reputation premiums. In the Alto Adige region of Italy, where 70% of wine production is marketed by cooperatives, it was found that cooperatives listed in a wine guide can achieve reputation and quality premiums. This suggests that in regions where cooperatives are prevalent, consumers are willing to pay more for high-quality wines from these organizations and associate them with the production of appealing wines.
Couderc and Marchini [22] examine structural patterns in wine cooperatives that lead to varying economic performances, finding that success of wine cooperatives is highly dependent on the development of marketing strategies that are both market- and demand-oriented.
Valette et al. [24] argued that wine cooperatives in France have a higher survival rate, defined as the ability to operate market-oriented, compared to non-cooperatives. Their findings indicate that cooperatives that leverage economies of scale, possess greater market power, and adapt to temporary market changes are better equipped to handle market instabilities than other business models. While Valette et al. employed a different approach in comparing the competitiveness of cooperatives versus non-cooperatives, their results suggest that cooperatives that exploit their strategic and structural advantages can successfully thrive in the market. However, this positive effect was not observed for German wine cooperatives [6]. Given the similarities between the market environments faced by cooperatives in Italy, France, and Germany [22], it appears likely that the findings of Schamel [23], Couderc and Marchini [22] and Valette et al. [24] could be applicable to cooperatives in Germany.
However, limited consideration has been given to the heterogeneity of German wine cooperatives with regard to their competitiveness, even though the structural difference between winegrowers’ cooperatives determines the optimal design of the marketing strategy a cooperative should follow [11].
Small cooperatives are expected to involve their members more in decision-making processes as they are more dependent on individual members, thus individual preferences are given more weight than in larger cooperatives where the inclusion of each individual member would lead to a delay in decision-making processes [25]. It can also be assumed that larger winegrowers’ cooperatives have more comprehensive member and quality management in order to prevent potential issues of free-riding and moral hazard. Therefore, cooperatives of varying sizes can be differentiated from each other and from other forms of enterprises by their internal structure and production-oriented motives [21,26].
What can be concluded from this review of existing literature is that the results vary with the applied method, the motivation and the depth of comparison. The higher the focus on structural differences between cooperatives the higher the differentiation of conclusions drawn regarding the competitiveness of the cooperatives.
2.2 State of the art in hedonic price analyses of wine
Against the backdrop of the price of a consumer good being determined by the sum of the implicit prices for its individual product characteristics or attributes, hedonic price analyses offer a suitable method for investigating the determinants of price formation in the wine market [23,27]. Following the hedonic pricing framework which says that the value of a good is defined by the sum of its product characteristics, i.e. attributes [28], cooperative competitiveness is rather understood as the ability of cooperatives to address consumers’ preferences for certain product attributes and the consequent ability to attract consumers with higher willingness to pay better than their market competitors. As a consequence, a cooperative would be disadvantageous to other forms of enterprises if they are not able to offer wines with product characteristics that increase consumers’ willingness to pay for a wine. Even though cooperatives may position themselves in low-price segments they could according to this logic still be competitive as long as they would be able to address consumers’ desire for product attributes in those price segments. A number of articles therefore analyse the influence of product characteristics on the price of wine using hedonic price models emphasising that quality and reputation ratings play a key role in price determination [7,10,16,19]. For example, Lecocq and Visser [29] show that classification by a rating system, such as tasting and listing in a wine guide, has a positive influence on the wine price achieved. Costanigro and McClusky [27] examined the effect of quality attributes in different price segments and show that quality affects price mainly in the high-price segment. Therefore, wine guides’ quality ratings can be seen as a proxy for quality. Schamel and Ros [16] provide a detailed overview of other hedonic price analyses and show that, in addition to the ratings of wine guides, other objective characteristics influence the price of wine.
The hedonic pricing framework applies to different price segments: Costanigro and McCluskey [27] show that pricing in the wine market is determined by segment-specific characteristics and that segmentation should be taken into account in applied pricing models [16] (for a detailed discussion of the theoretical assumptions about the factors influencing German wines, see Schäufele et al. [7]). Therefore, specific product characteristics may be addressed to match consumer preferences in each of the respective segments differently.
Articles that have studied the wine market with hedonic price analyses primarily use the Ordinary Least Squares (OLS) estimation method [6,7]. However, given that evaluations of quality and reputation have a subjective character, it was assumed that they correlate with both known and unknown product attributes, potentially leading to endogeneity problems that result in biased estimators when using a conventional least squares estimation.
This article aims to build on former analysis of the German wine market with a special focus on the pricing competitiveness of cooperatives to close the gap of a sufficient consideration of structural differences of cooperatives (including a range in area under cultivation from 100 ha to over 1000 ha), and the pricing segments the cooperatives position their wines (ranging from € 1.8 to € 69.5). To do so the following hypotheses were investigated:
H1: The German wine market is characterised by different price segments. Therefore, different product attributes can be identified as price determinants in these segments.
H2: The effect of the organisational form of “cooperative” on wine price differs in different price segments.
H3: The quality rating of a wine and the reputation rating of a wine producer or cooperative have a significant positive influence on the wine price in all segments.
H4: The size of a cooperative influences its marketing strategy, therefore the quality it produces and the market segment where it is positioned and thus the wine price achieved.
Methodologically, the Hausman-Taylor panel estimator (H-T) was used where applicable to overcome endogeneity bias. To take into account the heterogeneity between cooperatives and different price segments of the wine market, various wine evaluation formats were considered and quantile regressions were used.
Quality ratings of wines may differ across wine guides, particularly where evaluations are not based on blind tasting procedures [15,30]. As we aim to compensate for potential biases that occur in the wine guide ratings only wines are included to the sample that were rated in the following two wine guides [31,32]: The Gault&Millau wine guide, and the Eichelmann. The wines in the Gault&Millau wine guide are tasted both blindly and openly to assess the quality development of the wineries over time [33]. In the Eichelmann a comparable number of wines and wineries are evaluated using the international 100-point system for quality classification. Furthermore, 1-5 stars are awarded for the company’s reputation. In contrast to Gault&Millau, however, tastings are repeated and are exclusively blind [34]. Even though the probability of biased ratings cannot be ruled out completely, the use of two wine guide ratings enables a visibility of potentially differing effects of the two wine guides on the wine price. Only wines that meet the wine guide’s basic quality standards and are recommended for purchase are listed in these guides.
Tasting and listing of wines in a wine guide requires their active promotion by winemakers. With regard to this self-selection, the selection of wines tasted can only be regarded as random to a limited extent. However, the wines and vineyards in the sample in this analysis were randomly selected from all the wines listed in the wine guides.
The prices of a wine however are identical in these two guides. Each wine enters the dataset therefore with one price observation. 75.76 % of the wines included in the sample enter the dataset with two quality ratings, from Gault&Millau and Eichelmann, respectively, whereas the other 24.44 % have only one quality rating. Further explanatory variables used to estimate the effect on the achieved market price for wine are listed in Table A1.
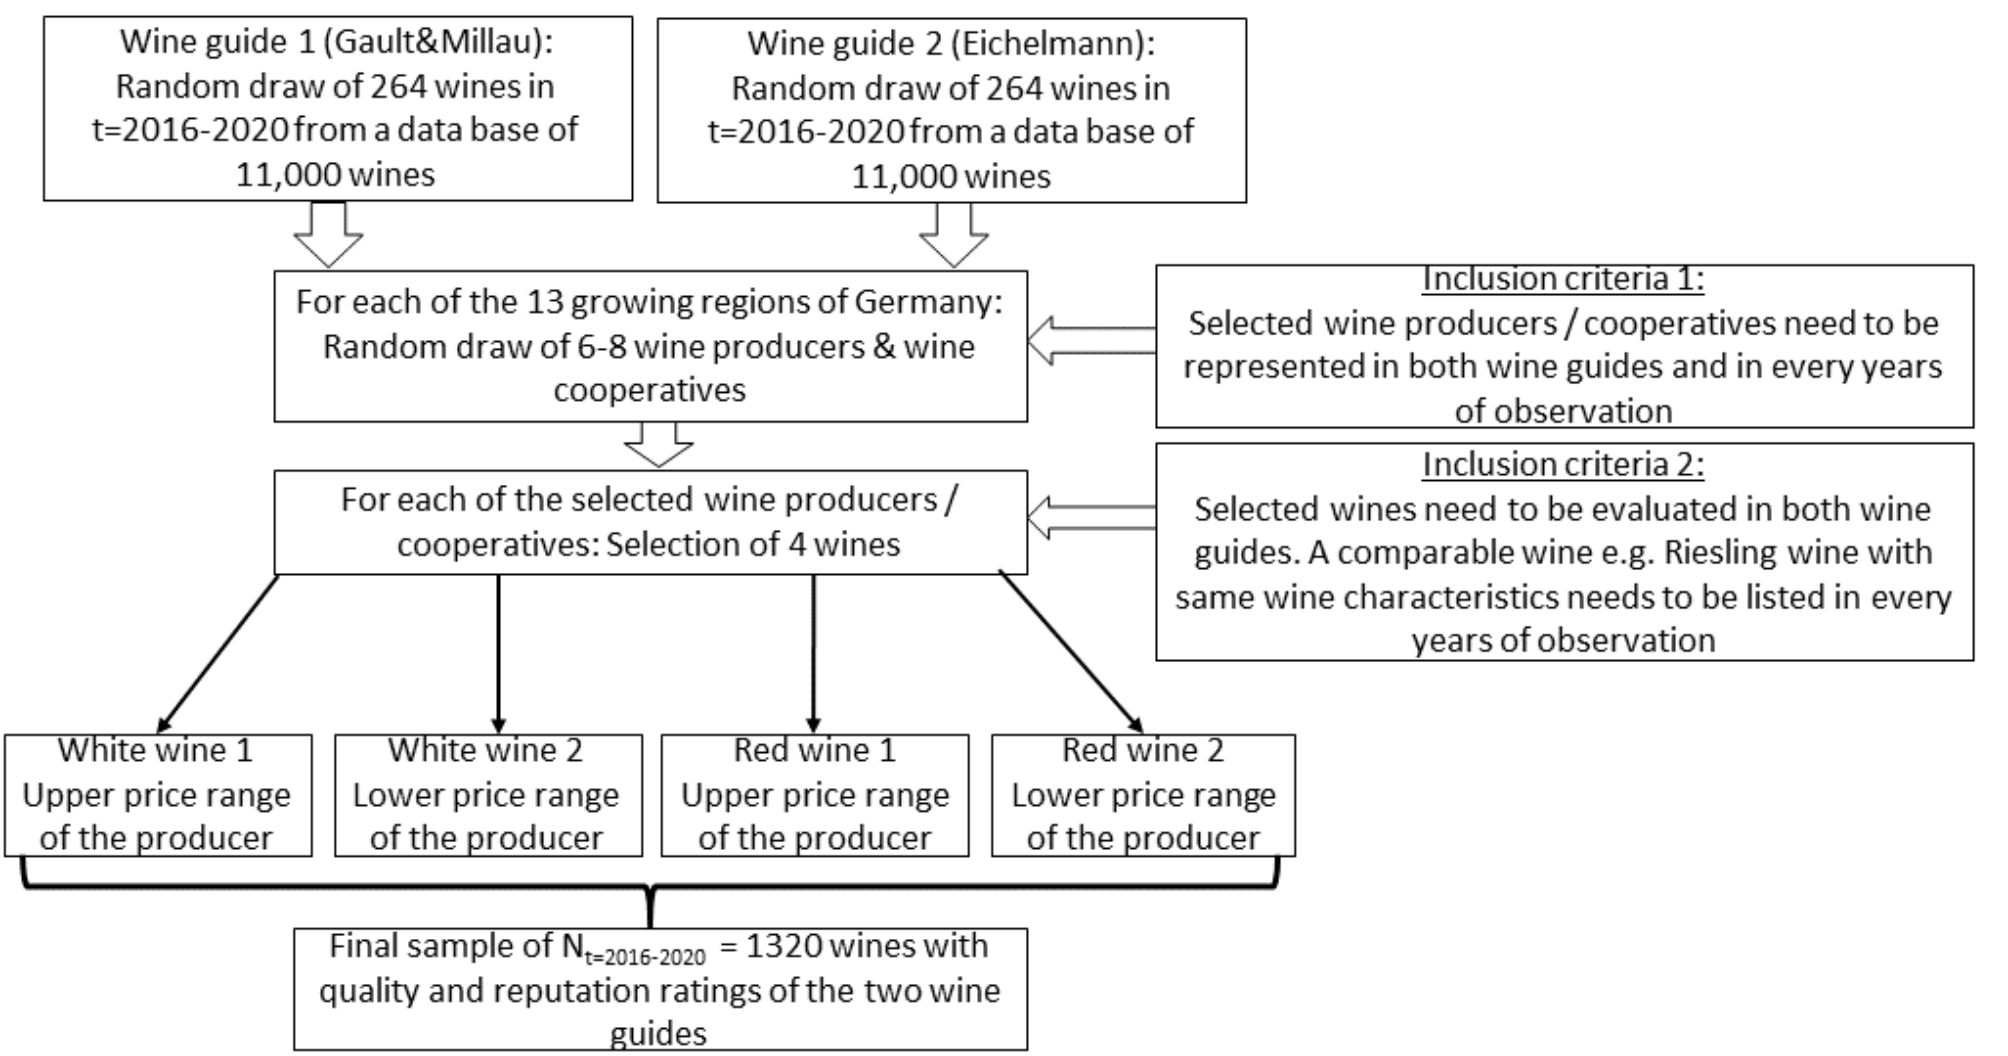
In order to represent each growing region of Germany equal, the random draw of vineyards has been equally distributed over the growing regions. Two red and two white wines were selected for each winegrower or cooperative included: one from the upper price range and one from the lower price range. Figure A3 graphically explains the structure of data generation. The ratings of the wineries in the sample were observed over a period of five years.
As a wine guide’s evaluation usually focuses on wines in the upper price segments (see Table A1, sample mean of the wine price per bottle between € 14.5 and € 16.8) and in the segment of wines sold in supermarkets the average price for a bottle of German wine is € 3.63 [35], it is unclear whether solely considering the quality ratings of wine guides provides representative results from which to draw conclusions for the entire wine market. The simultaneous consideration of several wine guides and the use of different evaluation platforms would help to reduce potential distortions.
The sample from the Federal Wine Awards (FWA) [36], an alternative evaluation format for the quality assessment of German wines, was used as a data basis for the second part of the analysis. The annual competition gives awards to 2500-3000 wines that have previously participated and passed an official quality test at federal state level. The highest award on this rating platform is the Gold Extra award, followed by Gold, Silver and Bronze awards. The FWA is considered a highly valuable rating for wine [37]. As it acts independently and not on behalf of a private company, tasting proceeded as a critical blind tasting [37] and assessments are carried out by various independent testing experts. For these reasons, we evaluate this rating platform as rather objective and independent. In addition to the wine price, other wine characteristics are also provided within this evaluation format (see Table A2) (for a detailed explanation on the structure of the FWA, see Schamel [37]). To identify whether a wine was produced by a cooperative or by another form of enterprise, the size of the enterprise was used in this dataset as a proxy. The assumption made by the publisher of the data is that enterprises cultivating an area of more than 100 ha are run as cooperatives1. One strength of the FWA dataset is the classification of the winegrowers’ cooperatives by their size (for gradations of the categorial variable “coopsize”, see Table A2). This allows a further systematisation of different types of cooperatives. It should be noted that there is no information about membership numbers in the winegrowers’ cooperatives; an indicator of size only comes from the area under cultivation in hectares. However, Fanasch and Frick [38], for example, point to a positive correlation between the number of members and the area under cultivation.
The hedonic price analysis applied here is based on Rosen’s assumption that the value of a good is measured by the sum of its product characteristics, and thus both supply and demand of a product’s attributes co-determine the respective market price [28]. The price p of a wine i is thus dependent on a vector z of n product attributes z = (z1, z2, z3, …, zn) where zn measures the amount of the characteristics included in the product [28]. The market prices of the products under consideration depend on the respective product attributes, and can be represented by a hedonic price function pi(z1, …, zn) [27].
Following Rosen’s assumption [28, p. 83], from the consumer’s point of view, the benefit (or utility gain) from purchasing a certain wine is determined by the combination of product attributes such as vintage, colour or storage type. We capture these product attributes through various categorical variables that are presented in Table A1 (column “Vector symbol”).
The wine ratings of the two wine guides in question are available as panel data over time. It is therefore possible to account not only for wine attributes that drive consumers’ willingness to pay but also to control for potential variations in the effect of quality attributes, i.e. the quality and reputation rating, on the wine price over time.
In our study, especially the time-invariant variable that indicates the form of enterprise (i.e. cooperative or not) is of major importance to test our core hypotheses.
We therefore turn to the estimation approach proposed by Hausman and Taylor [39]. Their Hausman-Taylor (H-T) panel data estimator allows for time-invariant regressors (e.g. in our case the form of enterprise) while addressing Cov(μi, Xit) ≠ 0 due to various forms of endogeneity of certain regressors through external and internally generated instruments.
In order to implement this approach, the variables were subdivided on the basis of their time (in)variance and their (non-)correlation with the individual effect. According to Hausman and Taylor [39] the model takes the following form:
yit = X'1itβ1 + X'2itβ2 + Z'1iγ1 + Z'2iγ2 + μi + vit;
i = 1, …, N; t = 1, …, T(1)
where X'it defines a vector of time-varying variables and Z'i defines a vector of time-invariant variables. The error terms μiIID(0,σ2μ) and vitIID(0,σ2μ) are considered to be independent of each other. The dependent variable of the wine price in € was expressed in a logarithmic form, as comparable hedonic price analyses of the wine market report that this functional form is preferable [7,10,31].
The applied H-T model allows for the partial correlation of the Xit and Zi variables with the individual effect μi [40]. Xit and Zi are divided into X1 and Z1, as exogenous parts of the vector of explanatory variables, and they are assumed to be non-correlated with the error term. In contrast, X2 and Z2, are variables that are correlated with the error term [41]. The assignment of the regressors to the four variable categories (X1it, X2it, Z1i, Z2i) can be found in Table A1. This assignment has been performed based on the following criteria: First, the variables have been assigned to the X or Z vector based on their time-(in)variance. Second, the variables that have been suspected to be endogenous are assigned to the X2 or Z2 vector. The quality and reputation ratings of the wine guides as well as the organisational form and the size of the cooperative expressed in terms of members are supposed to be potentially endogenous and therefore need to be instrumented. For a detailed overview of instrument generation, see Baltagi [42, p. 170 ff.]. Hausman [39] suggest using the instruments AHT = [QX1, QX2, PX1, PZ1], with P and Q as orthogonal projection letters that transform a vector of observations into a vector of group means (P) and a vector of deviations from group means (Q) and multiplying them by the transformed covariance matrix of the error term.
Based on the Durbin-Wu-Hausman test, a fixed-effects (FE) model was compared against the H-T model. The test result with χ2 = 12.16 and a p-value of 0.79 fails to reject the null hypothesis that both models are consistent. According to Baltagi et al. [43], this underlines the appropriateness of a H-T model in comparison to the FE model. The chosen instruments therefore appear to be valid while some but not all variables turn out to be correlated with the individual effects [42, p. 175,43].
The empirical application was carried out using the plm-package for a Hausman-Taylor estimation with Baltagi’s [44] instrumentation method in R [45].
However, the second dataset in the sample from the Federal Wine Awards (FWA) had no time series character. It consisted of independent observations made over several years. Therefore, the analysis of the valuations of the FWA initially used the approach of a pooled OLS estimation. This dataset includes additional characteristics of both wines and cooperatives, and may this way be complementary to the characteristics results of the panel model. In order to consider possible differences between price segments, the quantile regression approach was used. Here, a conditional quantile function Qτ(Y|X) was estimated for the respective quantiles τ = 0.25, 0.5, 0.75, 0.9 [46]:
Qτ(yi) = α0 + βW(τ)XiW + βQ(τ)XiQ + βR(τ)XiR +
βF(τ)XiF + βA(τ)XiA + εi(2)
The subscripts W, Q, R, F and A, as presented in Table A2, denote the vectors of attributes that potentially influence the wine price. Possible price segments were assigned to the wine prices of the dataset by dividing them into q quantiles, which were examined for differences in the influence and effect strength of product attributes. Model goodness-of-fit for the quantile regression models were assessed and compared using the Pseudo-R2 according to Koenker and Machado [47].
5.1 Descriptive statistics of the samples
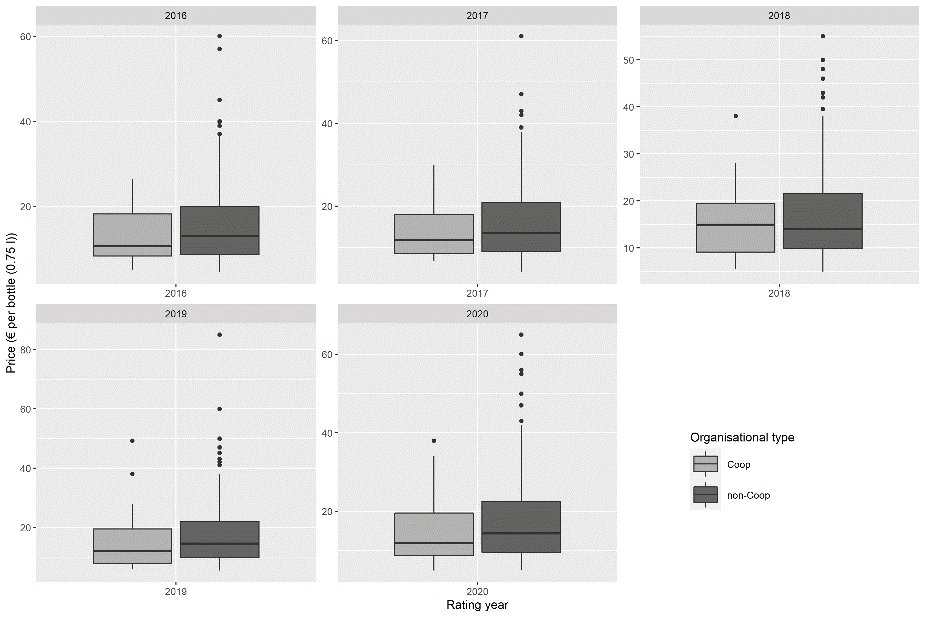
In Tables A1 and A2 (column “wine price per bottle”), the indicated share of wines in the defined low and high-price segments revealed the difference between the FWA and the wine guide dataset described above. Regarding the sample mean, the wine guides focus on the price segment above € 10.00 per bottle, while the majority of the wines evaluated by the FWA belong to the lower price segment at a price below € 10.00 per bottle. The price distribution of the two samples showed that the observed winegrowers’ cooperatives sell their wines at a price that is around € 1.00-2.00 below that achieved by other forms of enterprise (Tables A1 and A2) and that non-cooperative companies offer more wines at higher prices, as shown by the upper outliers of the boxplots in Figures 1 and 2.
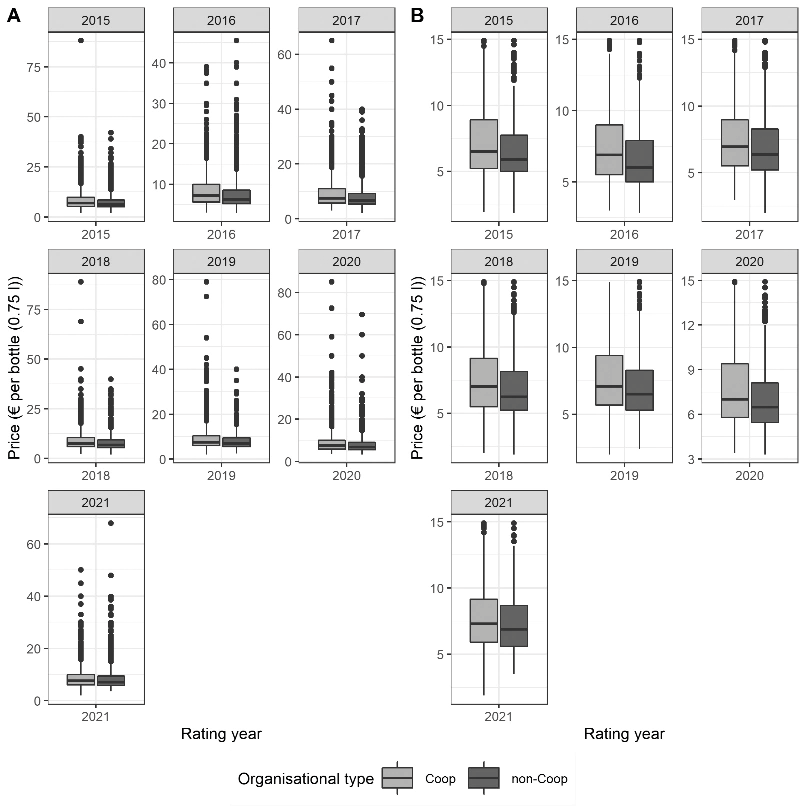
Furthermore, Figure 2 and Table A2 show that the price distribution of the FWA data differs from the wine guide data. As mentioned above, the average prices of the sample were concentrated around a lower price mean. The mean price for the cooperative enterprises is € 8.32, whereas for other forms of organisation it is nearly € 1.00 higher (€ 9.11). In comparison with the sample mean of the wine guides, a smaller difference between cooperatives and non-cooperatives was observed. It also showed that there are visible deviations in price segments above the 3rd quartile (price >= € 9.80). From 2016 onwards in particular, and especially in the case of wines from non-cooperatives, the prices are more dispersed. The distribution of the data may lead to a distortion of the results when the highest price of an evaluated wine in the sample is € 89.00, while the sample mean is concentrated around € 8.00-9.00. Figure 2 shows a comparison of the price distribution of the full sample (A, left) and the limited consideration of the 90 % quantile (maximum price = € 14.90) (B, right). This sample distribution underlines the appropriateness of the quantile regression approach to compare differences between price segments, comparable to the analysis of Rebelo et al. [48]. However, considering the average wine price charged in the food retail trade was € 3.63 per litre in 2024 [35], it can be concluded that the FWA sample provides adequate representation of the food retail segment, thereby supplementing the high-price segment encompassed by the wine guide sample.
A comparison of the average quality rating achieved by form of enterprise revealed that cooperative wines receive lower ratings on average, although this effect was less pronounced in the rating by the Gault&Millau wine guide (1.0-point difference in the mean rating) than in the rating by Eichelmann (2.7 points difference in the mean rating). This trend was confirmed in the evaluation of the long-term performance of winegrowers’ cooperatives as they have a lower reputation than their competitors with other business forms (see Table A1). It can be assumed that consumers are deterred from buying cooperative wines primarily by lower reputation ratings, as these reflect the image of the respective company.
Comparing the share of cooperatives that achieve an award at the FWA, it appears that the difference from other enterprises in this sample was only limited (differences < 1.00%). From a descriptive perspective, the quality differences therefore seemed to vary between the observed price segments and evaluation platforms (see Table A2).
The results of the wine guide panel models are presented below, followed by a discussion and comparison of FWA models with the wine guide models.
With regard to its tested appropriateness (see section 4) an H-T model was estimated that corrected for potential endogeneity and included time-invariant variables at the same time. A Random Effects (RE) model was presented with the results to check for the robustness of the model.
Different wine guides evaluate a wine’s quality differently. This fact needs to be taken into account when estimating the effect of quality evaluations on the wine price [15,30]. However, when two evaluations of the same wine from two different wine guides are included, the regression model may exhibit correlations in the error term. A Spearman’s rank correlation test shows a moderately strong correlation between the two wine guide rating variables, i.e. QGM and QE (Spearman’s rank correlation rho = 0.65). Therefore, in order to check the robustness of the model, two alternative models have been estimated, one for each of the wine guide ratings. Estimation results from these models did not differ substantially.
Table 1 presents a comparison of the model results. A linear hypothesis testing for joint significance of the dummy variables of the cultivation area rejects the null hypothesis that the effect of the cultivation area is zero (Table 1, p-values = 0.00). Therefore, price differences between the cultivation areas of wine are statistically significant. The results revealed that statistically significant effects on the achieved wine price come from long-term storage of the wines, storage in barrique barrels, and high quality ratings (Table 1). Examining the results of the H-T model in detail revealed that the quality rating of a wine guide has a statistically significant positive influence on the achieved wine price. This demonstrates that, according to the hedonic pricing framework, the quality rating of a wine guide affects the consumers’ valuation and therefore the pricing of a wine. An increase in the quality rating of Gault&Millau by one point results in a 2.34 % price increase, or a 4.97 % price increase for a rating in the Eichelmann wine guide. The reputation rating of the wine guides in the year of tasting has no influence on price. However, a positive reputation rating in the Gault&Millau wine guide in the previous year (variable “lag(RGM)”) has a positive influence on the wine price in the year of tasting. This shows that consumers are to a certain extent oriented towards the long-term performance rating of targeted vineyards and wine cooperatives. Thus, for this sample, H3 could not be rejected for the quality rating, but it could be rejected for the reputation rating. Other product attributes that define wine quality have a positive influence on the price of wine. Wine ageing in barrique barrels lead to price increases of 6.08 %. Long-term storage also has a positive influence on wine price, as revealed by the significant effects of the vintage variables (Table 1; storage dummy variables). A three-year storage period has the greatest effect, leading to a price increase of 15.00 % in the H-T model. An influence of the form of organisation could not be confirmed in this model. The wide dispersion of the confidence interval for the cooperative enterprise variable [-0.69 - +0.88] for the H-T model (see Table 1, column “Cooperative”) confirmed the assumption that the distribution of achieved wine prices within the group of winegrowers’ cooperatives is so large that no statistically significant influence can be identified. It was concluded that wine producers listed in German wine guides are similar in terms of the price and quality strategies they pursue, despite their different forms of enterprises, and are comparable in terms of their competitiveness and positioning in the market.
| Variable nt = 264, t = 1-5, Nt =1-5 = 1320 |
Estimates HT Model (std. error) |
CI | Estimates RE Model (std. error) |
CI | ||
|---|---|---|---|---|---|---|
| 2.5 % | 97.5 % | 2.5 % | 97.5 % | |||
| Dependent variable = log(wine price in € per bottle) | ||||||
| (Intercept) | -3.04*** (0.40) | -3.82 | -2.25 | -3.47*** (0.36) | -4.17 | -2.77 |
| Quality rating Gault&Millau (QGM) | 0.02*** (0.00) | 0.01 | 0.03 | 0.02*** (0.00) | 0.01 | 0.03 |
| Quality rating Eichelmann (QE) | 0.05*** (0.00) | 0.04 | 0.06 | 0.05*** (0.00) | 0.04 | 0.06 |
| Reputation rating Gault&Millau (RGM) | 0.01 (0.01) | -0.02 | 0.03 | 0.00 (0.01) | -0.02 | 0.02 |
| Reputation rating Eichelmann (RE) | 0.01 (0.02) | -0.02 | 0.05 | 0.01 (0.01) | -0.02 | 0.03 |
| Cooperative | 0.09 (0.40) | -0.69 | 0.88 | 0.13 (0.08) | -0.04 | 0.29 |
| Size of growing region (ha) | 0.00 (0.00) | 0.00 | 0.00 | 0.00. (0.00) | 0.00 | 0.00 |
| Organic wine | -0.01 (0.02) | -0.05 | 0.03 | 0.00 (0.02) | -0.04 | 0.04 |
| Number of coop members | 0.00. (0.00) | 0.00 | 0.00 | 0.00 (0.00) | 0.00 | 0.00 |
| Vintage 2 years before rating | 0.12*** (0.02) | 0.08 | 0.16 | 0.12*** (0.02) | 0.08 | 0.16 |
| Vintage 3 years before rating | 0.15*** (0.03) | 0.09 | 0.20 | 0.16*** (0.03) | 0.10 | 0.21 |
| Vintage 4 years before rating | 0.14** (0.05) | 0.06 | 0.20 | 0.14** (0.04) | 0.05 | 0.22 |
| Barrique barrel | 0.05** (0.02) | 0.02 | 0.23 | 0.05** (0.02) | 0.02 | 0.09 |
| Red wine | 0.01 (0.03) | -0.04 | 0.06 | 0.02 (0.02) | -0.03 | 0.06 |
| Wooden barrel | 0.03. (0.02) | 0.00 | 0.06 | 0.03 (0.02) | -0.01 | 0.06 |
| lag(RGM) | 0.03** (0.01) | 0.01 | 0.05 | 0.03** (0.01) | 0.01 | 0.05 |
| lag(RE) | -0.02 (0.01) | -0.04 | 0.01 | -0.01 (0.01) | -0.04 | 0.01 |
| QGM high price segment | 0.01* (0.01) | 0.00 | 0.02 | 0.01* (0.01) | 0.00 | 0.02 |
| QGM low price segment | 0.00 (0.01) | -0.01 | 0.01 | 0.00 (0.01) | -0.01 | 0.01 |
| QE low price segment | -0.01 (0.01) | -0.02 | 0.00 | -0.01 (0.01) | -0.02 | 0.00 |
| QE high price segment | 0.0 (0.01) | -0.01 | 0.01 | 0.00 (0.01) | -0.01 | 0.01 |
| Growing regions | Linear hypothesis testing suggests joint significance (p = 0.00) | Linear hypothesis testing suggests joint significance (p = 0.00) | ||||
| Adjusted R2: | 0.821 | 0.868 | ||||
Nevertheless, the interaction term of a positive quality rating and the positioning of a wine in the high-price segment is statistically significant for the ratings of the Gault&Millau wine guide. This implies that a positive rating in the high-price segment (price > € 25.00) has a 1 % higher price effect than the equivalent quality rating for a wine sold at lower prices (price <= € 10.00) (Table 1, row “QGM high price segment”). Thus, high-price wines in particular benefit from having a quality evaluation in the Gault&Millau wine guide. It can be concluded that consumers are more likely to consult the ratings in wine guides when deciding to buy more expensive wines.
The model comparison between the H-T and RE models showed that the alternative estimates provided comparable results. Therefore, it was concluded that both models were robust. It should be noted that the RE model generally had smaller confidence intervals (see Table 1). The following section compares the findings of the analysis of the high-price segment with the price segments included in the FWA evaluation, examining several price quantiles in order to investigate i) if product attributes affect the wine price in the considered price segments differently and ii) how cooperative wines are positioned in the price segments in comparison to wines offered by other forms of enterprises.
5.3 Quantile Regression Models
The price ranges assigned to the estimated quantiles can be taken from the top row of Table 2. An examination of the residuals of the model indicated a predominant heteroscedasticity (Breusch-Pagan test’s p-value < 0.05). Therefore, robust standard errors according to White [49] were used to estimate the OLS model. Testing for multicollinearity of the explanatory variables using the variation inflation factor (VIF) showed a tolerable level of correlation with values < 10 for all of the variables included. Comparing the pseudo R2 as a local measure for goodness of fit of the particular quantile regression models shows that the models are able to represent the particular price quantiles with a relatively high explanatory power [47].
| Variable | OLS N = 18740 (robust std. error) |
25th-quantile N = 5037 (robust std. error) P ≤ 5.50 € |
50th-quantile N = 9685 (robust std. error) P ≤ 7.00 € |
75th-quantile N = 14131 (robust std. error) P ≤ 9.80 € |
90th-quantile N = 16868 (robust std. error) P ≤ 14.90 € |
||||||||||||||
|---|---|---|---|---|---|---|---|---|---|---|---|---|---|---|---|---|---|---|---|
| Dependent variable: log(wine price in € per bottle) | |||||||||||||||||||
| Wooden barrel | 0.314*** (0.015) | 0.305*** (0.020) | 0.333*** (0.011) | 0.362*** (0.022) | 0.422*** (0.033) | ||||||||||||||
| Barrique barrel | 0.612*** (0.017) | 0.637*** (0.014) | 0.719*** (0.019) | 0.688*** (0.011) | 0.602*** (0.032) | ||||||||||||||
| White wine | 0.132*** (0.008) | 0.065*** (0.004) | 0.086*** (0.007) | 0.128*** (0.008) | 0.186*** (0.009) | ||||||||||||||
| Red wine | 0.089*** (0.011) | 0.045*** (0.006) | 0.029*** (0.010) | 0.060*** (0.010) | 0.127*** (0.012) | ||||||||||||||
| Vintage 2 years before tasting | 0.168*** (0.012) | 0.081*** (0.006) | 0.140*** (0.011) | 0.208*** (0.014) | 0.266*** (0.019) | ||||||||||||||
| Vintage 3 years before tasting | 0.293*** (0.026) | 0.213*** (0.031) | 0.267*** (0.019) | 0.321*** (0.030) | 0.483*** (0.061) | ||||||||||||||
| Vintage 4 years before tasting | 0.542*** (0.083) | 0.173** (0.080) | 0.445** (0.181) | 0.866*** (0.088) | 0.946*** (0.060) | ||||||||||||||
| Gold Extra Award | 0.197*** (0.024) | 0.168*** (0.010) | 0.161*** (0.027) | 0.209*** (0.014) | 0.201*** (0.033) | ||||||||||||||
| Gold Award | 0.061*** (0.009) | 0.037*** (0.008) | 0.041*** (0.009) | 0.052*** (0.009) | 0.055*** (0.011) | ||||||||||||||
| Silver Award | 0.032*** (0.006) | 0.018*** (0.003) | 0.026*** (0.005) | 0.032*** (0.006) | 0.035*** (0.009) | ||||||||||||||
| Tasting year 2016 | 0.028*** (0.007) | 0.028*** (0.005) | 0.022*** (0.006) | 0.020** (0.008) | 0.034*** (0.012) | ||||||||||||||
| Tasting year 2017 | 0.059*** (0.007) | 0.053*** (0.004) | 0.040*** (0.007) | 0.043*** (0.008) | 0.063*** (0.012) | ||||||||||||||
| Tasting year 2018 | 0.036*** (0.007) | 0.042*** (0.004) | 0.034*** (0.007) | 0.023*** (0.008) | 0.044*** (0.014) | ||||||||||||||
| Tasting year 2019 | 0.061*** (0.008) | 0.056*** (0.005) | 0.059*** (0.007) | 0.050*** (0.008) | 0.068*** (0.010) | ||||||||||||||
| Size coop 100 - 199 ha | -0.152*** (0.008) | -0.076*** (0.005) | -0.136*** (0.007) | -0.197*** (0.008) | -0.192*** (0.013) | ||||||||||||||
| Size coop 200 - 499 ha | -0.105*** (0.008) | -0.031*** (0.006) | -0.098*** (0.008) | -0.158*** (0.010) | -0.146*** (0.011) | ||||||||||||||
| Size coop 500 - 999 ha | -0.211*** (0.014) | -0.136*** (0.008) | -0.211*** (0.015) | -0.242*** (0.015) | -0.263*** (0.018) | ||||||||||||||
| Size coop 1000 ha | -0.336*** (0.012) | -0.221*** (0.006) | -0.340*** (0.008) | -0.384*** (0.014) | -0.379*** (0.017) | ||||||||||||||
| Coop. size*Gold Award | 0.007 (0.008) | -0.010*** (0.003) | 0.012* (0.007) | 0.007 (0.007) | 0.012 (0.011) | ||||||||||||||
| Coop. size*barrique barrel | 0.012 (0.009) | -0.021*** (0.007) | -0.003 (0.015) | 0.011 (0.008) | 0.009 (0.013) | ||||||||||||||
| Coop. size*wooden barrel | -0.007 (0.010) | -0.032*** (0.010) | -0.006 (0.010) | -0.004 (0.012) | -0.036 (0.031) | ||||||||||||||
| Coop. size*red wine | -0.006 (0.005) | 0.011*** (0.002) | 0.007 (0.004) | -0.007 (0.004) | -0.017*** (0.006) | ||||||||||||||
| Coop*Gold Award | 0.008 (0.019) | 0.032*** (0.011) | -0.010 (0.018) | 0.019 (0.023) | -0.010 (0.026) | ||||||||||||||
| Intercept | 1.557*** (0.015) | 1.406*** (0.014) | 1.566*** (0.014) | 1.720*** (0.011) | 1.827*** (0.026) | ||||||||||||||
| Growing region | Linear hypothesis testing suggests joint significance (p=0.00) | ||||||||||||||||||
| Adjusted (Pseudo) R2 | 0.642 | 0.5538 | 0.5868 | 0.5868 | 0.6026 | ||||||||||||||
| . P≤0.1, *P≤0.05, **P≤0.01, ***P=0. | |||||||||||||||||||
However, potential endogeneity of some regressors cannot be ruled out completely. With regard to potential endogeneity of the quality evaluation and the cooperative variable an instrumental variable (IV) quantile regression model as suggested by Chernozhukov and Hansen [50] was estimated. However, a Kolmogorov-Smirnov post estimation test value turned out to be 1.012, which was less than the critical value of 2.722 (under 95% confidence interval). This finding failed to reject the hypothesis of exogeneity of the variables and we therefore present the quantile regression results without IV in Table 2.
Even though various independent product attributes are included in the analysis, information regarding the objective characteristics, i.e. the design of the bottle that potentially influences the hedonic price, could not be taken into consideration in the analysis. Therefore, the results need to be considered with caution with regard to potential occurring omitted variable bias.
In line with the results from the wine guide data described above, all the models showed that the ageing of wine in barriques or wooden barrels has a positive influence on the wine price. The effect amounts to a price increase of 42.2 % for a wine aged in wooden barrels in the price range of the 75th quantile (see Table 2). Barrique barrel ageing leads to price increases of 60-71 % compared with wine stored in steel tanks. In contrast to the wine guide dataset, the red wines in this sample achieve a price advantage compared with the reference category of rosé wines. White wines can also benefit from a relative price premium, where the effects vary with respect to the considered quantile. This showed that the price segment influences the effect of price-determining product attributes. The greatest effects are achieved in the 90 % quantile (18.6 % price increase for white wine and 12.7 % for red wine). The longer a wine is stored, the higher the price achieved. Especially in the price range up to € 14.90 per sold bottle of wine, a considerable price increase was found (see Table 2, column 5). For wines that are stored for four years, this results in a 94.6 % price premium compared with wines that are marketed without storage. Wine storage therefore plays a central role in the profitable marketing of wine.
As with the wine guide ratings, a positive quality rating also has a price-increasing effect for wines in the FWA sample. The higher the award, the greater the effect. A Gold Extra award increases the wine price by 16.1-20.9 % compared with the reference category of the lowest (Bronze) award, depending on the price segment. Compared with the Bronze award, the silver medal award only has an increasing price effect of 1.6-3.5 %, whereas the Gold award leads to an increase in the wine price of 3.7-6.1 %. As the quality rating has a positive effect in all price segments, H3 was not rejected for the models of the FWA.
A test for the joint significance of the regional dummies demonstrates that overall the cultivation area has a statistically significant effect on the wine price, in line with the H-T model results. The results of the estimated models showed that, compared with the Pfalz reference category, higher wine prices are achieved in all growing regions except for the Rheinhessen growing region. This also supported the hypotheses and results of Schäufele et al. [7], who also examined data from the FWA. Regional effects will therefore not be discussed further here. In the article by Schäufele et al. [7], however, organisational form was not the central focus of the investigations. The findings in relation to organisational effects will therefore be discussed in more detail below.
The quantile regression models revealed that winegrowers’ cooperatives achieve statistically significantly lower prices for the wines evaluated at the FWA than comparable wines produced by vintners of other organisational forms. However, there are differences in the extent of the price reduction, depending on the size of the cooperative. Furthermore, the price differences vary across price segments. Thus, cooperatively marketed wines in the price segment up to € 9.80 (75th quantile) are affected most by a price reduction (prices 15.8 to 38.4 % lower than in other forms of enterprises). Wines that are marketed at higher or lower prices experience smaller price reductions with respect to the producer’s organisational form. Considering the size of the respective winegrowers’ cooperatives, it is apparent that the largest wine cooperatives in Germany are exposed to the greatest price reductions (maximum -38.4 % in the price segment up to € 7.00). One possible reason for this is economies of scale, which enable the produced wines to be sold at lower unit prices [7].
Furthermore, it can be assumed that cooperatives with a comparably high sales volume consciously opt for volume sales at lower prices in order not to be exposed to intensive price competition with other winegrowers in higher price segments. In the lowest price segment (wines priced up to € 5.50) cooperatives experience the smallest price discount. In particular, cooperatives that were 200-499 ha in size only experience a price discount of about 3 % compared with other types of enterprises, which seems small given the limited coverage of the present data with respect to sales channels, advertising campaigns, rebates etc. Overall, the smallest price reductions are revealed for cooperatives of this size. Smaller wine cooperatives in turn achieve lower prices. The reason for this may be increased dependence on the satisfaction and preferences of their individual members. Due to the structural inertia in cooperatives’ decision-making processes, it is possible that a focus on high-quality wines increasingly demanded by consumers has not yet been integrated into the management of these winegrowers’ cooperatives and that the strategy of quantity-oriented production at lower prices is still being pursued.
Looking at the interaction of the effects (Table 2, independent variable A*independent variable B) between individual product characteristics and the organisational form and size of the winegrowers’ cooperatives, the positive effect of achieving a Gold award is also boosted within the group of cooperatives marketing wines in the price segment up to € 5.50 (972 observations i.e. 19.3 % of N in the 25th quantile) (see Table 2; 25th quantile, column “Coop.*Gold”). Cooperative wines of above-average quality are able to achieve an additional price advantage of 3.2 % compared with other vineyards and winegrowers’ cooperatives. If the size of the cooperative is considered, the positive effect is reduced as the size of the winegrowers’ cooperatives increases (-1.0 % per increased size category, Table 2 “Coop. size*Gold” in the 25th quantile). Hence, smaller winegrowers’ cooperatives with special quality strategies can position themselves competitively, but mostly in the lower price segment. Nevertheless, larger cooperatives that position their wines in the lowest price segment achieve a positive price effect by ageing their wines in wooden or barrique barrels. However, the overall positive effect of the storage type on price is reduced for the cooperative form of enterprise (negative interaction term “Coop. size*barrique barrel”).
The statistically significant influence of storage type and duration was confirmed by the second part of the analysis. Nevertheless, the effect size varies between the models, especially for the storage in barrique barrels. Furthermore, the storage in wooden barrels and the type of wine (red or white wine) only affects the price in the FWA sample.
H1 was not rejected for two reasons: On the one hand, the analysis reveals that there are different rating systems for the German wine market which apparently consider different price segments. On the other hand, it becomes clear that the effects of wine attributes on price vary between the two datasets: the wine guide data and the FWA data. We found that overall, the impact of quality signals—such as positive ratings on the respective platform, storage type, and vintage—is more pronounced in the lower price segments, as indicated by the FWA ratings. Therefore, wines in the lower price segments appear more sensitive to quality signals (or the mentioning of certain attributes) when it comes to achieving price premiums.
The different effects for the estimated price quantile regressions show that winegrowers’ cooperatives are not disadvantaged per se. Even though the results reveal the consumers seem value cooperative wines lower (see Table 2, negative coefficients for all sizes of cooperatives), depending on the structure of the cooperative and the design of the respective product attributes, the results indicated that certain groups of cooperatives are able to compensate structural disadvantages and can take pace with other forms of enterprises if they serve certain product attributes or market segments.
Compared with the results of the models based on wine guide data, the scattering of the effects of the cooperative form of enterprise on the observed wine price was explained more profoundly with this sample. As the effect differed between the estimated models of the wine guide and the FWA sample, and also in the different price segments (see Tables 1 and 2, columns “Coop”), H2 was not rejected. The effect of the form of enterprise on competitiveness depends on the price segment in which a cooperative markets their wines.
Nevertheless, with respect to the marketing of red wine in the lower price segment, larger winegrowers’ cooperatives achieve a price premium compared to cooperatives of other sizes (positive interaction term “Coop. size*red wine” for the 25th quantile). To sum up these findings, H4 was not rejected as the size mainly determines the price segment in which a cooperative can position its wines successfully.
Even though the effect size of the quality ratings was not directly comparable because the wine guides’ ratings are on a wider (100-point) scale than the medal-award system of the FWA, the tendencies are comparable overall and become especially visible for the numerous price segments in the FWA sample. The results presented in this chapter underline the assumed heterogeneity, structural differences and individuality of German winegrowers’ cooperatives that pursue different market strategies. The present analysis of the FWA only included cooperatives with 100 ha or more. Smaller cooperatives were not represented in the dataset. Therefore, only tendencies and no absolute statements can be derived with regard to the effects of size of cooperative.
These results confirm that the wine market in Germany is heterogeneous in terms of price segments and product attributes that determine the wine prices in the respective price segments [51].
With regard to the questions stated in the introduction we conclude that the variation of results in the existing literature regarding the competitiveness of cooperatives depends on i) the data used for the comparison of cooperatives and non-cooperatives and ii) the price segment in the scope of the analysis. It is concluded that the cooperative form of enterprise faces challenges in competing against other forms of enterprises on the wine market, but that the competitiveness depends on the size of the cooperative, the price level at which a cooperative sells its wines, the product attributes that characterise the produced wine, and the interaction between these determinants. The way in which structural differences between cooperatives are taken into account determines which conclusions on the competitiveness of cooperatives can be drawn.
Results show that wine guide ratings can be seen as an indicator of quality for consumers and lead to price premiums, in particular in the high-price segment (wine price ≥ € 25.00 per bottle). Cooperatives that are listed in wine guides and sell their wines in this price segment do not appear to be at a disadvantage compared with other forms of enterprises. Cooperatives that market their wines on the broader market and are evaluated by the FWA face tougher challenges competing with other forms of enterprises and achieving c.p. lower prices. The price disadvantage is the highest for large cooperatives ≥ 500 ha. It is likely that the large cooperatives tend to follow quantity rather that quality strategies to offset price disadvantages. However, cooperatives in the broader market can mitigate these price disadvantages, particularly in the segment of ≤ €5.50, if their wines receive a Gold Award from the FWA. Additionally, larger cooperatives in the price segment of ≤ € 7.00 can achieve a price premium and overcome competitive disadvantages if their wines receive a Gold Award. This suggests that, especially in low-price segments, consumers value quality attributes, as evidenced by the potential for achieving price premiums.
Therefore, based on this analysis, the following recommendations are presented for cooperatives in the wine sector:
Cooperatives that are producing wines that meet the requirements for a listing in wine guides can benefit from a high quality-evaluation and therefore may consider to apply for a listing in order to achieve the price premium. They should not feel discouraged by the competition of wine producers of other organisational forms but rather focus on the continuous provision of high-quality wines. To promote their wines, they could benefit from the use of marketing measures that underline the quality of the offered wines and make use of the positive ratings they achieve. This information needs to be promoted to the consumers.
Also, for cooperatives operating in the broader market quality attributes are essential and cannot be overlooked. As consumers’ willingness to pay and therefore the wine price is increased by product characteristics such as storage in wooden and barrique barrels, the production of red and white wines, duration of storage and the award of FWA medals, cooperatives in this market segment could benefit from the development of strategies to produce wines that carry the named characteristics and winning awards at the FWA. Strategies to enhance the quality of wine production among cooperative members may include incentives that encourage a consistent high-quality output. Additionally, effective mechanisms such as ongoing quality control on all farms by cooperative management throughout the growing season can help to reduce free-riding behaviour and may increase the average the quality of grapes delivered to the cooperative. Furthermore, the production and marketing processes could greatly benefit from aligning with the criteria set forth by the wine rating system of the FWAs. By implementing these strategies, it remains feasible to address the structural disadvantages inherent in the cooperative organizational model and to increase the average price of cooperative wines within this segment. Nevertheless, to successfully counteract these disadvantages, it is essential to maintain a market-oriented approach focused on quality attributes and quality signals.
Large cooperatives (≥ 500 ha) seem to face the biggest price disadvantages on the market. Often the way to compensate this disadvantage is to follow a quantity maximising strategy. Quality attributes, then play a minor role. However, with regard to the growing global competition and the fact that certain quality attributes can provide a price premium, choosing instead a diversification strategy might be an option for this group of cooperatives. As revealed by the results, even in the lowest price segments the provision of quality attributes lead to price premiums which are attractive for large cooperatives that mainly focus on serving quantities to the market. Large cooperatives should therefore feel encouraged to develop product lines that emphasize quality attributes, in order to benefit from the existing price advantages associated with quality-wines. From a managerial perspective, this necessitates that the prices paid to cooperative members are differentiated based on the quality of the grapes provided. This approach could incentivize the delivery of high-quality grapes.
In summary, cooperatives in the German wine market need to be sensitive to the demand for a wine’s product attributes and overall quality preferences among consumers and in the marketplace. In line with the findings of Troiano et al. [3], the results show that the adoption of marketing strategies that relay relevant product characteristics and the listing of high-price and high-quality wines in well-known wine guides provide an opportunity to overcome potential disadvantages of the form of enterprise and strengthen their market position. Diversification towards producing high-price and high-quality wines and strategic positioning in the retail market therefore seem promising strategies and potential business models for competitive winegrowers’ cooperatives.
This investigation into the competitiveness of German winegrowers’ cooperatives shows that the business form of cooperatives cannot be seen per se as a disadvantage compared with other business forms when comparing the wine prices achieved for a given wine quality. Instead, the results show that cooperatives operate in different price segments depending on their structure and therefore pursue differentiated business strategies. Furthermore, it can be deduced that the c.p. wine price achieved depends on the cooperative’s size, its positioning in the price segments of the wine market and its quality strategy. For future research in the field of the competitiveness of cooperatives, it would therefore be relevant to explore possible managerial and strategic success parameters as well as the market positioning strategies of cooperatives and to evaluate and compare them with strategies adopted by other forms of enterprises. As the hedonic pricing framework is a concept that is based on consumer demand and producers’ response to this, the production side of wine cooperatives is not considered in this article explicitly. Further investigations may therefore take into consideration the competitiveness of cooperative production processes and their cost structure. The limitations of this research can be summarized as follows: Cooperative and non-cooperative wine producers that are not listed in either wine guides or the FWA data are not considered. An analysis incorporating these producers and their market positions is therefore absent from this study. Moreover, the data utilized in this study do not encompass information regarding how wine producers market the quality ratings they receive for their wines, nor does it address the potential effects of such marketing on consumer perceptions and purchasing behaviour.
[1] J.H. Hanf, E. Schweickert, Cooperatives in the balance between retail and member interests: the challenges of the German cooperative sector, Journal of Wine Research 25 (2014) 32–44. https://doi.org/10.1080/09571264.2014.871122.
[2] M. Härle, J.H. Hanf, Wirkung von Einflussstrategien auf das Verhalten von Mitgliedern am Beispiel von Winzergenossenschaften, Mainz, Germany, 2015.
[3] S. Troiano, L. Rizzi, F. Marangon, Social or environmental consciousness? Exploring the consumption of cooperative wines among European citizens, WEP 12 (2023) 69–84. https://doi.org/10.36253/wep-14241.
[4] B. Frick, Does Ownership Matter? Empirical Evidence from the German Wine Industry, Kyklos 57 (2004) 357–386. https://doi.org/10.1111/j.0023-5962.2004.00258.x.
[5] A. Dilger, Prinzipal-Agenten-Probleme im deutschen Weinbau, Zeitschrift für das gesamte Genossenschaftswesen 55 (2005) 179–189. https://doi.org/10.1515/zfgg-2005-0126.
[6] G. Schamel, Can German Wine Cooperatives Compete on Quality?, Mainz, Germany, 2015.
[7] I. Schäufele, R. Herrmann, G. Szolnoki, Erzielen Weine mit höherer Qualität höhere Preise? Eine hedonische Preisanalyse zur DLG-Bundesweinprämierung, German Journal of Agricultural Economics 65 (2016) 132–150. https://doi.org/10.22004/ag.econ.284975.
[8] M. Dressler, Strategic winery reputation management – exploring German wine guides, International Journal of Wine Business Research 28 (2016) 4–21. https://doi.org/10.1108/IJWBR-10-2014-0046.
[9] G.H. Schamel, Structure, organization and a vision: Reasons for the success of wine cooperatives?, Punta del Este, Uruguay, 2019.
[10] D. Pennerstorfer, C.R. Weiss, Product quality in the agri-food chain: do cooperatives offer high-quality wine?, European Review of Agricultural Economics 40 (2012) 143–162. https://doi.org/10.1093/erae/jbs008.
[11] B. Richter, J. Hanf, Competitive Strategies for Wine Cooperatives in the German Wine Industry, WEP 9 (2020) 83–98. https://doi: 10.36253/web-8872.
[12] Deutsches Weininstitut, Wines of Germany: Statistics ‘22 / ‘23, Bodenheim, 2022.
[13] G. Szolnoki, D. Hoffmann, Consumer segmentation based on usage of sales channels in the German wine market, International Journal of Wine Business Research 26 (2014) 27–44. https://doi.org/10.1108/IJWBR-10-2012-0028.
[14] M. Minnici, Multidimensionale Erfolgsbewertung fusionierter Winzergenossenschaften in Deutschland. Dissertation, 2019.
[15] S. Castriota, D. Curzi, M. Delmastro, Tasters’ bias in wine guides’ quality evaluations, Applied Economics Letters 20 (2013) 1174–1177. https://doi.org/10.1080/13504851.2013.797552.
[16] G. Schamel, A. Ros, Indicators of Individual Wine Reputation for Friuli Venezia Giulia, Italian Economic Journal 7 (2021) 323–339. https://doi.org/10.1007/s40797-020-00138-9.
[17] D. Kaimann, Spiess Bru, Clarissa Laura Maria, B. Frick, Ratings meet prices: The dynamic relationship of quality signals, Journal of Wine Economics (2023) 1–19. https://doi.org/10.1017/jwe.2023.14.
[18] D. Marks, Seeking the Veritas about the Vino: fine wine ratings as wine knowledge, Journal of Wine Research 26 (2015) 319–335. https://doi.org/10.1080/09571264.2015.1083953.
[19] S. Landon, C.E. Smith, Quality Expectations, Reputation, and Price, Southern Economic Journal 3 (1998) 628–647. https://doi.org/10.1142/9789813232754_0001.
[20] C. Krieger, J.H. Hanf, V. Belaya, Markenbildung und -führung bei Winzergenossenschaften: Ergebnisse einer Unternehmensbefragung, Berichte über Landwirtschaft - Zeitschrift für Agrarpolitik und Landwirtschaft 92 (2014). https://doi.org/10.12767/buel.v92i3.56.
[21] J. Höhler, R. Kühl, Dimensions of member heterogeneity in cooperatives and their impact on organization - a literature review, Annals of Public and Cooperative Economics 89 (2018) 697–712. https://doi.org/10.1111/apce.12177.
[22] J.-P. Couderc, A. Marchini, Governance, commercial strategies and performances of wine cooperatives: An analysis of Italian and French wine producing regions, International Journal of Wine Business Research 23 (2011) 235–257. https://doi.org/10.1108/17511061111163069.
[23] G. Schamel, Coordinating for Quality: How Cooperatives can beat Private Wineries on Quality and Reputation, St. Catherines, 2013.
[24] J. Valette, P. Amadieu, P. Sentis, Cooperatives versus Corporations: Survival in the French Wine Industry, Journal of Wine Economics 13 (2018) 328–354. https://doi.org/10.1017/jwe.2017.1.
[25] B. Frick, Some Cooperatives Produce Great Wines but the Majority Does Not: Complementary Institutional Mechanisms to Improve the Performance of an Indispensable Organizational Form, J Wine Econ 12 (2017) 386–394. https://doi.org/10.1017/jwe.2017.33.
[26] R. Soboh, A. Oude Lansink, G. van Dijk, Efficiency of Cooperatives and Investor Owned Firms Revisited, Journal of Agricultural Economics 63 (2012) 142–157. https://doi.org/10.1111/j.1477-9552.2011.00324.x.
[27] M. Costanigro, J.J. McCluskey, Hedonic price analysis in food markets, in: J.L. Lusk, J. Roosen, J.F. Shogren (Eds.), The Oxford Handbook of the economics of food consumption and policy, Oxford University Press, Oxford, 2011, pp. 152–180.
[28] S. Rosen, Hedonic Prices and Implicit Markets: Product Differentiation in Pure Competition, Journal of Political Economy 82 (1974) 34–55. https://doi.org/10.1086/260169.
[29] S. Lecocq, M. Visser, What Determines Wine Prices: Objective vs. Sensory Characteristics, Journal of Wine Economics 1 (2006) 42–56. https://doi.org/10.1017/S1931436100000080.
[30] F. Livat, N.G. Vaillant, Expert opinion and brand reputation: an analysis from a French Cuban cigars guidebook, Applied Economics Letters 13 (2006) 97–100. https://doi.org/10.1080/13504850500390564.
[31] E. Oczkowski, Hedonic Wine Price Functions and Measurement Error, Economic Record 77 (2001) 374–382. https://doi.org/10.1111/1475-4932.00030.
[32] M. Algner, A. Fritsch, R. Reichel, Winzergenossenschaften im Wettbewerb, Zeitschrift für das gesamte Genossenschaftswesen 57 (2007) 167–177. https://doi.org/10.1515/zfgg-2007-0302.
[33] Gault&Millau, Gault&Millau Weinguide Deutschland 2020, ZS Verlag, 2019.
[34] G. Eichelmann, Eichelmann 2020 Deutschlands Weine, MONDO Heidelberg, Heidelberg, Neckar, 2019.
[35] Weinwirtschaft, LEH verkauft erneut weniger Wein, 2024. https://www.meininger.de/wein/handel/leh-verkauft-erneut-weniger-wein (accessed 29 October 2024).
[36] FWA, Bundesweinprämierung. https://www.dlg-bwp.de/de/, 2024 (accessed 15 April 2024).
[37] G. Schamel, German Wine: Measurement and Evaluation of Product Quality, in: K. Hagedorn (Ed.), Umwelt- und Produktqualität im Agrarbereich, Landwirtschaftsverl., Münster-Hiltrup, 2005, pp. 143–151.
[38] P. Fanasch, B. Frick, What Makes Cooperatives Successful? Identifying the Determinants of Their Organizational Performance, Journal of Wine Economics 13 (2018) 282–308. https://doi.org/10.1017/jwe.2018.28.
[39] J.A. Hausman, W.E. Taylor, Panel Data and Unobservable Individual Effects, Econometrica 49 (1981) 1377. https://doi.org/10.2307/1911406.
[40] B.H. Baltagi, Essays in Honor of Jerry Hausman, Emerald Publishing Limited, Bingley, 2012.
[41] C. Cornwell, P. Schmidt, D. Wyhowski, Simultaneous equations and panel data, Journal of Econometrics 51 (1992) 151–181. https://doi.org/10.1016/0304-4076(92)90033-N.
[42] B.H. Baltagi, Econometric Analysis of Panel Data, sixth ed., Springer, Cham, 2021.
[43] B.H. Baltagi, G. Bresson, A. Pirotte, Fixed effects, random effects or Hausman–Taylor?: A pretest estimator, Economics Letters 79 (2003) 361–369. https://doi.org/10.1016/S0165-1765(03)00007-7.
[44] B.H. Baltagi, Simultaneous equations with error components, Journal of Econometrics 17 (1981) 189–200. https://doi.org/10.1016/0304-4076(81)90026-9.
[45] R Core Team, R: A Language and Environment for Statistical Computing, Vienna, Austria, 2021. https://www.R-project.org/.
[46] R. Koenker, G. Bassett, Regression Quantiles, Econometrica 46 (1978) 33–50. https://doi.org/10.2307/1913643.
[47] R. Koenker, J.A.F. Machado, Goodness of Fit and Related Inference Processes for Quantile Regression, Journal of the American Statistical Association 94 (1999) 1296–1310. https://doi.org/10.1080/01621459.1999.10473882.
[48] J. Rebelo, L. Lourenço-Gomes, T. Gonçalves, J. Caldas, A hedonic price analysis for the Portuguese wine market: Does the distribution channel matter?, Journal of Applied Economics 22 (2019) 40–59. https://doi.org/10.1080/15140326.2018.1550596.
[49] H. White, A Heteroskedasticity-Consistent Covariance Matrix Estimator and a Direct Test for Heteroskedasticity, Econometrica 48 (1980) 817–838. https://doi.org/10.2307/1912934.
[50] V. Chernozhukov, C. Hansen, The Effects of 401(K) Participation on the Wealth Distribution: An Instrumental Quantile Regression Analysis, Review of Economics and Statistics 86 (2004) 735–751. https://doi.org/10.1162/0034653041811734.
[51] R. Del Rey, S. Loose, State of the International Wine Market in 2022: New market trends for wines require new strategies, WEP 12 (2023) 3–18. https://doi.org/10.36253/wep-14758.
| Dependent variable | Vector symbol | H-T variables | Mean (max.; min.; std. dev.) non-coops | Mean (max.; min.; std. dev.) coops | |||||||||||||||
|---|---|---|---|---|---|---|---|---|---|---|---|---|---|---|---|---|---|---|---|
| nt = 264, t = 1-5, Nt=1-5 = 1320 | |||||||||||||||||||
| Wine price per bottle (0.75 l) | P | Y | 16.8 (85.0; 4.9; 10.3) | 14.5 (49.3; 4.1; 7.8) | |||||||||||||||
| Independent variables | |||||||||||||||||||
| Quality ratings (Overlap* of the two wine guides: 75.76 %) |
|||||||||||||||||||
| Quality rating Gault&Millau (QGM) | Q | X2 | 86.8 (100.0; 79.0; 2.7) | 85.8 (96.0; 75.0; 1.9) | |||||||||||||||
| Quality rating Eichelmann (QE) | Q | X2 | 86.6 (98.0; 80.0; 2.7) | 83.9 (89.0; 79.0; 2.4) | |||||||||||||||
| Reputation rating Gault&Millau (RGM) | R | X2 | 2.4 (5.0; 1.0; 1.1) | 1.6 (4.0; 1.0; 0.6) | |||||||||||||||
| Reputation rating Eichelmann (RE) | R | X2 | 3.1 (5.0; 1.0; 1.0) | 1.5 (2.5; 1.0; 0.5) | |||||||||||||||
| Number of members cooperative | F | Z2 | 1 (1; 1; 0) | 385 (1325; 45; 327) | |||||||||||||||
| Acreage (ha) | F | X1 | 18.3 (104; 0.7; 20) | 288.0 (1231; 85; 302) | |||||||||||||||
| Dummy-Variables | Share in % | ||||||||||||||||||
| non-coops | coops | ||||||||||||||||||
| Dummy cooperative | F | Z2 | 18.18 | ||||||||||||||||
| Dummy red wine | W | X1 | 28.0 | 42.2 | |||||||||||||||
| Dummy organic agriculture | F | X1 | 27.1 | 6.25 | |||||||||||||||
| Dummy storage wooden barrel | W | X1 | 12.8 | 16.2 | |||||||||||||||
| Dummy storage barrique barrel | W | X1 | 15.3 | 13.5 | |||||||||||||||
| Dummy vintage 2 years before rating(V2) | W | X1 | 18.9 | 34.4 | |||||||||||||||
| Dummy vintage 3 years before rating (V3) | W | X1 | 11.2 | 15.6 | |||||||||||||||
| Dummy vintage 4 years before rating (V4) | W | X1 | 2.1 | 5.2 | |||||||||||||||
| Dummy variables for growing regions (13) | A | Z1 | Mean share of each growing region: 7.7 % | ||||||||||||||||
| Dummy high price segment (> € 25 per bottle) | W | X1 | 17.5 | 11.5 | |||||||||||||||
| Dummy low price segment (≤ € 10 per bottle) | W | X1 | 32.4 | 44.3 | |||||||||||||||
| *Overlap is defined as the amount of wines that are identically listed in both wine guides at the same time period. | |||||||||||||||||||
| Dependent variable | Vector symbol | Mean (max.; min; std.dev.) non-coops | Mean (max.; min; std.dev.) coops | |
|---|---|---|---|---|
| Wine price per bottle (0.75 l) (N=18740) | P | 9.1 (89.0; 1.9; 5.8) | 8.3 (69.5; 1.8; 5.2) | |
| Independent variables Share in % | ||||
| Non-Coops | Coops | |||
| Quality ratings | Q | |||
| Gold Extra Award | 1.4 | 1.2 | ||
| Gold Award | 25.1 | 24.2 | ||
| Silver Award | 47.7 | 48.5 | ||
| Bronze Award | 26.0 | 25.9 | ||
| Cooperatives’ characteristics | F | |||
| Dummy cooperatives (coop) | - | 43.6 | ||
| Cooperatives 100-199 ha (1) | - | 27.5 | ||
| Cooperatives 200-499 ha (2) | - | 34.1 | ||
| Cooperatives 500-999 ha (3) | - | 15.1 | ||
| Cooperatives ≥ 1000 ha (4) | - | 13.3 | ||
| Wine characteristics | W | |||
| Dummy red wine (reference = rosé wine) | 23.7 | 39.1 | ||
| Dummy white wine (reference = rosé wine) | 67.2 | 51.1 | ||
| Dummy storage wooden barrel | 8.2 | 6.9 | ||
| Dummy storage barrique barrel | 5.9 | 7.4 | ||
| Dummy Vintage 2 years before tasting | 7.4 | 12.2 | ||
| Dummy Vintage 3 years before tasting | 2.3 | 1.7 | ||
| Dummy Vintage 4 years before tasting | 0.6 | 0.2 | ||
| Taste | W | |||
| Sweet | 0.6 | 0.8 | ||
| Mild | 3.1 | 7.7 | ||
| Dry | 19.3 | 25.9 | ||
| Semi-dry | 3.3 | 5.2 | ||
| Not specified | 73.8 | 60.5 | ||
| Quality designation | W | |||
| Qualitätswein | 62.7 | 63.3 | ||
| Kabinett | 10.7 | 15.3 | ||
| Spätlese | 19.1 | 15.2 | ||
| Auslese | 5.3 | 3.0 | ||
| Beerenauslese | 1.2 | 1.6 | ||
| Trockenbeerenauslese | 0.5 | 0.7 | ||
| Eiswein | 0.6 | 0.9 | ||
| Growing regions (13) A Mean share of each growing region: 7.69 % | ||||
| Dummy variable high price segment (> € 25) | W | 2.4 | 1.79 | |
| Dummy variable low price segment (≤ € 10) | W | 75.62 | 81.44 | |
1 It has to be noted that this assumption excludes small wine cooperatives that cultivate less than 100 ha. While the structure of the data and the information gathered through personal contacts to the data source provided valuable insights, they currently limit our ability to characterize the group of cooperatives in greater detail.