Innovation capacity of Brazilian wineries: an integrated approach using the fuzzy Delphi and random forest methods
1 Department of Administrative Sciences, Federal University of Santa Maria, Av. Roraima nº 1000, Cidade Universitária, 74C Building, Camobi, Santa Maria – RS, Brazil, CEP: 97105-900
2 Postgraduate Program in Administration, Federal University of Santa Maria, Av. Roraima n. 1000, Cidade Universitária, 74C Building, Camobi, Santa Maria – RS, Brazil, CEP: 97105-900
3 Department of Knowledge Engineering, Federal University of Santa Catarina, R. Eng. Agronômico Andrei Cristian Ferreira nº s/n, Trindade, Florianópolis – SC, Brazil, CEP: 88040-900
*Corresponding author. Email: lflopes67@yahoo.com.br
Abstract. The innovation capacity of organizations, particularly in the competitive Brazilian wine industry, plays a pivotal role in their performance and competitiveness. This study aimed to identify and validate metrics for assessing the innovation capacity of Brazilian wineries through a two-stage research process. Initially, a systematic literature review was conducted using Scopus and Web of Science databases. This phase was followed by a quantitative analysis involving 44 Brazilian winery managers, utilizing the Fuzzy Delphi and random forest methods to validate and prioritize the dimensions and indicators of innovation capacity. Out of 88 potential indicators spanning eight dimensions, 50 were confirmed as validated through the Fuzzy Delphi method, as their defuzzified values exceeded the predetermined cutoff threshold. Research and development, product and service innovation, and sustainability and environmental initiatives emerged as the most critical dimensions, collectively representing over half of the innovation capacity in the wineries. Additional significant, albeit less dominant, dimensions included customer feedback and relationships, emphasizing the importance of consumer engagement, and process efficiency, highlighting the significance of operational effectiveness. While not as prominently, employee engagement and training, strategic collaboration, and market adaptation and diversification were identified as essential for sustained innovation. This research provides strategic metrics to enhance the competitiveness and sustainability of Brazilian wineries.
Keywords: innovation, competitiveness, sustainability, research and development, viticulture.
Index
2.1 The wine industry and innovation capacity
2.2 Dimensions and Indicators of Innovation Capacity
3.1 Validation of indicators using the Fuzzy Delphi method
Supplementary material (Appendix)
Glossary of technical terms used in data analysis
3.2 Ranking of dimensions using the Random Forest Importance (RFI) technique
4.1 Identification of dimensions and innovation capacity indicators
4.2 Data collection and analysis
5.1 Limitations, potential biases in the methodology, and future directions
Supplementary material (Appendix)
Glossary of technical terms used in data analysis
The concept of innovation has evolved to encompass elements from all stages of the knowledge production chain, promoted as an essential tool for addressing national challenges. This perspective on innovation, bolstered by policies that extend beyond economic viewpoints, emphasizes its significance [1]. Innovation capacity (IC) has risen to prominence for its role in decision-making and strategy implementation, markedly influencing organizational performance [2]. Research conducted by Kamal et al. [3] suggests that IC is vital for harnessing the relationship between radical innovation and performance, highlighting the critical role of IC in facilitating radical innovation. Furthermore, IC is instrumental in sustainable growth as it enables the integration of various organizational components and their linkage to outcomes in product, process, market, and organizational innovations [4–6].
At the organizational level, IC is shaped by strategy, leadership, structure, systems, and culture [7]. It signifies an organization’s capability to develop new or enhanced products and knowledge [8]. Thus, evaluating IC is crucial, given the uncertain and complex nature of innovation processes, which necessitates accurate measurement methods to ensure alignment with innovation goals [9]. Studies have developed methods to evaluate IC in industrial clusters, small and medium-sized enterprises (SMEs), and the role of IC in promoting sustainability [10–13].
Nevertheless, metrics specific to certain contexts, such as the winery sector in emerging economies such as Brazil, are limited [14]. However, while the concept of IC has been explored in various industrial contexts, there remains a notable gap in metrics tailored for sector-specific challenges, particularly for industries in emerging economies. The Brazilian wine sector exemplifies this need, as it faces unique barriers related to climate adaptation, resource sustainability, and regional market dynamics that are not fully addressed by existing IC frameworks [15].
As of 2023, Brazil ranks as the 15th largest wine producer globally, with the southernmost state of Rio Grande do Sul accounting for approximately 62.41% of the country’s production. This demonstrates its established dominance in the vitiviniculture sector, supported by favorable climatic conditions and advanced production techniques [18,19]. While the southern region leads in production, the southeastern and northeastern regions of Brazil are becoming increasingly prominent, showcasing significant potential for growth.
The southeastern region, particularly in states such as São Paulo and Minas Gerais, has demonstrated potential through the adoption of innovative logistical practices, including postponement strategies that enhance production efficiency and responsiveness to market demands [20,21]. Meanwhile, the northeastern region, characterized by its unique terroir and the capability to produce high-quality wines under tropical conditions, offers opportunities for expanding Brazil’s wine diversity and competitiveness in niche markets [22]. These developments underscore the increasing diversification of Brazil’s wine production landscape, contributing to its growing prominence on the global stage. The industry faces challenges related to climate change, sustainability, and domestic and international competition [23].
This study explores how to evaluate the innovation capacity of Brazilian wineries to identify and validate metrics for IC assessment, uncover the best practices, challenges, and innovations within the sector [24]. Few studies have focused on IC in the winery context, highlighting the significance of this research [25]. This study is also socially relevant as it supports family farming-based companies, creates employment, and enhances rural product value, contributing to the economic and social resilience of wine-producing areas [26–28]. Furthermore, it enriches the literature on innovation management by offering empirical and theoretical insights into winery innovation dynamics [14,29].
2.1 The wine industry and innovation capacity
The wine industry is a significant agricultural sector, contributing to the economy and sustainability, with the global wine market’s revenue projected to reach approximately 175.9 billion dollars by 2024 [21,31]. In Brazil, the wine industry is mainly concentrated in the southern region, representing about 73% of the nation’s planted area and producing around 951,000 tons of grapes in 2021 [17]. Innovation in wineries transcends internal efforts, stemming from collaborations with stakeholders [31].
Innovation is a multidimensional concept that has been explored through various theoretical frameworks. For instance, Schumpeter (1947) [32] defines innovation as conducting activities in a novel way, while Garcia and Calantone (2002) [33] emphasize that innovation is not solely about the product itself but also about the social context that enables its commercialization. Similarly, Crossan and Apaydim (2010) [34] argue that innovation encompasses how a product is delivered, marketed, and produced. These perspectives provide distinct yet complementary insights into the concept of innovation.
When considering open innovation – defined as the internal and external use of knowledge to accelerate the innovation process [35] – the Triple Helix Model, proposed by Leydesdorff and Etzkowitz [36], emerges as a key theoretical framework. This model highlights the interactions between universities, industries, and governments as central drivers of innovation. It posits that innovation does not result solely from linear processes within a single organization but instead emerges from dynamic, collaborative networks that integrate knowledge creation, technological advancements, and political support.
In the context of wineries, the Triple Helix Model is particularly relevant, as partnerships with research institutions foster technological advancements in viticulture and oenology, thereby enhancing innovation capacity and competitive advantage. Innovation capacity, a critical factor for improving organizational performance [37], is influenced not only by technological progress but also by the ability to adapt to market demands and customer expectations. Engaging in innovative practices and collaborating with complementary entities strengthen wineries’ value propositions by addressing technological, environmental, and market challenges [38,39].
Furthermore, the ability to innovate relies on an organization’s internal competencies and its capacity to overcome inherent limitations. This includes the development of new products or services, as well as fostering customer readiness to adopt these innovations [40]. The Triple Helix Model also underscores the importance of government policies in establishing an environment conducive to innovation, which is crucial for the growth, sustainability, and global competitiveness of wineries. By applying this model to assess innovation processes, a holistic perspective emerges – aligning organizational practices with systemic drivers of innovation and emphasizing the strategic significance of cross-sector collaboration.
Karagiannis and Metaxas [41] noted the importance of government support and collaboration between wineries and research institutions, including tax incentives, research and development funding, and training programs. Measuring innovation performance in the wine industry is challenging due to its unique attributes, which often result in expensive data collection and analysis [24]. Nevertheless, addressing these challenges is essential, as innovation significantly impacts marketing, sustainability, and product and service offerings [42-44]. It is key to fulfilling consumer demands, achieving competitiveness and sustainability, and ensuring wineries’ development and survival, as positive innovation capacity positively influences business performance [41,45-47].
2.2 Dimensions and Indicators of Innovation Capacity
Innovation in the wine industry can be effectively assessed through a structured approach that includes specific dimensions and their corresponding indicators. These dimensions encompass key aspects of innovation, such as Research and Development, Strategic Collaboration, Employee Training and Engagement, Process Efficiency, Product and Service Innovation, Sustainability and Environmental Initiatives and Customer Feedback and Relationship. Each of these dimensions is essential for measuring innovation capacity and reflects the unique challenges and opportunities within the wine industry. This framework of dimensions and indicators provides a comprehensive approach to assessing innovation capacity tailored to the wine industry.
This section outlines the methods and criteria employed to analyze the innovation capacity dimensions of Brazilian wineries. The qualitative and quantitative study is based on a systematic literature review and a scale assessing the importance of various dimensions and indicators according to winery specialists [48-50]. The data collection and analysis were conducted in two stages, as depicted in Figure 1.
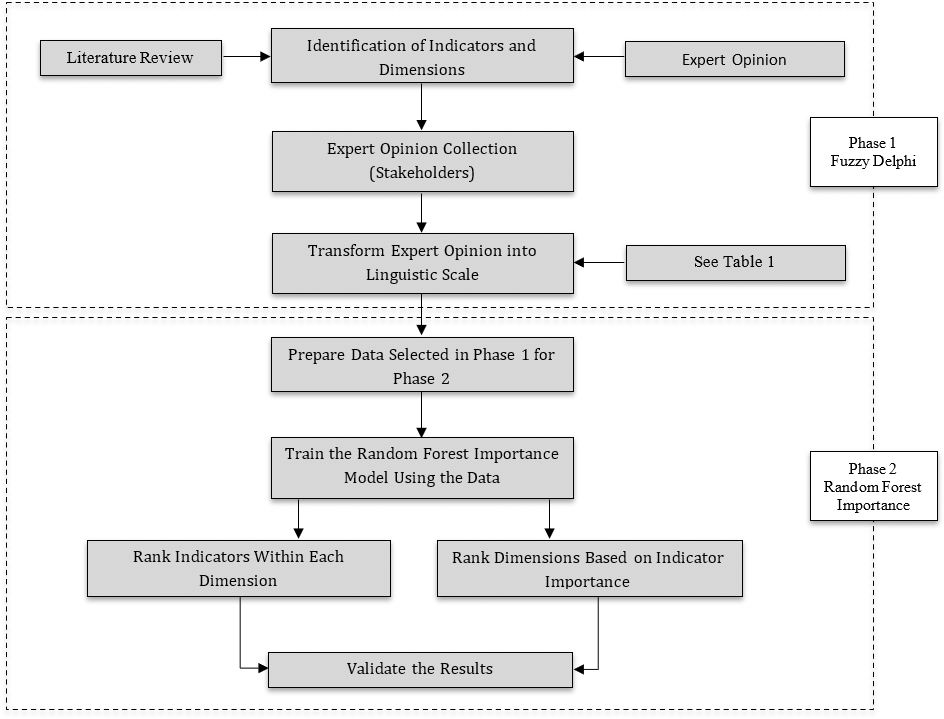
The initial stage commenced with a systematic literature review utilizing the Scopus and Web of Science databases, employing the search strings: ((“Innovation capacity” OR “Innovation capability”) AND (“SME*” OR “small* business*” OR “medium company*” OR “small and medium enterprise*” OR “medium business*” OR “small company*”)).This review yielded 3,222 articles, from which 193 were chosen based on their classification in the Q1 and Q2 quartiles, denoting the top 50% of most cited articles from high-impact journals according to the Scimago rankings. Subsequently, 67 articles focusing on small and medium enterprises were selected for further analysis.
This process identified key dimensions and innovation capacity indicators pertinent to wineries, establishing a solid theoretical foundation. Analysis of these articles revealed 88 indicators across nine dimensions: research and development (R&D) with 16 indicators, strategic collaborations (SC) with 6 indicators, employee training and engagement (ETE) with 8 indicators, process efficiency (PE) with 16 indicators, product/service innovation (P/SI) with 16 indicators, sustainability and environmental initiatives (SEI) with 9 indicators, market adaptation and diversification (MAD) with 6 indicators, and customer feedback and relationship (CFR) with 11 indicators.
The first step’s second stage was the validation of these indicators and dimensions using the Fuzzy Delphi method, informed by responses from 44 experts comprising winery managers. Data were collected via in-person and online questionnaires through Google Forms, ensuring participant anonymity to protect privacy. The study adhered to ethical standards, providing a consent form outlining the research objectives and the voluntary nature of participation. An ethical approval certificate was obtained from the Research Ethics Committee (CAAE no. 53139921.0.0000.5346).
3.1 Validation of indicators using the Fuzzy Delphi method
As previously mentioned, to validate the indicators within their respective dimensions, responses from 44 experts were utilized, employing the Fuzzy Delphi method for analysis. The Fuzzy Delphi method is a technique derived from the traditional Delphi method, first developed by Dalkey & Helmer (1963) [51], which has been used to gather information through a systematic feedback process from experts [52].
The Delphi technique is a methodology used to achieve consensus among experts, applied in contexts where specialized knowledge and collective opinion are relevant for decision-making [53]. It should be noted that since its creation, the method’s intent is to help establish a consensus among different opinions – in this case, those of winery experts – to define the most accurate decision within a group (dimensions) as decision-makers [54,55].
Ishikawa et al. (1993) [56] proposed the Fuzzy Delphi method to address the uncertainty present in data collection based on human opinion, utilizing Max and Min values. This method resulted in improvements regarding the number of iterations required by the traditional Delphi method, as well as savings in time and costs. Since its development, the method has been used to define and validate innovation capacity indicators through expert feedback, identifying and prioritizing the most relevant indicators for measuring innovation in different organizational contexts [57].
To apply the Fuzzy Delphi method, specific calculations are required, involving the manipulation of data obtained through the systematic collection of information from experts. These calculations are inherent to the process of aggregating opinions and modeling the uncertainty associated with the subjective evaluations of the experts [58]. Based on the research of Singh & Sarkar (2020) [59] and Mabrouk (2021) [60], the Fuzzy Delphi method includes the following phases:
1. Development of indicators: Initially, 88 indicators were identified from the literature, subdivided into 9 dimensions.
2. Data collection and expert judgments: The experts, characterized by winery managers, were tasked with evaluating the importance of the indicators related to their respective dimensions. Each respondent used the linguistic scale presented in Table 1.
| Linguistic Variable | Value | Corresponding Triangular Fuzzy Numbers | |||||||||||||||||
|---|---|---|---|---|---|---|---|---|---|---|---|---|---|---|---|---|---|---|---|
| Extremely unimportant | 1 | (0.1, 0.1, 0.3) | |||||||||||||||||
| Unimportant | 2 | (0.1, 0.3, 0.5) | |||||||||||||||||
| Indifferent | 3 | (0.3, 0.5, 0.7) | |||||||||||||||||
| Important | 4 | (0.5, 0.7, 0.9) | |||||||||||||||||
| Extremely Important | 5 | (0.7, 0.9, 0.9) | |||||||||||||||||
| Source: Singh & Sarkar (2020). | |||||||||||||||||||
After collecting the experts’ judgments, the linguistic variables are converted into triangular Fuzzy numbers for = (aij, bij, cij) for i = 1, 2,…, n & j = 1, 2, 3,…, m, where: represents the importance of the i-th indicador do j-th expert, n indicates the number of indicators, and mmm denotes the number of experts.
The Fuzzy weights of the barriers ( ) are described as follows:
(1)
Next, defuzzification is performed using the center of gravity method proposed by Hsu et al. (2010) [61].
(2)
To determine the cutoff point, the threshold was established by comparing the weight of the indicator with the threshold , where the weight of is calculated by averaging the weights of all the indicators . This procedure follows the methodology adopted by Bouzon et al. (2016) [62], where the inclusion and exclusion principles are as follows: if ≥ the indicator j is included, and if < the indicator j is excluded.
It is important to note that and are combined Fuzzy sets, and therefore it is necessary to transform them into crisp values to make comparisons (equation 3).
(3)
The method presented is appropriate for the data, as it allows for the validation of indicators to compose the model and assess the innovation capacity of Brazilian wineries. This method has proven effective in several studies in the field of innovation, which used the technique to define and validate performance indicators [63-65].
It is worth noting that this method was implemented using a Python algorithm developed by the authors. The result is in the Appendix (supplementary material). Following the validation, the second phase began (Table 4), applying the Random Forest Importance (RFI) technique to generate importance weights for the dimensions and indicators.
| Dimension | Indicator | Degree of importance (%) | Accuracy | ||
|---|---|---|---|---|---|
| Dimension | Indicator | Mean | SD | ||
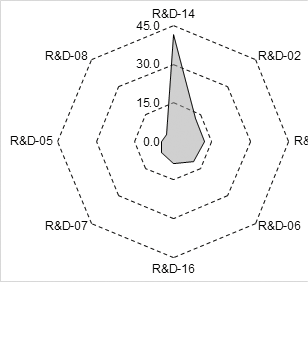
| Research and Development | 22.63 | 0.97 | 0.174 | ||
|
14 - Success rate of R&D projects, measured by the number of successfully completed projects relative to the total number of projects initiated | 41.51 | |||
| 02 - Number of R&D projects executed internally | 12.33 | ||||
| 10 - Number of tests and experiments conducted to validate new ideas or prototypes | 12.33 | ||||
| 06 - Monetary value allocated to internal R&D activities during the year | 10.91 | ||||
| 16 - Number of low-cost innovations implemented (frugal innovations) | 8.48 | ||||
| 07 - Number of funding programs or grants obtained for R&D projects | 6.36 | ||||
| 05 - Number of new products launched | 4.55 | ||||
| 08 - Percentage of the R&D budget in relation to the company’s total budget | 3.53 | ||||
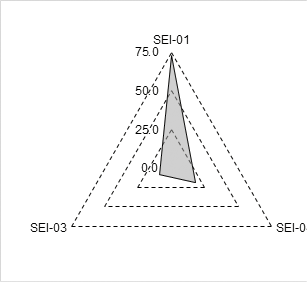
| Sustainability and Environmental Initiatives | 15.52 | 0.93 | 0.177 | ||
|
01 - Total energy consumption from renewable sources | 72.77 | |||
| 04 - Percentage of total waste generated that is recycled or reused | 18.33 | ||||
| 03 - Total water consumption per unit of product produced | 8.90 | ||||
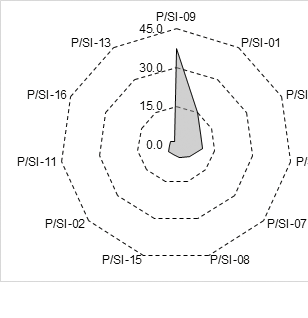
| Product and Service Innovation | 15.35 | 0.69 | 0.175 | ||
|
09 - Success rate of new products or services based on market acceptance | 38,27 | |||
| 01 - Number of new services launched | 15.50 | ||||
| 03 - Revenue generated from new products or services | 10.81 | ||||
| 12 - Number of ongoing innovation projects | 10.65 | ||||
| 07 - Cost of developing new products or services | 7.28 | ||||
| 08 - Development time from conception to launch | 5.37 | ||||
| 15 - Number of products or services that meet new consumer needs | 4.21 | ||||
| 02 - Number of significantly improved products or services | 3.90 | ||||
| 16 - Environmental impact of new products or services (sustainability) | 2.67 | ||||
| 13 - Customer feedback on innovations (satisfaction and acceptance) | 1.33 | ||||
| Customer Feedback and Relationship | 14.61 | 0.86 | 0.240 | ||
|
06 - Percentage of complaints resolved during the first interaction with the customer | 58.44 | |||
| 10 - Total number of customer interactions on social media platforms, including comments, likes, and shares | 12.48 | ||||
| 07 - Measure reflecting the likelihood of customers recommending the winery to others | 10.66 | ||||
| 05 - Total number of complaints received within a specific period | 6.56 | ||||
| 11 - Average time the company takes to respond to customer requests, measured in hours or days | 4.33 | ||||
| 04 - Percentage of customers who continue doing business with the winery year after year | 3.92 | ||||
| 09 - Percentage of potential customers (leads) that become buyers | 3.61 | ||||
3.2 Ranking of dimensions using the Random Forest Importance (RFI) technique
To create the ranking of dimensions based on the indicators validated by the Fuzzy Delphi method, a Machine Learning algorithm was developed in Python, specifically using the Random Forest Importance (RFI) technique [66]. This technique aims to provide accurate and reliable predictions while robustly calculating the importance of the dimensions. The use of the RFI technique to calculate the degree of importance of dimensions has proven extremely effective in various research areas and practical applications [67-69]. The technique is valued for its ability to provide an interpretable degree of importance for dimensions, which is highly relevant for data-driven analysis and decision-making.
Based on the research of Li (2021) [70] and Mizumoto (2023) [71], the RFI technique follows these procedures: To construct the decision tree, bootstrapping (sampling with replacement) is required, where each tree is trained on a random subset of the training data; node splitting is then applied, where the best split point for each node is selected to minimize impurities [Gini impurity (Equation 4) and impurity reduction (Equation 5)].
(4)
where:
t: decision tree node containing a subset of winery experts;
D: total number of dimensions;
pi: proportion of indicators belonging to dimension i in node t.
(5)
meaning:
ΔIt: Impurity reduction at node t;
I(t): Impurity of node t (calculated by Gini);
tparent: Parent node before the split;
tL: Left child node after the split;
tR: Right child node after the split;
pL: Proportion of indicators going to the left child node tL;
pR: Proportion of indicators going to the right child node tR.
The importance of the indicators is calculated by the average impurity reduction, while the importance by dimension is given by the sum of the indicator importance:
;(6)
;(7)
where:
Ntree: the number of decisions trees;
Tj: sets of nodes in tree j;
pt: proportion of samples that pass-through node t.
Both the importance of the indicators (Equation 8) and the importance of the dimensions (Equation 9) will be evaluated in relation to the total, that is, the relative importance:
;(8)
(9)
where j is the indicator, k is the number of indicators, m is the dimension, and n is the number of dimensions.
To ensure the reliability and generalizability of the Random Forest Model in evaluating innovation indicators, a cross-validation process was implemented using 5-fold cross-validation. This method, as noted in the literature [72], mitigates overfitting and assesses performance by dividing the dataset into k folds, iteratively training on k−1 folds, and testing on the remaining one. For each fold, i, the accuracy was computed as follows:
;(10)
The mean accuracy and standard deviation were calculated to assess the overall predictive performance of the model.
; and(11)
(12)
where k represents the number of folds.
For a detailed explanation of the data analysis methods, including specific formulas, steps, and their application in this study, please refer to the supplementary material provided in the Appendix. This material encompasses Python algorithms used for implementing the Fuzzy Delphi and Random Forest Importance methods, as well as additional results and sensitivity analyses.
4.1 Identification of dimensions and innovation capacity indicators
Table 2, summarizes the dimensions and indicators along with supporting literature.
| Dimension | Description of Dimension | Key Indicators | Supporting Authors |
|---|---|---|---|
| Research and Development | Research and Development refers to the deliberate efforts of an organization to create new or improved products | Number of R&D projects, partnerships, R&D budget % | Engelmann (2024) [73]; Doloreux & Lord-Tarte (2013) [74]; Alonso & Bressan (2014) [75] |
| Strategic Collaboration | Ability to form partnerships that enhance innovation and competitiveness | Number of partnerships, partnership satisfaction | Alonso & Bressan (2016) [75]; Corvello et al. (2023) [76]; Presenza et al. (2017) [77] |
| Employee Training and Engagement | Organizational structure and culture that foster employee participation and motivation | Training hours, promotion rates, job satisfaction | Deci & Ryan (2000) [78]; Rampa & Agogué (2021) [79]; Sánchez-García et al. (2023) [80] |
| Process Efficiency | Focuses on optimizing processes to reduce waste and improve resource utilization | Production cycle time, waste rate, energy efficiency | Alonso & Bressan (2014) [75]; Awogbemi et al. (2022) [81]; |
| Product and Service Innovation | Creation of new products or enhancement of existing offerings | Number of new products, revenue from new products | Batistella et al. (2023) [82]; Castro et al. (2024) [83] |
| Sustainability and Environmental Initiatives | Adoption of eco-friendly practices to reduce environmental impact | Renewable energy use, emissions reduction, sustainable practices investment | Alonso & Bressan (2014) [75]; Kelley et al. (2022) [84]; Montalvo-Falcón et al. (2023) [85] |
| Market Adaptation and Diversification | Expansion into new markets and adaptation to changing consumer demands. | Number of new markets, revenue diversity, wine tourism | Alonso et al. (2023) [86]; Masset & Weisskopt (2024) [87] |
| Customer Feedback and Relationship | Importance of engaging with customers to inform innovation and foster loyalty | Customer satisfaction, retention rate, number of interactions | Mastroberardino et al. (2022) [88]; Cholez et al. (2023) [89]; |
The detailed presentation of the validated dimensions and indicators establishes both a theoretical and a practical foundation for subsequent analysis. This analysis focuses on the validation and prioritization of these elements through the use of the Fuzzy Delphi and Random Forest methods.
4.2 Data collection and analysis
In this stage, 44 managers/experts contributed to the validation and prioritization of indicators and dimensions, as outlined in Table 3.
| Variables | Categories | n | % |
|---|---|---|---|
| State | Rio Grande do Sul (RS) | 20 | 45.4 |
| Santa Catarina (SC) | 8 | 18.2 | |
| Paraná (PR) | 8 | 18.2 | |
| Sergipe (SE) | 8 | 18.2 | |
| Level of education | Graduate education | 3 | 6.8 |
| Higher education | 36 | 81.8 | |
| High school education | 5 | 11.4 | |
| Age range (years) | 18-35 | 12 | 27.3 |
| 36-55 | 28 | 63.6 | |
| > 55 | 4 | 9.1 | |
| Time in the role (years) | ≤ 5 | 24 | 54.5 |
| 6-10 | 11 | 25.0 | |
| > 10 | 9 | 20.5 |
4.3 Validation and ranking of the dimensions and indicators using the Fuzzy Delphi method and Random Forest Importance
Stage 1 commenced with the Fuzzy Delphi method to evaluate the relevance of each indicator for measuring innovation capacity in wineries. This assessment led to the exclusion of 38 indicators from various dimensions due to experts’ evaluations: 8 from R&D, 3 from SC), 4 from ETE, 5 from PE, 5 from P/SI, 6 from SEI, 3 from MAD, and 4 from CFR. Consequently, 50 indicators were retained for further analysis in Stage 2, focusing on this capacity.
Details on the elimination of indicators using the Fuzzy Delphi technique can be found in the supplementary material. The validated indicators were then ranked according to the dimensions they belong to, with importance weights assigned using the random forest importance method. The results are depicted in Table 4 and Figure 2.
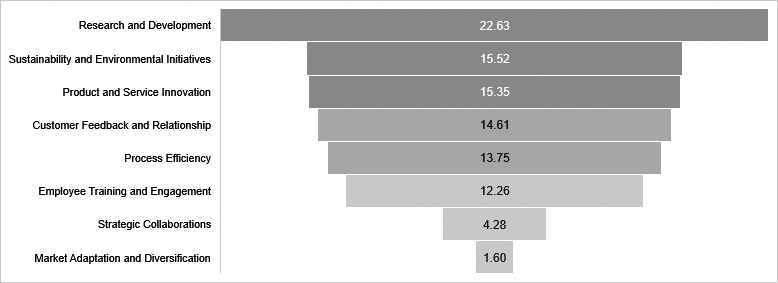
Analysis of Table 4, as depicted in Figure 2, reveals that the R&D dimension holds the highest significance (22.63%), followed by SEI (15.52%). Conversely, the dimensions deemed least important by experts are SC (4.28%) and MAD (1.60%). The overall mean accuracy of the model is 0.66, with a standard deviation (sd) of 0.173, indicating moderate predictive performance with reasonable consistency across folds in the cross-validation process. A comparative analysis of accuracy between Rio Grande do Sul and other Brazilian states (SC, PR, and SE) was conducted. The mean accuracy for RS was 0.67 (sd = 0.154), compared to 0.64 (sd = 0.172) for the other states.
A t-test revealed no significant differences (p > 0.05), indicating that both groups have statistically similar accuracies. This demonstrates equivalent sensitivity in evaluating the stability of the rankings, reinforcing the robustness and applicability of the proposed framework across different regional contexts. It is important to recognize the overlap between certain indicators across different dimensions. For example, Indicator 5 from the R&D dimension and Indicator 1 from the Product and Service Innovation dimension both assess aspects related to the development of new products or services.
Nonetheless, these overlaps were retained based on recommendations from the systematic literature review, ensuring that the dimensions and indicators comprehensively captured the multifaceted nature of innovation capacity. Notably, these indicators were confirmed during the fuzzy Delphi phase, further validating their relevance within the framework. It is also worth noting that within the R&D dimension, this indicator ranked in position 7 (8.48 degree of importance), while in the Product and Service Innovation dimension, it ranked in position 2 (15.09 degree of importance).
This distinction highlights the perceived greater significance of the indicator for Product and Service Innovation compared to R&D, an observation that should be taken into account when analyzing data and discussing the findings. Such nuances underscore the need for careful interpretation of overlapping indicators to better understand their relative importance within different dimensions and their contribution to the overall framework.
These nuances emphasize the need for a meticulous analysis of the data and findings. Figure 2 illustrates the performance evaluation of the dimensions in assessing innovation capacity, providing a visual representation of their respective roles within the framework.
The discussion of the results underscores the significance of each dimension in evaluating the innovation capacity of Brazilian wineries. Furthermore, R&D is identified as the most critical factor, accounting for 22.63% of the overall importance. R&D enhances innovation by developing new products, grape varieties, and advanced winemaking techniques. Indicators of R&D capacity include the number of projects, collaborations with research institutions, and budget allocations, which are central to improving product quality and production efficiency, crucial for maintaining competitiveness in the wine sector [73-75,90,91].
Sustainability and environmental initiatives represent 15.35% of the innovation capacity, highlighting the importance of eco-innovation in the industry. Wineries investing in sustainable practices, such as using renewable energy and reducing emissions, appeal to environmentally conscious consumers, thereby enhancing their market image and consumer loyalty. The significance of sustainability in influencing purchasing decisions has already been reported in the literature, making SEI a key factor in innovation [75,88,92].
Product and service innovation accounts for 15.52% importance, emphasizing the adoption of new technologies and procedures to enhance wine quality and production processes, meeting consumer demands and maintaining market differentiation [83,85,93]. As for CFR and PE, they collectively contribute 28.36% to the innovation capacity; CFR constituting 14.61%, highlights the role of strong customer relationships and feedback in guiding innovation and building brand loyalty, with digital tools and wine tourism as strategies for improving customer interactions [88,89,94,95]. PE, constituting 13.75% of the innovation capacity, focuses on operational efficiency through waste reduction and energy efficiency, contributing to sustainability and cost reduction [75,80,96,97].
While EEF, SC, and MAD are considered less critical, with a combined importance of 18.14%, they are essential for sustaining innovation. Hence, EEF boosts employee productivity and creativity [79,98,99], SC enables partnerships that provide new knowledge and markets, and MAD allows for the diversification of offerings and reduces market dependence, ensuring resilience [76,100]. Overall, this study highlights the interconnectedness of these dimensions in driving the innovation capacity of Brazilian wineries, providing a comprehensive framework for assessing and improving their competitive position in the market.
The integration of emerging technologies, such as artificial intelligence (AI), presents transformative opportunities to enhance wineries’ capacity for innovation. AI-driven tools can optimize viticulture processes by analyzing soil conditions, predicting climate impacts, and automating harvest schedules, thereby increasing efficiency and sustainability. For example, predictive analytics can identify optimal planting and harvesting times, reducing waste and improving yield quality. Additionally, AI-powered marketing tools enable wineries to adapt their product offerings based on consumer preferences, leveraging big data to refine strategies and expand market reach.
Beyond operational improvements, these technologies also promote innovation in product development and customer engagement. For instance, machine learning algorithms can analyze global wine trends to identify market gaps, inspiring the creation of unique blends that meet emerging consumer demands. Virtual and augmented reality technologies can enhance wine tourism experiences by providing interactive vineyard tours or immersive narratives about the winemaking process. By adopting these technologies, wineries not only increase their competitive edge but also strengthen their ability to innovate in a rapidly evolving industry landscape.
5.1 Limitations, potential biases in the methodology, and future directions
This study validates metrics for assessing the innovation capacity of Brazilian wineries, emphasizing their relevance for competitiveness and sustainability. Using the Fuzzy Delphi and Random Forest methods, 8 dimensions and 50 key indicators were prioritized, with R&D, Sustainability, and Product and Service Innovation identified as the most influential. Secondary dimensions, such as Customer Feedback and Process Efficiency, also play significant roles in enhancing operations and fostering customer-centric innovation.
While comprehensive, the study acknowledges certain limitations. First, the regional focus on Rio Grande do Sul may limit the direct applicability of the findings to other regions with differing characteristics. Second, challenges arose during data collection, particularly with managers whose primary focus lies on operational management, potentially constraining the depth of responses. Additionally, despite the robustness of the methodology, potential biases exist, notably the reliance on expert judgments, which may introduce variations influenced by individual experiences and perceptions.
Nevertheless, the findings present a versatile framework that can be adapted to other agricultural and beverage industries, particularly in emerging markets that face similar sustainability and competitiveness challenges. Aligned with global trends, such as sustainable practices, consumer-driven innovation, and digital transformation, this research offers valuable insights to advance innovation strategies across diverse contexts worldwide.
Future research should aim to address these limitations by expanding the scope to include other regions and incorporating a broader range of stakeholders to refine the understanding of innovation dynamics in the wine sector. Employing alternative methods, such as Fuzzy AHP, CRITIC, Shannon Entropy, or Fuzzy DEMATEL, could complement the analysis by assigning importance weights and establishing relationships among dimensions and indicators, thereby providing deeper insights into critical innovation factors.
Furthermore, advanced statistical techniques, such as Principal Component Analysis (PCA) or Factor Analysis, could be applied to validate the proposed dimensions and group indicators. However, these methods would require a larger sample size, enabling broader generalization and applicability of the results to other sectors. Expanding research in this direction would contribute significantly to the evolving discourse on innovation capacity and its role in organizational competitiveness and sustainability.
The research aimed to identify and validate metrics for assessing the innovation capacity of Brazilian wineries. It developed a comprehensive framework that includes multiple dimensions vital for the competitiveness and sustainability of the sector. Key dimensions identified were R&D, sustainability and environmental initiatives, and product and service innovation. These dimensions play a crucial role in enhancing product quality and operational efficiency.
Investment in R&D enables wineries to innovate in viticulture and winemaking, leading to new grape varieties, wine types, and more efficient production processes. Consequently, this supports product diversification and differentiation, establishing a unique market identity and boosting competitiveness. Sustainability initiatives, such as using renewable energy and recycling, appeal to environmentally conscious consumers, allowing wineries to enhance their public image and attract eco-friendly customers. Incorporating product and service innovation with sustainable practices helps wineries stay competitive and contribute to environmental protection.
Furthermore, our findings also highlight the significance of intermediate dimensions, such as customer feedback and relationships and process efficiency, in driving customer-centric innovation and maintaining operational efficiency. These dimensions facilitate continuous improvement through customer insights, which are essential for retaining loyalty, adapting to evolving consumer preferences, and ensuring cost-efficient production processes. Although receiving less emphasis, dimensions such as employee engagement and training, strategic collaborations, and market adaptation and diversification are equally critical for fostering a robust innovation ecosystem. Neglecting these aspects could compromise wineries’ resilience and adaptability to dynamic market conditions.
The methodologies employed in this study – specifically the Fuzzy Delphi and Random Forest Importance techniques – demonstrate significant relevance in assessing innovation capacity. By combining expert validation with machine learning-based prioritization, these methods provide a rigorous and adaptable framework for identifying and evaluating key innovation indicators. Their flexibility enables application across sectors and regions, offering valuable insights into strategic innovation practices beyond the wine industry.
This methodological approach ensures both rigor and practical applicability, contributing to the development of actionable metrics that guide decision-makers in enhancing organizational competitiveness and sustainability. Moreover, these techniques validate dimensions and indicators tailored to the wine industry, establishing a solid foundation for future research. Managers can leverage these insights to refine innovation strategies and enhance competitive performance, while policymakers can utilize the findings to inform innovation policies and foster sustainable development across industries.
Future research should incorporate longitudinal analyses to evaluate the long-term sustainability of innovations. Additionally, exploring the role of emerging technologies, such as artificial intelligence and the Internet of Things (IoT), in driving innovation within the wine sector is recommended. While this study focuses on Rio Grande do Sul, future investigations should extend to other Brazilian states and emerging viticulture regions worldwide to achieve a more comprehensive understanding of innovation challenges and opportunities in the global wine industry.
This study was supported by the National Council for Scientific and Technological Development (CNPq) and the Research Support Foundation of the State of Rio Grande do Sul (FAPERG). We would also like to thank Atlas Assessoria Linguística for language editing.
[1] D. Meissner, W. Polt, and N. S. Vonortas, “Towards a broad understanding of innovation and its importance for innovation policy,” Journal of Technology Transfer, vol. 42, no. 3, pp. 1184-1211, 2017, https://doi.org/10.1007/s10961-016-9485-4.
[2] A. E. Akgün, M. Cemberci, and S. Kircovali, “The relationship between extreme contexts, organizational change capacity, and firm product and process innovation,” Management Decision, vol. 61, no. 7, pp. 2140-2172, 2023, https://doi.org/10.1108/MD-06-2022-0856.
[3] E. M. Kamal, E. C. Lou, and A. M. Kamaruddeen, “Effects of innovation capability on radical and incremental innovations and business performance relationships,” Journal of Engineering and Technology Management, vol. 67, p. 101726, 2023, https://doi.org/10.1016/j.jengtecman.2022.101726.
[4] M. Z. Arshad, D. Arshad, H. Lamsali, A. S. I. Alshuaibi, M. S. I. Alshuaibi, G. Albashar, A. Shakoor, and L. F. Chuah, “Strategic resources alignment for sustainability: The impact of innovation capability and intellectual capital on SME’s performance. Moderating role of external environment,” Journal Cleaner Production, vol. 417, 2023, https://doi.org/10.1016/j.jclepro.2023.137884.
[5] S. Yeşil, and I. F. Doğan, “Exploring the relationship between social capital, innovation capability and innovation,” Innovation, vol. 21, no. 4, pp. 506-532, 2019, https://doi.org/10.1080/14479338.2019.1585187.
[6] A. Mendoza-Silva, “Innovation capability: a systematic literature review,” European Journal of Innovation Management, vol. 24, no. 3, pp. 707-734, 2021, https://doi.org/10.1108/EJIM-09-2019-0263.
[7] E. L. Daronco, D. S. Silva, M. K. Seibel, and M. N. Cortimiglia, “A new framework of firm-level innovation capability: A propensity–ability perspective,” European Management Journal, vol. 41, no. 2, pp. 236-250, 2023, https://doi.org/10.1016/j.emj.2022.02.002.
[8] Y. Zheng, J. Liu, and G. George, “The dynamic impact of innovative capability and inter-firm network on firm valuation: A longitudinal study of biotechnology start-ups,” Journal of Business Venturing, vol. 25, no. 6, pp. 593-609, 2010, https://doi.org/10.1016/j.jbusvent.2009.02.001.
[9] V. Boly, L. Morel, and M. Camargo, “Evaluating innovative processes in french firms: Methodological proposition for firm innovation capacity evaluation,” Research Policy, vol. 43, no. 3, pp. 608-622, 2014, https://doi.org/10.1016/j.respol.2013.09.005.
[10] C. F. Gohr, M. S. A. Tavares, and S. N. Morioka, “Evaluating the innovation capability of cluster-based firms: a graph-theoretic approach,” Journal of Business & Industrial Marketing, vol. 37, no. 7, pp. 1402-1421, 2022, https://doi.org/10.38191/iirr-jorr.24.012.
[11] B. M. Castela, F. A. Ferreira, J. J. Ferreira, and C. S. Marques, “Assessing the innovation capability of small-and medium-sized enterprises using a non-parametric and integrative approach,” Management Decision, vol. 56, no. 6, pp. 1365-1383, 2018, https://doi.org/10.1108/MD-02-2017-0156.
[12] B. Lianto, “Identifying key assessment factors for a company’s innovation capability based on intellectual capital: an application of the Fuzzy Delphi Method,” Sustainability, vol. 15, no. 7, pp. 6001, 2023, https://doi.org/10.3390/su15076001.
[13] H. M. J. C. B. Heenkenda, F. Xu, K. M. M. C. B. Kulathunga, and W. A. R. Senevirathne, “The role of innovation capability in enhancing sustainability in SMEs: An emerging economy perspective,” Sustainability, vol. 14, no. 17, p. 10832, 2022, https://doi.org/10.3390/su141710832.
[14] A. Amatucci, V. Ventura, and D. Frisio, “Performance and efficiency of national innovation systems: lessons from the wine industry,” Wine Economics and Policy, vol. 13, no. 1, pp. 63-80, 2024, https://doi.org/10.36253/wep-14637.
[15] D. Meissner, W. Polt, and N. S. Vonortas, “Towards a broad understanding of innovation and its importance for innovation policy,” Journal of Technology Transfer, vol. 42, no. 3, pp. 1184-1211, 2017, https://doi.org/10.1007/s10961-016-9485-4.
[16] V. A. Castro, M. T. D. D. A. Lourenção, J. D. M. E. Giraldi, and J. H. C. Oliveira, “Creation and implementation of collective brands: an analysis of the Brazilian wine sector challenges,” Journal of International Food & Agribusiness Marketing, vol. 35, no. 1, pp. 1-19, 2023, https://doi.org/10.1080/08974438.2021.1924334.
[17] J. Salvagni, C. H. Nodari, and V. Valduga, “Cooperation, innovation and tourism in the grape and wine region, Brazil,” Cuadernos de Desarrollo Rural, vol. 17, 2020, https://doi.org/10.11144/Javeriana.cdr17.citg.
[18] L. M. R. de Mello, and C. A. E. Machado, “Vitivinicultura brasileira: panorama 2021, EMBRAPA Uva e Vinho,” 2022. Available in: https://ainfo.cnptia.embrapa.br/digital/bitstream/doc/1149674/1/Com-Tec-226.pdf.
[19] T. Panizzon, G. Bircke Salton, V. E. Schneider and M. Poletto, “Identifying Hotspots and Most Relevant Flows for Red and White Wine Production in Brazil through Life Cycle Assessment: A Case Study,” Resources, vol. 13, no. 7, pp. 88, 2024, https://doi.org/10.3390/resources13070088.
[20] K. A. Ferreira, M. L. Toledo, and L. F. Rodrigues, “Postponement practices in the Brazilian Southeast wine sector,” The International Journal of Logistics Management, vol. 32, no. 1, pp. 6-23, 2020, https://doi.org/10.1108/IJLM-10-2019-0292.
[21] C. R. Gualberto, L. F. Rodrigues, and K. A. Ferreira, “Evaluation of postponement strategy in the production of table wine in Brazil: a discrete event simulation approach,” International Journal of Wine Business Research, vol. 33, no. 4, pp. 545-560, 2021, https://doi.org/10.1108/IJWBR-08-2020-0042.
[22] H. L. Lucena Filho, and C. H. B. Leite, “The WIETA Code of Conduct: Proposal for a Complementary Regulatory Model for Labor Relations in Brazilian Vitiviniculture,” Beijing Law Review, vol. 14, pp. 1394-1417, 2023, doi:10.4236/blr.2023.143076.
[23] M. Wagner, P. Stanbury, T. Dietrich, J. Döring, J. Ewert, C. Foerster, M. Freund, M. Friedel, C. Kamnann, M. Kock, T. Owtram, H. R. Schultz, K. Voss-Fels and J. Hanf, “Developing a sustainability vision for the global wine industry,” Sustainability, vol. 15, no. 13, pp. 10487, 2023, https://doi.org/10.3390/su151310487.
[24] E. Pomarici, A. Corsi, S. Mazzarino, and R. Sardone, “The Italian wine sector: Evolution, structure, competitiveness and future challenges of an enduring leader,” Italian Economic Journal, vol. 7, no. 2, pp. 259-295, 2021, https://doi.org/10.1007/s40797-021-00144-5.
[25] A. Dogru, and J. Peyrefitte, “Investigation of innovation in wine industry via meta-analysis,” Wine Business Journal, vol. 5, no. 1, pp. 44-76, 2022, https://doi.org/10.26813/001c.31627.
[26] L. Bitsch, B. Richter, and J. H. Hanf, “The competitive landscape in transitioning countries: the example of the Armenian wine industry,” Wine Econ Policy, vol. 11, no. 1, pp. 31-45, 2022, https://doi.org/10.36253/wep-10657.
[27] O. R. Kompaniets, “Sustainable competitive advantages for a nascent wine country: an example from southern Sweden,” Competitiveness Review: An International Business Journal, vol. 32, no. 3, pp.376-390, 2022, https://doi.org/10.1108/CR-04-2021-0063.
[28] K. R. Curtis, and S. L. Slocum, “Rural winery resiliency and sustainability through the COVID-19 pandemic,” Sustainability, vol. 13, no. 18, p. 10483, 2021, https://doi.org/10.3390/su131810483.
[29] C. P. Klinger, E. Silveira-Martins, G. J. D. Castro, and C. R. Rossetto, “Strategic positioning, differentiation and performance of Brazilian wineries,” International Journal of Wine Business Research, vol. 32, no. 2, pp. 219-246, 2020, https://doi.org/10.1108/IJWBR-11-2018-0068.
[30] Statista, “Wine – Worldwide,” 2024. Available in: https://www.statista.com/outlook/cmo/alcoholic-drinks/wine/worldwide.
[31] M. M. Amaral, L. C. Silva Flores, and S. J. Gadotti dos Anjos, “Analysing Coopetition in the Wine Business Ecosystem: A Literature Review,” Value Proposition to Tourism Coopetition: Cases and Tools, pp. 155-170, 2024, https://doi.org/10.1108/978-1-83797-827-420241011.
[32] J. A. Schumpeter, “The creative response in economic history,” The journal of economic history, vol. 7, no. 2, pp. 149-159, 1947, https://doi.org/10.1017/S0022050700054279.
[33] R. Garcia, and R. Calantone, “A critical look at technological innovation typology and innovativeness terminology: a literature review,” Journal of Product Innovation Management: An international publication of the product development & management association, vol. 19, no. 2, pp. 110-132, 2002, https://doi.org/10.1111/1540-5885.1920110.
[34] M. M. Crossan, and M. Apaydin, “A multi‐dimensional framework of organizational innovation: A systematic review of the literature,” Journal of management studies, vol. 47, no. 6, pp. 1154-1191. 2010, https://doi.org/10.1111/j.1467-6486.2009.00880.x.
[35] H. W. Chesbrough, “Open innovation: The new imperative for creating and profiting from technology”, Harvard Business School, 2003.
[36] L. Leydesdorff, and H. Etzkowitz, “Emergence of a triple helix of university – industry – government relations,” Science and Public Policy, vol. 23, no. 5, pp. 279-286, 1996, https://doi.org/10.1093/spp/23.5.279.
[37] B. Marco-Lajara, P. C. Zaragoza-Sáez, J. Martínez-Falcó, and E. Sánchez-García, “Does green intellectual capital affect green innovation performance? Evidence from the Spanish wine industry,” British Food Journal, vol. 25, no. 4, pp. 1469-1487, 2023, https://doi.org/10.1108/BFJ-03-2022-0298.
[38] R. Adner, “Ecosystem as structure: An actionable construct for strategy,” Journal of Management, vol. 43, no. 1, pp. 39-58, 2017, https://doi.org/10.1177/0149206316678451.
[39] B. Walrave, M. Talmar, K. S. Podoynitsyna, A. G. L. Romme, and G. P. J. Verbong, “A multi-level perspective on innovation ecosystems for path-breaking innovation,” Technological Forecasting and Social Change, vol. 136, pp. 103-113, 2018, https://doi.org/10.1016/j.techfore.2017.04.011.
[40] A. Menna, and P. R. Walsh, “Assessing environments of commercialization of innovation for SMEs in the global wine industry: A market dynamics approach,” Wine Economics and Policy, vol. 8, no. 2, pp.191-202, 2019, https://doi.org/10.14601/web-8211.
[41] D. Karagiannis, and T. Metaxas, “Sustainable wine tourism development: Case studies from the Greek region of Peloponnese,” Sustainability, vol. 12, no. 12, p. 5223, 2020, https://doi.org/10.3390/su12125223.
[42] M. Ingrassia, L. Altamore, S. Bacarella, P. Columba, and S. Chironi, “The wine influencers: Exploring a new communication model of open innovation for wine producers – A netnographic, factor and AGIL analysis,” Journal of Open Innovation: Technology, Market, and Complexity, vol. 6, no. 4, pp. 165, 2020, https://doi.org/10.3390/joitmc6040165.
[43] A. Rabadán, and R. Bernabéu, “An approach to eco-innovation in wine production from a consumer’s perspective,” Journal of Cleaner Production, vol. 310, pp. 127479, 2021, https://doi.org/10.1016/j.jclepro.2021.127479.
[44] I. A. Sorcaru, M. C. Muntean, L. D. Manea, and R. Nistor, “Entrepreneurs′ perceptions of innovation, wine tourism experience, and sustainable wine tourism development: the case of Romanian wineries,” International Entrepreneurship and Management Journal, vol. 20, no. 2, pp. 901-934, 2024, https://doi.org/10.1007/s11365-023-00918-6.
[45] E. Pomarici, and R. Vecchio, “Millennial generation attitudes to sustainable wine: An exploratory study on Italian consumers,” Journal of Cleaner Production, vol. 66, pp. 66:537-545, 2014, https://doi.org/10.1016/j.jclepro.2013.10.058.
[46] G. Di Vita, G. Califano, M. Raimondo, D. Spina, M. Hamam, M. D’Amico, and F. Caracciolo, “From Roots to Leaves: Understanding Consumer Acceptance in Implementing Climate‐Resilient Strategies in Viticulture,” Australian Journal of Grape and Wine Research, vol. 2024, no. 1, p. 8118128, 2024, https://doi.org/10.1155/2024/8118128.
[47] R. Sancho-Zamora, S. Gutiérrez-Broncano, F. Hernández-Perlines, and I. Peña-García, “A multidimensional study of absorptive capacity and innovation capacity and their impact on business performance,” Frontiers Psychology, vol. 12, pp. 751997, 2021, https://doi.org/10.3389/fpsyg.2021.751997.
[48] G. A. Bowen, “Document analysis as a qualitative research method,” Qualitative Research Journal, vol. 9, no. 2, pp. 27-40, 2009, https://doi.org/10.3316/QRJ0902027.
[49] B. F. Crabtree, and W. L. Miller. “Doing Qualitative Research,” SAGE Publications, 1999.
[50] J. W. Creswell, and V. L, “Plano Clark, Designing and Conducting Mixed Methods Research,” SAGE Publications, 2017.
[51] N. Dalkey, and O. Helmer, “An experimental application of the Delphi method to the use of experts,” Management Science, vol. 9, no. 3, pp. 458-467, 1963, https://doi.org/10.1287/mnsc.9.3.458.
[52] H. Guo, X. Wang, L. Wang, and D. Chen, “Delphi method for estimating membership function of uncertain set,” Journal of Uncertainty Analysis and Applications, vol. 4, no. 1, p. 3, 2016, https://doi.org/10.1186/s40467-016-0044-1.
[53] V. W. Mitchell, “The Delphi technique: An exposition and application,” Technology Analysis & Strategic Management, vol. 3, no. 4, pp. 333-358, 1991, https://doi.org/10.1080/09537329108524065.
[54] H. F. Sulaiman, Z. Z. Abidin, S. Subramaniam, and A. R. Omar, “Validation of occupational zoonotic disease questionnaire using Fuzzy Delphi method,” Journal of Agromedicine, vol. 25, no. 2, pp. 166-172, 2020, https://doi.org/10.1080/1059924X.2019.1666763.
[55] Y. K. Al-Rikabi, and G. A. Montazer, “Designing an e-learning readiness assessment model for Iraqi universities employing Fuzzy Delphi Method,” Education and Information Technologies, vol. 29, no. 2, pp. 2217-2257, 2024, https://doi.org/10.1007/s10639-023-11889-0.
[56] A. Ishikawa, M. Amagasa, T. Shiga, G. Tomizawa, R. Tatsuta, and H. Mieno, “The max-min Delphi method and Fuzzy Delphi method via fuzzy integration,” Fuzzy Sets and Systems, vol. 55, no. 3, pp. 241-253, 1993, https://doi.org/10.1016/0165-0114(93)90251-C.
[57] A. Padilla-Rivera, S. Russo-Garrido, and N. Merveille, “Addressing the social aspects of a circular economy: A systematic literature review,” Sustainability, vol. 12, no. 19, p. 7912, 2020, https://doi.org/10.3390/su12197912.
[58] Y. C. Kuo, and P. H. Chen, “Constructing performance appraisal indicators for mobility of the service industries using Fuzzy Delphi Method,” Expert Systems with Applications, vol. 35, no. 4, pp. 1930-1939, 2008, https://doi.org/10.1016/j.eswa.2007.08.068.
[59] P. K. Singh, and P. Sarkar, “A framework based on Fuzzy Delphi and DEMATEL for sustainable product development: A case of Indian automotive industry,” Journal of Cleaner Production, vol. 246, p. 118991, 2020, https://doi.org/10.1016/j.jclepro.2019.118991.
[60] N. Mabrouk, “Green supplier selection using fuzzy Delphi method for developing sustainable supply chain,” Decision Science Letters, vol. 10, no. 1, pp. 63-70, 2021, https://doi.org/10.5267/j.dsl.2020.10.003.
[61] Y. -L. Hsu, C. -H. Lee, and V. B. Kreng, “The application of Fuzzy Delphi Method and Fuzzy AHP in lubricant regenerative technology selection,” Expert Systems with Applications, vol. 37, pp. 419e425, 2010, https://doi.org/10.1016/j.eswa.2009.05.068.
[62] M. Bouzon, K. Govindan, and C. M. T. Rodriguez, “Reducing the extraction of minerals: Reverse logistics in the machinery manufacturing industry sector,” Journal Cleaner Production, vol. 112, pp. 3720-3733, 2016, https://doi.org/10.1016/j.resourpol.2015.02.001.
[63] Y. C. Kuo, and P. H. Chen, “Constructing performance appraisal indicators for mobility of the service industries using Fuzzy Delphi Method,” Expert Systems with Applications, vol. 35, no. 4, pp. 1930-1939, 2008, https://doi.org/10.1016/j.eswa.2007.08.068.
[64] Z. Ma, C. Shao, S. Ma, and Z. Ye, “Constructing road safety performance indicators using fuzzy Delphi method and grey Delphi method,” Expert Systems with Applications, vol. 38, no. 3, pp. 1509-1514, 2011., https://doi.org/10.1016/j.eswa.2010.07.062.
[65] M. L. Tseng, S. X. Li, C. W. R. Lin, and A. S. Chiu, “Validating green building social sustainability indicators in China using the fuzzy Delphi method,” Journal of Industrial and Production Engineering, vol. 40, no. 1, pp. 35-53, 2023, https://doi.org/10.1080/21681015.2022.2070934.
[66] L. Breiman, “Random Forests,” Machine Learning, vol. 45, no. 1, pp. 5-32, 2001, https://doi.org/10.1023/A:1010933404324.
[67] X. Gao, J. Wen, and C. Zhang, “An improved random forest algorithm for predicting employee turnover,” Mathematical Problems in Engineering, vol. 2019, pp. 1-12, 2019, https://doi.org/10.1155/2019/4140707.
[68] A. Mizumoto, “Calculating the relative importance of multiple regression predictor variables using dominance analysis and random forests,” Language Learning, vol. 73, no. 1, pp. 161-196, 2023, https://doi.org/10.1111/lang.12518.
[69] L. Yin, B. Li, P. Li, and R. Zhang, “Research on stock trend prediction method based on optimized random forest,” CAAI Transactions on Intelligence Technology, vol. 8, no. 1, pp. 274-284, 2023, https://doi.org/10.1049/cit2.12067.
[70] L. Li, “Prediction of coal prices based on random forest and lasso regression,” International Core Journal of Engineering, vol. 7, pp. 67-73, 2021, https://doi.org/10.6919/ICJE.202109_7(9).0011.
[71] A. Mizumoto, “Calculating the relative importance of multiple regression predictor variables using dominance analysis and random forests,” Language Learning, vol. 23, no. 1, pp. 161-196, 2023, https://doi.org/10.1111/lang.12518.
[72] B. F. Huang, and P. C. Boutros, “The parameter sensitivity of random forests,” BMC bioinformatics, vol. 17, pp. 1-13, 2016, https://doi.org/https://doi.org/10.1186/s12859-016-1228-x.
[73] A. Engelmann, “A performative perspective on sensing, seizing, and transforming in small-and medium-sized enterprises,” Entrepreneurship Regional Development, vol. 36, no. 5-6, pp. 632-658, 2024, https://doi.org/10.1080/08985626.2023.2262430.
[74] D. Doloreux and E. Lord-Tarte, “The organisation of innovation in the wine industry: open innovation, external sources of knowledge and proximity,” European Journal of Innovation Management, vol. 16, no. 2, pp. 171-189, 2013, https://doi.org/10.1108/14601061311324520.
[75] A. D. Alonso and A. Bressan, “Innovation in the context of small family businesses involved in a ‘niche’ market,” International Journal of Business Environment, vol. 6, no. 2, pp. 127-145, 2014, https://doi.org/10.1504/IJBE.2014.060235.
[76] V. Corvello, A. Cimino, and A. M. Felicetti, “Building start-up acceleration capability: A dynamic capability framework for collaboration with start-ups,” Journal of Open Innovation: Technology, Market, and Complexity, vol. 9, no. 3, p. 100104, 2023, https://doi.org/10.1016/j.joitmc.2023.100104.
[77] A. Presenza, T. Abbate, M. Meleddu, M., and F. Cesaroni, “Small-and medium-scale Italian winemaking companies facing the open innovation challenge,” International Small Business Journal, vol. 35, no. 3, pp. 327-348, 2017, https://doi.org/10.1177/0266242616664798.
[78] E. L. Deci, and R. M. Ryan, “The “What” and “Why” of Goal Pursuits: Human Needs and the Self-Determination of Behavior,” Psychological Inquiry, vol. 11, no. 4, pp. 227-268, 2000, https://doi.org/10.1207/S15327965PLI1104_01.
[79] R. Rampa, and M. Agogué, “Developing radical innovation capabilities: Exploring the effects of training employees for creativity and innovation,” Creativity and Innovation Management, vol. 30, no. 1, pp. 211-227, 2021, https://doi.org/10.1111/caim.12423.
[80] E. Sánchez-García, J. Martínez-Falcó, A. Alcon-Vila, and B. Marco-Lajara, “Developing green innovations in the wine industry: an applied analysis,” Foods, vol. 12, no. 6, pp. 1157, 2023, https://doi.org/10.3390/foods12061157.
[81] O. Awogbemi, D. V. V. Kallon, and K. A. Bello, “Resource recycling with the aim of achieving zero-waste manufacturing,” Sustainability, vol. 14, no. 8, pp. 4503, 2022, https://doi.org/10.3390/su14084503.
[82] C. Battistella, G. Ferraro, and E. Pessot, “Technology transfer services impacts on open innovation capabilities of SMEs,” Technological Forecasting and Social Change, vol. 196, pp. 122875, 2023, https://doi.org/10.1016/j.techfore.2023.122875.
[83] M. Castro, J. Baptista, C. Matos, A. Valente, and A. Briga-Sá, “Energy efficiency in winemaking industry: Challenges and opportunities,” Science of the Total Environment, 2024, https://doi.org/10.1016/j.scitotenv.2024.172383.
[84] K. Kelley, M. Todd, H. Hopfer, and M. Centinari, “Identifying wine consumers interested in environmentally sustainable production practices,” International Journal of Wine Business Research, vol. 34, no. 1, pp. 86-111, 2022, https://doi.org/10.1108/IJWBR-01-2021-0003.
[85] J. V. Montalvo-Falcón, E. Sánchez-García, B. Marco-Lajara, and J. Martínez-Falcó, “Sustainability research in the wine industry: A bibliometric approach,” Agronomy, vol. 13, no. 3, pp. 871, 2023, https://doi.org/10.3390/agronomy13030871.
[86] A. D. Alonso, A. Bressan, O. V. T. Kim, S. K. Kok, and E. Atay, “Integrating tradition and innovation within a wine tourism and hospitality experience,” International Journal of Tourism Research, vol. 25, no. 1, pp. 169-182, 2023, https://doi.org/10.1002/jtr.2561.
[87] P. Masset, and J. P. Weisskopf, “From risk to reward: the strategic advantages of diversifying grape varietals,” International Journal of Contemporary Hospitality Management, 2024, https://doi.org/10.1108/IJCHM-06-2023-0801.
[88] P. Mastroberardino, G. Calabrese, F. Cortese, and M. Petracca, “Social commerce in the wine sector: an exploratory research study of the Italian market,” Sustainability, vol. 14, no. 4, 2024, Doi: 0.3390/su14042024.
[89] C. Cholez, O. Pauly, M. Mahdad, S. Mehrabi, C. Giagnocavo, and J. Bijman, “Heterogeneity of inter-organizational collaborations in agrifood chain sustainability-oriented innovations,” Agricultural Systems, vol. 212, p. 103774, 2023, https://doi.org/10.1016/j.agsy.2023.103774.
[90] C. Bopp, R. Jara-Rojas, A. Engler, and M. Araya-Alman, “How are vineyards management strategies and climate-related conditions affecting economic performance? A case study of Chilean wine grape growers,” Wine Economics and Policy, vol. 11, no. 2, pp. 61-73, 2022, https://doi.org/10.36253/wep-12739.
[91] J. Martínez‐Falcó, B. Marco‐Lajara, P. Zaragoza‐Sáez, and E. Sánchez‐García, “The effect of organizational ambidexterity on sustainable performance: a structural equation analysis applied to the Spanish wine industry,” Agribusiness, 2023. https://doi.org/10.1002/agr.21846.
[92] N. D. Chauvin and E. C. Villanueva, “The anatomy of exporting wineries of Argentina,” International Journal of Wine Business Research, vol. 36, no. 3, pp. 329-350, 2024, https://doi.org/10.1108/IJWBR-08-2023-0049.
[93] C. Battistella, G. Ferraro, and E. Pessot, “Technology transfer services impacts on open innovation capabilities of SMEs,” Technological Forecasting and Social Change, vol. 196, pp. 122875, 2023, https://doi.org/10.1016/j.techfore.2023.122875.
[94] M. P. Prodan, A. Č. Tanković, and N. Ritossa, “Image, Satisfaction, and Continued Usage Intention in Wine Tourism through Digital Content Marketing,” Wine Economics and Policy, 2024, https://doi.org/10.36253/wep-15447.
[95] A. Dias, B. Sousa, A. Madeira, V. Santos, and P. Ramos, “Determinants of brand love in wine experiences,” Wine Economics and Policy, 2024, https://doi.org/10.36253/wep-13855.
[96] V. Lekics, “Sustainable Innovation in Wine Industry: A Systematic Review,” Regional and Business Studies, vol. 13, no. 1, pp. 55-73, 2021, https://doi.org/10.33568/rbs.2817.
[97] R. Padoni, M. Nanetti, A. Bondanese, and S. Rivaroli, “Innovative solutions for the wine sector: The role of startups,” Wine Economics and Policy, vol. 8, no. 2, pp. 165-170, 2019, https://doi.org/10.1016/j.wep.2019.08.001.
[98] C. Bopp, R. Jara-Rojas, A. Engler, and M. Araya-Alman, How are vineyards management strategies and climate-related conditions affecting economic performance? A case study of Chilean wine grape growers,” Wine Economics and Policy, vol. 11, no. 2, pp. 61-73, 2022, https://doi.org/10.36253/wep-12739.
[99] E. Barbierato, I. Bernetti, and I. Capecchi, “What went right and what went wrong in my cellar door visit? A worldwide analysis of TripAdvisor’s reviews of Wineries & Vineyards,” Wine Economics and Policy, vol. 11, no. 1, pp. 47-72, 2022, https://doi.org/10.36253/wep-10871.
[100] M. Kumar, M. Pullman, T. Bouzdine-Chameeva, and V. Sanchez Rodrigues, “The role of the hub-firm in developing innovation capabilities: considering the French wine industry cluster from a resource orchestration lens,” International Journal of Operations & Production Management, vol. 42, no. 2, pp. 526-551, 2022, https://doi.org/10.1108/IJOPM-08-2021-0519.
Supplementary material (Appendix)
| Dimension | Values | ||
|---|---|---|---|
| Indicator | Fuzzy Weight | Defuzzification | Decision |
| 1 - Research and Development Decision Value |
0.593 | ||
| 1 - Total number of employees dedicated exclusively to R&D | (0.10, 0.60, 0.90) | 0.534 | Excludes |
| 2 - Number of R&D projects executed internally | (0.30, 0,74, 0,90) | 0.648 | Includes |
| 3 - Percentage of R&D activities conducted through external sources in relation to total R&D activities | (0,10, 0,56, 0,90) | 0.520 | Excludes |
| 4 - Number of R&D projects conducted in collaboration with other companies | (0,10, 0,56, 0,90) | 0.553 | Excludes |
| 5 - Number of new products launched | (0,30, 0,56, 0,90) | 0.634 | Includes |
| 6 - Monetary value allocated to financing internal R&D activities during the year | (0,30, 0,56, 0,90) | 0.648 | Includes |
| 7 - Number of funding programs or grants obtained for R&D projects | (0,30, 0,56, 0,90) | 0.647 | Includes |
| 8 - Percentage that the R&D budget represents in relation to the company’s total budget | (0,30, 0,56, 0,90) | 0.644 | Includes |
| 9 - Number of prototypes developed for market testing | (0,10, 0,56, 0,90) | 0.546 | Excludes |
| 10 - Number of tests and experiments conducted to validate new ideas or prototypes | (0,30, 0,56, 0,90) | 0.639 | Includes |
| 11 - Number of market studies conducted to guide R&D activities | (0,10, 0,56, 0,90) | 0.572 | Excludes |
| 12 - Monthly frequency of systematic brainstorming sessions or other idea generation techniques | (0,10, 0,56, 0,90) | 0.523 | Excludes |
| 13 - Number of analyses conducted to understand the technological and competitive environment | (0,10, 0,56, 0,90) | 0.558 | Excludes |
| 14 - R&D project success rate, measured by the number of successfully completed projects in relation to the total number of projects initiated | (0,30, 0,56, 0,90) | 0.640 | Includes |
| 15 - Number of patents or intellectual property registrations applied for | (0,10, 0,56, 0,90) | 0.558 | Excludes |
| 16 - Number of low-cost innovations implemented (frugal innovations) | (0,30, 0,56, 0,90) | 0.626 | Includes |
| 2 - Strategic Collaborations Decision Value |
0.610 | ||
| 1 - Number of formal partnerships the winery maintains with other companies, research institutions, distributors, or local producers | (0.10, 0.75, 0.90) | 0.583 | Excludes |
| 2 - Indicators of innovations or process/product improvements introduced in the winery | (0.30, 0.75, 0.90) | 0.651 | Includes |
| 3 - Level of satisfaction of the winery with each of its strategic partners, usually through surveys or direct feedback | (0.10, 0.74, 0.90) | 0.580 | Excludes |
| 4 - Average duration in months that strategic partnerships are maintained | (0.10, 0.67, 0.90) | 0.556 | Excludes |
| 5 - Analysis of revenue growth directly attributable to established partnerships | (0.30, 0.69, 0.90) | 0.632 | Includes |
| 6 - Measure of the geographical reach of partnerships, including local, national, and international partners | (0.30, 0.77, 0.90) | 0.656 | Includes |
| 3 - Employee Training and Engagement Decision Value |
0.560 | ||
| 1 - Number of employees participating in training programs relative to the total number of employees | (0.10, 0.62, 0.90) | 0.539 | Excludes |
| 2 - Results of employee satisfaction surveys conducted periodically | (0.10, 0.58, 0.90) | 0.528 | Excludes |
| 3 - Percentage of employees who remain with the company for a specified period | (0.10, 0.68, 0.90) | 0.560 | Includes |
| 4 - Annual average hours of training per employee | (0.10, 0.59, 0.90) | 0.531 | Excludes |
| 5 - Proportion of employees who received a promotion in the last year | (0.10, 0.46, 0.90) | 0.485 | Excludes |
| 6 - Frequency of unexcused absences from work | (0.30, 0.73, 0.90) | 0.642 | Includes |
| 7 - Percentage of employees participating in engagement activities organized by the company | (0.30, 0.70, 0.90) | 0.635 | Includes |
| 8 - Frequency and results of performance evaluations that include feedback from peers and supervisors | (0.10, 0.68, 0.90) | 0.560 | Includes |
| 5 - Process Efficiency Decision Value |
0.640 | ||
| 1 - Average production cycle time | (0.3, 0.73, 0.90) | 0.645 | Includes |
| 2 - Production cost per unit | (0.3, 0.81, 0.90) | 0.670 | Includes |
| 3 - Rate of production capacity utilization | (0.3, 0.77, 0.90) | 0.657 | Includes |
| 4 - Number of defects or reworks per batch | (0.3, 0.75, 0.90) | 0.650 | Includes |
| 5 - Energy efficiency in production | (0.1, 0.73, 0.90) | 0.578 | Excludes |
| 6 - Raw material waste rate | (0.3, 0.78, 0.90) | 0.661 | Includes |
| 7 - Percentage of automated processes | (0.1, 0.65, 0.90) | 0.551 | Excludes |
| 8 - Response time to failures or breakdowns | (0.3, 0.74, 0.90) | 0.648 | Includes |
| 9 - Maintenance cost as a percentage of production cost | (0.3, 0.77, 0.90) | 0.657 | Includes |
| 10 - Employee satisfaction index with operational processes | (0.3, 0.72, 0.90) | 0.640 | Includes |
| 11 - Number of process improvements implemented per year | (0.3, 0.70, 0.90) | 0.632 | Excludes |
| 12 - On-time delivery rate | (0.5, 0.83, 0.90) | 0.742 | Includes |
| 13 - Number of customer complaints related to product quality | (0.5, 0.82, 0.90) | 0.739 | Includes |
| 14 - Percentage of production orders completed without incidents | (0.3, 0.76, 0.90) | 0.653 | Includes |
| 15 - Average time for production line changeover or equipment adjustment | (0.1, 0.66, 0.90) | 0.553 | Excludes |
| 16 - Efficiency in the use of water and other critical inputs | (0.1, 0.71, 0.90) | 0.571 | Excludes |
| 6 - Product/Service Innovation Decision Value |
0.633 | ||
| 1 - Number of new services launched | (0.30, 0.73, 0.90) | 0.645 | Includes |
| 2 - Number of significantly improved products or services | (0.30, 0.75, 0.90) | 0.651 | Includes |
| 3 - Revenue generated from new products or services | (0.30, 0.77, 0.90) | 0.657 | Includes |
| 4 - Percentage of revenue from products or services launched in the last 3 years | (0.10, 0.70, 0.90) | 0.568 | Excludes |
| 5 - Number of disruptive innovations introduced to the market | (0.30, 0.67, 0.90) | 0.624 | Excludes |
| 6 - Number of patents or intellectual property registrations obtained | (0.10, 0.64, 0.90) | 0.548 | Excludes |
| 7 - Cost of developing new products or services | (0.30, 0.75, 0.90) | 0.650 | Includes |
| 8 - Development time from conception to launch | (0.30, 0.71, 0.90) | 0.636 | Includes |
| 9 - Success rate of new products or services based on market acceptance | (0.30, 0.77, 0.90) | 0.656 | Includes |
| 10 - Number of strategic partnerships focused on product/service innovation | (0.30, 0.69, 0.90) | 0.628 | Excludes |
| 11 - Total investment in research and development activities | (0.30, 0.72, 0.90) | 0.641 | Includes |
| 12 - Number of ongoing innovation projects | (0.30, 0.71, 0.90) | 0.636 | Includes |
| 13 - Customer feedback on innovations (satisfaction and acceptance) | (0.30, 0.79, 0.90) | 0.664 | Includes |
| 14 - Adoption rate of emerging technologies in production processes | (0.10, 0.64, 0.90) | 0.546 | Excludes |
| 15 - Number of products or services that meet new consumer needs | (0.50, 0.78, 0.90) | 0.728 | Includes |
| 16 - Environmental impact of new products or services (sustainability) | (0.30, 0.74, 0.90) | 0.648 | Includes |
| 7 - Sustainability and Environmental Initiatives Decision Value |
0.567 | ||
| 1 - Total energy consumption from renewable sources | (0.10, 0.72, 0.90) | 0.572 | Includes |
| 2 - Amount of greenhouse gas (GHG) emissions reduction compared to previous periods | (0.10, 0.68, 0.90) | 0.559 | Excludes |
| 3 - Total water consumption per unit of product produced | (0.30, 0.76, 0.90) | 0.653 | Includes |
| 4 - Percentage of total waste generated that is recycled or reused | (0.10, 0.74, 0.90) | 0.578 | Includes |
| 5 - Total number of ecological or sustainability certifications acquired, such as ISO 14001, LEED certification (Leadership in Energy and Environmental Design), etc. | (0.10, 0.64, 0.90) | 0.547 | Excludes |
| 6 - Value invested in technologies or practices that promote sustainability | (0.10, 0.68, 0.90) | 0.561 | Excludes |
| 7 - Total initiatives conducted in partnership with environmental NGOs or other entities for environmental conservation | (0.10, 0.63, 0.90) | 0.542 | Excludes |
| 8 - Life cycle assessment of new products to determine their environmental impact | (0.10, 0.68, 0.90) | 0.559 | Excludes |
| 9 - Number of training hours provided to employees on sustainable practices | (0.10, 0.59, 0.90) | 0.530 | Excludes |
| 8 - Market Adaptation and Diversification Decision Value |
0.640 | ||
| 1 - Number of new geographic markets or consumer segments reached | (0.30, 0.75, 0.90) | 0.648 | Includes |
| 2 - Proportion of total revenue coming from recently launched products or new markets | (0.30, 0.70, 0.90) | 0.633 | Excludes |
| 3 - Total number of different product types or product lines offered by the winery | (0.30, 0.76, 0.90) | 0.652 | Includes |
| 4 - Average time between identifying a new market trend and introducing a corresponding product or service | (0.30, 0.70, 0.90) | 0.634 | Excludes |
| 5 - Amount invested in research activities to better understand consumer needs and preferences | (0.30, 0.72, 0.90) | 0.641 | Includes |
| 6 - Proportion of revenue from sales outside the domestic market | (0.30, 0.69, 0.90) | 0.630 | Excludes |
| 9 - Customer Feedback and Relationship Decision Value |
0.656 | ||
| 1 - Average customer satisfaction score received through regular surveys | (0.30, 0.76, 0.90) | 0.654 | Excludes |
| 2 - Percentage of customer feedback responded to within a specified timeframe | (0.30, 0.77, 0.90) | 0.655 | Excludes |
| 3 - Monthly number of customer interactions per period | (0.30, 0.76, 0.90) | 0.652 | Excludes |
| 4 - Percentage of customers who continue doing business with the winery year after year | (0.50, 0.83, 0.90) | 0.744 | Includes |
| 5 - Total number of complaints received within a specific period | (0.30, 0.77, 0.90) | 0.658 | Includes |
| 6 - Percentage of complaints resolved during the first interaction with the customer | (0.30, 0.79, 0.90) | 0.664 | Includes |
| 7 - Measure reflecting the likelihood of customers recommending the winery to others | (0.50, 0.86, 0.90) | 0.753 | Includes |
| 8 - Count of loyalty programs offered and the number of active customers in those programs | (0.10, 0.69, 0.90) | 0.562 | Excludes |
| 9 - Percentage of potential customers (leads) that become buyers | (0.30, 0.77, 0.90) | 0.658 | Includes |
| 10 - Total number of customer interactions on social media platforms, including comments, likes, and shares | (0.10, 0.68, 0.90) | 0.560 | Includes |
| 11 - Average time the company takes to respond to customer requests, measured in hours or days | (0.30, 0.77, 0.90) | 0.658 | Includes |
Glossary of technical terms used in data analysis
Fuzzy Delphi Method
A refinement of the traditional Delphi method that incorporates fuzzy logic to handle uncertainties in expert opinions. It is widely used for achieving consensus on complex issues by analyzing linguistic variables through triangular fuzzy numbers.
Triangular Fuzzy Numbers
A mathematical representation of uncertainty in the Fuzzy Delphi method, defined by three points: lower limit, most probable value, and upper limit.
Random Forest Importance (RFI)
A machine learning technique that uses multiple decision trees to rank features (dimensions or indicators) based on their importance in predicting outcomes, calculated through measures such as impurity reduction.
Bootstrapping
A statistical technique used in the Random Forest method, involving repeated sampling with replacement to train multiple decision trees, enhancing robustness and accuracy.
Gini Impurity
A metric used in decision trees to measure the impurity or diversity of a node, indicating how well the node splits the data into distinct classes.
Defuzzification
The process of converting fuzzy numbers into crisp values to make them interpretable for decision-making or ranking purposes.
Importance Weights
Quantitative measures assigned to dimensions or indicators based on their relative significance in explaining or predicting outcomes, derived from the Random Forest model.
Cross-Validation
A statistical method for evaluating a model’s performance by partitioning the data into multiple subsets (folds). The model is trained on k-1 subsets and tested on the remaining subset, rotating this process through all folds. The results are averaged to estimate the model’s generalizability and stability.