Debating wine health-warning labels using Q methodology
1 Dipartimento di Scienze Agrarie, Alimentari e Ambientali (D3A), Università Politecnica delle Marche, Via Brecce Bianche, 60131 Ancona, Italy
2 Dipartimento di Scienze e Ingegneria della Materia, dell’Ambiente ed Urbanistica (SIMAU), Università Politecnica delle Marche, Via Brecce Bianche, 60131 Ancona, Italy
*Corresponding author. Email: mandolesi@agrecon.univpm.it
Abstract. In Europe, alcohol-related diseases have an increasingly high impact on healthcare costs every year. Hence, rising consumer consciousness regarding the risks and harms of drinking alcohol is a primary goal of the EU Commission. Recently, the Commission has been discussing the mandatory adoption of health-warning labels (HWLs) on all alcoholic beverages, including wine. This study investigated expert and non-expert perceptions of adopting health-warning labels on wine bottles. The research used Q methodology, a mixed-method approach to explore subjective viewpoints regarding adopting health-warning labels for the wine sector. Respondents were evenly distributed among wine experts and consumers. The results provided four different views based on participants’ perceptions of HWLs. Factor 1 (the “Nationalism” view) strongly opposes the proposal, which is considered extremely dangerous for the entire wine market. Factor 2 (the “Market-oriented” view) believes that health warnings will increase transparency in the market and help consumers make informed choices, thereby respecting consumer autonomy. Factor 3 (the “Health-first” view) strongly believes that informing consumers through health labels on all alcoholic beverages is necessary to protect public health. Lastly, Factor 4 (the “Keep Us Alive” view) underestimates warning labels’ effectiveness in promoting the right behaviours. The findings highlight different “sides” of this debating topic and provide valuable insight into how policymakers can investigate new strategies, always considering and respecting consumer choice.
Keywords: health-warning labels, labelling, wine, attitudes, Q methodology.
Index
2.5 Q sorting and post-sort interviews
3.1 Factor 1: The “Nationalism” view
3.2 Factor 2: The “Market-oriented” view
3.3 Factor 3: The “Health-first” view
3.4 Factor 4: The “Keep us alive” view
CRediT authorship contribution statement
The European Union is characterised by the most significant production, consumption and export of wine worldwide, with thousands of manufacturing companies [1]. Italy is one of Europe’s top wine producers, focusing on quality-labelled food products, including PDO (Protected Designation of Origin) and PGI (Protected Geographical Indication). Regarding consumption, the EU area accounted for 48% of world wine consumption, and Italy is the second largest consumer of wine after France: 10.3% and 10.7% in 2021 respectively [1]. Wine consumption has been experiencing a continuous decrease since 2008 [1–3]. Although more conscious consumers have spread the consumption of organic and more natural wine and those with lower alcoholic content, wine consumption is expected to fall by 2031 [1,4,5]. Furthermore, the high rates of alcohol consumption have raised considerable attention [6,7]. Indeed, the harmful use of alcoholic beverages is one of the main causes of mortality as well as many negative short-term effects (i.e., lack of coordination and accidents) and long-term effects (i.e., non-communicable diseases including cancer, brain damage, heart and liver diseases) [5,7,8]. According to recent estimates by the World Health Organisation [6], every year, around 1.7 million people worldwide die due to alcohol-related causes. However, many drinkers worldwide have scarce knowledge of the related risks and potential harm [8,9]. Among the most successful policy actions to reduce the harmful consumption of alcohol, initiatives that enhance the consumer perception of risk, such as the use of health-warning labels (HWLs), are considered by some scholars as highly beneficial [5,8,10–12].
Currently, wine labelling rules are subjected to CMO Regulation - [13] - which was already amended in 2018 by the CAP Amending Regulation - [14]. European Commission aims to improve wine labels, including more nutrition information and health warnings. In the EU, the adoption of HWLs on alcohol products is still voluntary, and some member states have already adopted optional measures imposing the communication of potential hazards of alcohol consumption in particular conditions (e.g., “alcohol consumption during pregnancy”; “drinking alcohol and driving”) [8]. Ireland first posed the issue regarding the mandatory adoption of detailed health-warning labels on all alcoholic beverages and, in 2023, introduced new regulations with a specific law [15]. The Irish case generated controversial debates, which have also been fuelled by the European Commission’s no objection [1]. Most leading wine-producing countries, such as Italy, France, and Spain, strongly oppose this new Irish rule, as they believe that wine must be considered an essential part of their producing national tradition and cultural heritage [16]. In Italy, wine consumption culture has a deep impact on individual’s perspective, as it influences various aspect of every day’s life. These goes from health perspectives to social identity. In Italy, as in other European countries, the inclusion of wine within the context of the Mediterranean diet principles [5,17] reinforces the idea that moderate consumption may be associated with certain health benefits. From a social identity perspective, wine, more than other traditional and regional products, represent a symbol of cultural heritage [18]. Furthermore, wine is an essential part of the culinary culture of many Italian regions, offering numerous opportunities for wine tourism activities [18].
In this framework, this study aims to provide insights into the subjective views of consumers and wine experts regarding the potential implementation of health warnings on wine labels. To discover these viewpoints, we used Q methodology, which offers a valuable approach for identifying and comparing the diversity of participants’ views [19,20]. Since the introduction of the method, Q methodology has primarily been used in psychology [20]. In the last decades, Q methodology has gained considerable attention, and its use has rapidly increased in different research topics regarding consumer behaviour, food acceptance, agriculture, environmental science, and others [21–29]. More recently, Q methodology was also applied in the field of the wine business to support the development of sectorial policies [30–32]. The structure of the article is as follows. The following section describes Q methodology, presenting the main steps of this approach and how data were collected and analysed. The “Results” section then shows the four perspectives, describing the similarities and differences. In the next section, the results are discussed in relation to previous research studies. The conclusions focus on the advantages and shortcomings of Q methodology, highlighting the relevance of the finding for the wine sector as well as the limitations of the current study.
Q methodology, first introduced in 1935 by the physicist and psychologist William Stephenson [19,20,33], is a technique designed to explore people’s subjectivity and attitudes. More specifically, the Q method allows us to find groups of people with similar perspectives and attitudes towards a given topic [10,20,34]. The method is advantageous for gaining a well-defined snapshot of a complex and novel debating matter. In a Q study, participants sort a sample of statements with each other and on their viewpoint along a scale. This ranking process provides subjective beliefs (called Q sorts) representing participants’ attitudes. In Brown’s words (1980), a Q sort is “such a picture, being an individual’s conception of the way things stand” [20]. Then, Q sorts are correlated and factor-analysed to identify the dominant and shared “patterns of belief” [20,35–37]. In other words, common views are defined and statistically modelled as factors, which in a Q study provide clusters of persons who ranked the statements similarly. The emerging factors or perspectives are “spontaneous” and obtained from “a set of acts” and not from a single response [36,38]. Also, Q method allows for discovering critical areas of divergence and consensus among participants, highlighting the different positions [39,40].
Q methodology can be considered a mixed method and combines the advantages of both qualitative and quantitative research approaches [10,41]. First, it offers valid results [10,42], enabling the exploration of the main perspectives more in depth than traditional surveys [43]. Second, a Q study provides more structure than qualitative methods traditionally employed in social science (i.e., interviews or focus groups) thanks to “numerical results” [20,44]. Third, Q methodology takes distances from the conventional rule of numbers, where the validation of results is fortified by the dimension of the participants’ group [45]. For this reason, because of its intensive orientation Q studies usually require a small participant sample (P sample), which is built to encompass and run out the full range of attitudes towards the topic in the study [20,41,42]. In a Q study, a subset of statements defining the “universe of communicability” (called concourse) is higher in number than the non-random sample of participants (P sample) [20]. Contrary to classical factor analysis, here, the “variables” are people performing the Q sorts, not the statements [41]. Stephenson first clarified that Q methodology was not developed to substitute R methodology, which concerns the relationship across objective variables using many respondents to make inferences [33,37,45]. Since the aim of the Q analysis is to reveal “an in-depth portrait of the typologies of perspectives that prevail in a given situation” [37], the statistical generalizability of Q results to a larger population of individuals is not of interest [33,46]. Indeed, factors are themselves generalizations of views which can be expected to exist outside the study’s participants. Fourth, the strength of Q method passes through the well-known mathematical method of factor analysis, which is instead applied to the individuals’ viewpoints expressed with the Q sorts [35,42]. This “inverted” factor analysis simply allows to reveal the structure of factors using the correlation among the participants’ views and not, like in R methodology, among the traits [20,37]. Q factor analysis allows to synthesize straightforwardly and flexibly the divergent opinions of participants into a smaller subset of perspectives (i.e., the “factors”) [20,45]. Finally, Q methodology works well when it is necessary to explore novel topics allowing a public debate “to take place regarding values” and without imposing “meanings a priori” [24,37,41]. Typically, a Q study comprises of five steps [42]: 1) the collection of the concourse; 2) the selection of the Q sample; 3) the definition of the P sample; 4) Q sorting task; and, 5) factor analysis and interpretation of results.
The set of statements to be ranked is obtained theoretically from a larger group, namely the “concourse”, or “population of statements” [20]. For Stephenson [47], the concourse “refers to conversational and not merely informational possibilities, and is arrived at empirically for every concept, every declarative statement, every wish, every object in nature when viewed subjectively”. The concourse can include verbal statements gathered from interviews, focus groups, participant observation etc. The selection of the population of statements is guided by the research question. In this case, the research question relies with the public debate regarding the adoption of health-warning labelling, and it can be defined as follows: “What do diverse consumers and wine experts view the adoption of health-warning labels for the wine sector to promote healthier behaviours?”. Consequently, the main goal was to include a wide a range of viewpoints or opinions concerning the topic under investigation. The concourse was obtained by searching inside websites, social networks, and interviews ready-made statements using specific keywords [42]. Another important aspect is that the statements should be self-referent (e.g., “for me....”, “I believe…”) [20]. The use of statements such as “For me…” or “In my opinion…” are essential for stimulating the self-involvement of the participants’ ranking process (Q sorting). Finally, over 240 subjective and contrasting written statements composed the concourse.
Q analysis must be considered de facto a behavioural experiment, in which the subject is instructed to operate with the statements under “conditions of instruction” guided by the theory and the specific aims of the study [20]. In most studies, like this one, the instruction “rank the statements to represent your own point of view” is all that is called for to let operantly emerge the principles governing the subject’s behaviour.
A subset of statements drawn from the concourse forms the Q sample, built to provide a “miniature” of the original concourse to guarantee enough variety and representativeness [48]. Regarding the Q sample dimension, the number of statements may vary between 30 to 60 [20,49,50]. Typically, the statements sampling is tied to the Fisher’s experimental design [20,51]. This structured approach provides a theoretical way for selecting the statements. In this study, the structured matrix used for the selection was obtained by adapting one proposed by a previous study [52]. In their four-by-four original matrix [52] included four categories relating to different discourse elements and four types of claims extracted from [53]. For this study, we adopted four levels in one variable (the Toulmin’s claims: definitive, designative, evaluative and advocative) cross-classified with two levels in a second variable (Attitude: positive and negative) in a 4´x2 factorial arrangement. The 8-cell matrix is reported in Table 1. All statements were first classified in the matrix, and after eliminating the redundant and unclear statements, five different statements were selected for each cell. The final balanced Q sample included 40 self-referent statements for administering the sorting task. Due to the diverse audience, the Q sample was also pre-tested to revise the clarity of each statement.
| Toulmin’s types of claims | |||||
|---|---|---|---|---|---|
| Definitive “Concerns the meaning of terms” |
Designative “Issues of fact” |
Evaluative “Expressions of the worth of something” |
Advocative “Something that should or should not exist” |
||
| Attitude | Positive | 5 | 5 | 5 | 5 |
| Negative | 5 | 5 | 5 | 5 | |
Q methodology works with few participants: “enough subjects to establish the existence of a factor for purpose of comparing one factor with another. What proportion of the population belongs in one factor rather than another is a wholly different matter and one about which Q technique as such is not concerned” [20]. In traditional by-item factor analysis (R technique), [54] suggests a minimum of ratio of two participants per variable. In Q technique, the ratio should be reversed. Because the aim of the methodology is to prove the existence of relevant and natural discourses, adding more participants to the study does not add any information “unless the extra individuals are truly different” [52]. Relevant studies were carried out with few participants, or even with a single participant to whom multiple Q sorts were administered with different condition of instruction – the so-called “intensive” studies [24,25,42,55]. In any case, the main criterion for sampling participants was seeking the maximum variation and emphasis on higher quality [25]. Consequently, the number of participants is less important than the representativeness of their selection [20]. Following the methodology, participants were strategically – not randomly – sampled including those with pivotal view regarding the subject [41]. More specifically, to provide the broadest diversity of opinions, both wine consumers and experts, who are more familiar and involved with the topic, formed the participant sample or P set [22]. We included at least six participants per group [56]. In more detail, the P set included twelve consumers and seven experts. Among the experts were three resellers/distributors, two sommeliers, one agronomist, and one enologist. Contacted wine growers preferred to refer to their own consultant, either enologist or agronomist. Participants were contacted via mail and phone to schedule a convenient time and location. The P set included 19 participants, nine males and ten females with different ages (range 22-66 years), education and occupation.
2.5 Q sorting and post-sort interviews
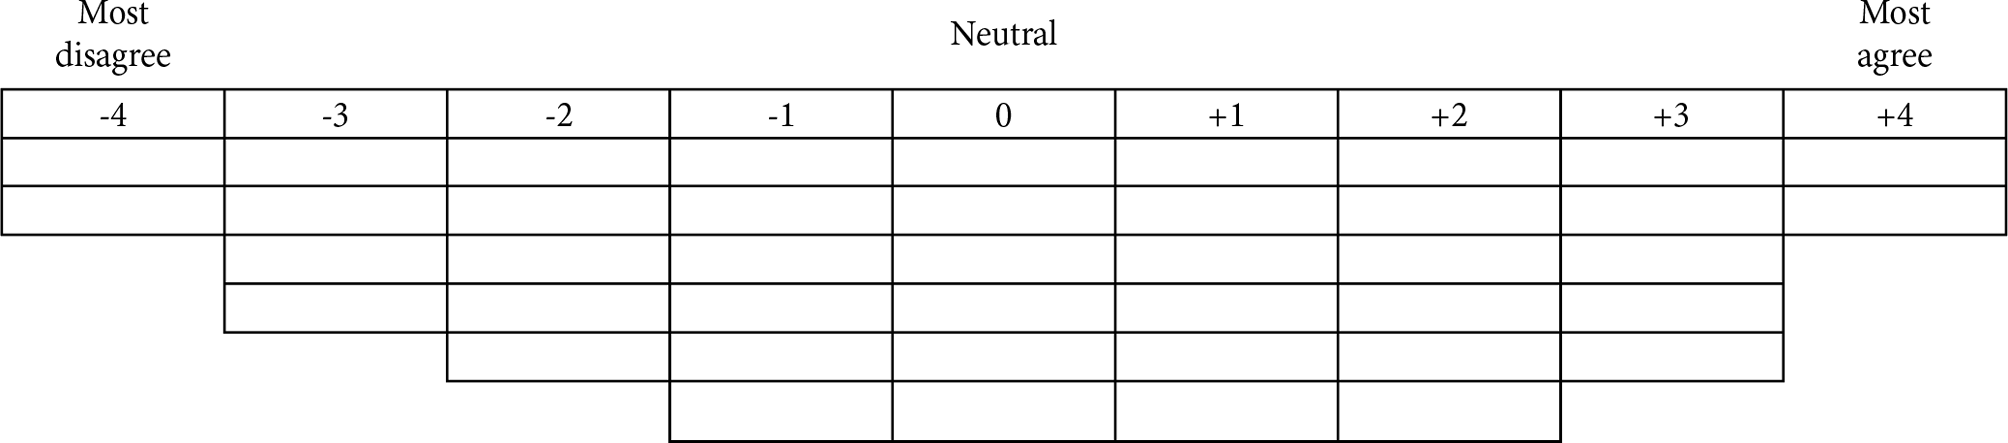
The forty statements were provided to participants as printed cards randomly numbered. Participants were asked to rank-order the statements along a continuum from “most agree” (“+4”) to “most disagree” (“-4”) into a forced quasi-normal distribution (Figure 1). The sorting distribution is generally symmetrical about the middle (the “0” represents the neutral area). It is important to note that no effect on the results is produced by the rating and the shape of the distribution [42]. By ranking all statements, participants “operantly” impose their individuality or view on the distribution, producing the self-referent Q sorts [38]. Before starting the Q sorting, each participant was instructed to read all the statements and divide them into three piles: “agree”, “disagree” and “neutral”. Then, the participant was asked to start rating the “agree” pile, moving from the right to the left. Due to the symmetrical distribution, the same procedure is followed for the “disagree” pile, in this case, moving from the left to the right. Finally, the remaining neutral statements are placed into the distribution. Then, open-ended interviews (usually on the highest and lowest ranked statements) were gathered after the Q sorting to facilitate the interpretation of results.
The analysis was conducted using the KADE software [57]. All Q sorts are cross-correlated and factor analysed. The calculation of the correlation matrix is necessary to prepare the data for revealing the factor structure [20,48]. Then, the correlation matrix is used as raw material for the factor analysis. Factor analysis in a Q-study is used to reduce the variety of Q sorts into a finite set of “discourses” or “factors”. The initial n x n correlation matrix is reduced to n x m matrix, where n is the number of Q sorts and m is the number of factors, with m<n [20]. The factor analysis allows to group Q sorts highly correlated with one other into one “family” and reports how many different families exist [20,45,47]. Here, seven factors were initially extracted automatically using the centroid method [20,35] Table 2. The first output of the factor analysis are the factor loadings which are correlation coefficient indicating the extent to which each Q sort is associated with each factor [20,42]. At this point, it is important to define how many factors should be retained for the interpretation. There is not a unique way to establish how many social factors to extract. For this study, three criteria were followed. First, one method is to accept those factors with at least two significant factor loadings [20]. The factor loading of one Q sort can be considered statistically significant or “defining” for a given factor if it exceeds ±2.58 x (standard error) (with p<0.01); where the standard error is 1/√(n of staements)) [20,55]. For this study, a defining Q sort has a loading which exceeds ± 0.4079. Second, the Scree-plot analysis was also followed. According to this method, eigenvalues for each factor, calculated by summing the squared loadings for each factor, are plotted on a line graph and the number of factors to extract are those where the line changes slope [49]. Third, the Kaiser-Guttman criterion guides the selection of those factors with eigenvalue over 1 [20]. In Table 2, the eigenvalues for all unrotated factors are reported. The results of these criteria and theoretical considerations were considered to select four factors [41]. Once extracted, the factors are usually subjected to rotations. The four factors were rotated using a combination of varimax and the judgemental rotation to fit more in focus the connection between similar Q sorts. The solution was also motivated by low correlations between couples of factors, indicating the minor similarities between each perspective. The study variance and the factor score correlations for the four-factor solution are reported in Table 3. Table 4 shows all factor loadings with the ‘defining’ Q sorts [20].
| F1 | F2 | F3 | F4 | |
|---|---|---|---|---|
| % of explained variance | 26 | 11 | 6 | 9 |
| Cumulative % of explained variance | 26 | 37 | 43 | 52 |
| Factor score correlations | ||||
| F1 | 1 | -0,1619 | -0,08 | 0,1189 |
| F2 | 1 | -0,2981 | 0,1323 | |
| F3 | 1 | 0,0758 | ||
| F4 | 1 |
| Q sort | Type | F1 | F2 | F3 | F4 |
|---|---|---|---|---|---|
| 1 | Consumer | 0,1149 | -0,0066 | 0,0397 | 0,8224 |
| 2 | Expert | -0,7443 | 0,2126 | 0,0836 | 0,269 |
| 3 | Expert | 0,7547 | 0,0468 | -0,3076 | -0,0232 |
| 4 | Consumer | 0,058 | 0,5165 | 0,0197 | -0,1122 |
| 5 | Consumer | 0,7239 | 0,0743 | -0,0849 | 0,0767 |
| 6 | Consumer | -0,4467 | 0,4889 | -0,1602 | 0,0645 |
| 7 | Expert | 0,1737 | -0,0472 | -0,0145 | 0,7587 |
| 8 | Consumer | 0,5092 | 0,3606 | -0,2473 | 0,1633 |
| 9 | Expert | 0,7571 | -0,2384 | 0,0027 | -0,0773 |
| 10 | Expert | 0,0162 | -0,3653 | 0,1615 | 0,1693 |
| 11 | Consumer | 0,8326 | -0,0183 | 0,3138 | -0,1181 |
| 12 | Consumer | 0,2544 | 0,5378 | 0,1113 | -0,0345 |
| 13 | Consumer | 0,7332 | 0,2968 | -0,0126 | 0,0678 |
| 14 | Expert | 0,7522 | 0,2348 | -0,1589 | -0,0387 |
| 15 | Consumer | -0,2831 | 0,7195 | -0,0147 | 0,3254 |
| 16 | Consumer | 0,0442 | 0,093 | 0,4143 | -0,0997 |
| 17 | Consumer | 0,1698 | -0,1178 | 0,3495 | 0,17 |
| 18 | Consumer | 0,0035 | -0,4039 | 0,6675 | 0,0888 |
| 19 | Expert | 0,5645 | 0,2284 | -0,1112 | 0,2628 |
| F1 | F2 | F3 | F4 | F5 | F6 | F7 | |
|---|---|---|---|---|---|---|---|
| Eigenvalues | 4,9517 | 2,2941 | 1,365 | 1,2402 | 0,7917 | 0,4855 | 0,4978 |
Other coefficients, namely the z-scores and the factor-scores, are usually calculated to complete the analysis and facilitate the interpretation of factors. Those scores are typically used to describe factors and to facilitate their interpretation [20,42,47]. The z-scores, indicating the relation between statements and factors, are calculated for each factor as a weighted average of the scores given by the “flagged” Q sorts [20]. Then, the z-scores are converted in the form of the original “+4” to “-4” metric to produce rounded factor scores [20,42,44]. The factor scores report the scores for each statement “computed as ideal Q sorts from the highly loaded sorts” [42]. In other words, factor scores are “empirical generalizations of a subjective viewpoint shared by those whose individual sorts are significantly loaded on the same factor” [42]. The methodology also allows the calculation of the distinguishing statements, those that significantly differ from one factor to another [20].
From the nineteen Q sorts, nine loaded significantly on Factor 1, four on Factor 2, two on Factor 3, and two on Factor 4. Two Q sorts were not assigned to any factor. The variance explained for each factor was respectively: 26% for Factor 1, 11% for Factor 2, 6% for Factor 3 and 9% for Factor 4. The total variance explained was 52%. The interpretation of factors was based using the most positively characteristic statements (+4, +3, +2) and most negatively characteristic statements (–4, –3, –2) and the most distinguishing statements [20,25]. Factor scores for most relevant statements are reported respectively in The adoption of HWLs was not seen as an attack on the national economy. Also, the participant strongly disagreed that the adoption of HWLs will damage the Mediterranean diet and added, “What does the Mediterranean diet have to do with alcohol?”.
Table 5, Table 6, Table 7 and Table 8. To better identify the divergent views four labels were selected for each factor.
| n | Statement | F1A | F1B | F2 | F3 | F4 |
|---|---|---|---|---|---|---|
| 4 | For me, the European policies supporting the wine sector have proved incapable of defending quality products again. | +4** | -4** | -1 | -1 | -2 |
| 5 | I think Europe cannot treat a bottle of wine like a pack of cigarettes. | +3** | -3** | -1 | -4 | -2 |
| 8 | I think that we should not engage in psychological terrorism but use proper communication (e.g., on social media, TV, etc.) to educate citizens about the consumption of wine. | +4 | -4 | +4 | -1 | +3 |
| 9 | In my view, the Italian government should not oppose using health warnings on labels. | -3** | +3** | +1 | +2 | 0 |
| 10 | I think the labels should also include information to protect the health wine consumers as in other countries (e.g., Ireland). | -2* | +2* | -1 | +3 | 0 |
| 21 | In my opinion, using warning labels does not risk compromising the role of wine as an ambassador of a system that respects the environment and local traditions. | -3 | +3 | +2 | -2 | -3 |
| 25 | I find it helpful to indicate on the labels that drinking wine is seriously damaging to own health. | -4 | +4 | -2 | +4 | +1 |
| 27 | For me, using these labels is a concrete attack on Italian wine. It is unclear why wanting to tackle this problem and hypocritically hide other issues under the carpet (e.g., fine dust, pollution, etc.). | +3** | -3** | -2 | +1 | -2 |
| 31 | For me, using health warnings on the label is supported by a scientific basis. | -1** | +1** | +1 | +4 | +3 |
| 33 | I don’t think that the introduction of these labels represents an attempt by some northern European countries to demonise sectors that represent a heritage of our food and wine culture and tradition. | -4* | +4* | +3 | 0 | -2 |
| 38 | For me, these labels risk damaging the Mediterranean diet, a fundamental tool for protecting health. Recent studies have shown how the moderate use of wine could benefit health. | +3** | -3** | -3 | 0 | -4 |
| 40 | For me, adopting such labels is irresponsible and would create difficulties in a vital supply chain, one of the most relevant to our agri-food sector. | +2 | -2 | -3* | +3 | -1 |
| n | Statement | F1A | F1B | F2 | F3 | F4 |
|---|---|---|---|---|---|---|
| 7 | For me, using these labels is wrong because the habit of getting drunk should be fought by adopting a different cultural approach to wine, drunk with meals and in limited quantities. | +2 | -2 | 0 | -3** | +3 |
| 10 | I think the labels should also include information to protect the health wine consumers as in other countries (e.g., Ireland). | -2 | +2 | -1 | +3** | 0 |
| 14 | For me, using these labels ruins the aesthetic and valuable sense of wine bottles. | 0 | 0 | -1 | -4** | 0 |
| 17 | I believe these labels are a clear obstacle to the free circulation of goods and involve additional costs which will increase the price of wine to final consumers. | +1 | -1 | -2 | +3** | 0 |
| 22 | I think that information policies on bottles related to the risks of alcohol abuse cannot be based solely on labels because these warnings receive very minimal attention from consumers | +1 | -1 | +3 | -3** | +2 |
| 25 | I find it helpful to indicate on the labels that drinking wine is seriously damaging to own health. | -4 | +4 | -2 | +4** | +1 |
| 28 | I think using warning labels is a low-cost deterrent measure because it does not involve public investment, awareness campaigns or particular commitment by the public administration. | -1 | +1 | +3 | -3** | +1 |
| 31 | For me, using health warnings on the label is supported by a scientific basis. | -1 | +1 | +1 | +4 | +3 |
| n | Statement | F1A | F1B | F2 | F3 | F4 |
|---|---|---|---|---|---|---|
| 6 | In my opinion, with these labels, Europe risks causing enormous damage to the world of wine, which in Italy alone involves millions of employees and produces a significant annual turnover. | +2 | -2 | -3* | 0 | -1 |
| 8 | I think that we should not engage in psychological terrorism but use proper communication (e.g., on social media, TV, etc.) to educate citizens about the consumption of wine. | +4 | -4 | +4* | -1 | +3 |
| 17 | I believe these labels are a clear obstacle to the free circulation of goods and involve additional costs which will increase the price of wine to final consumers. | +1 | -1 | -2** | +3 | 0 |
| 18 | I think that the use of these labels represents a sort of ‘disclaimer’ by those who impose them. | +2 | -2 | -2** | +1 | +4 |
| 21 | In my opinion, using warning labels does not risk compromising the role of wine as an ambassador of a system that respects the environment and local traditions. | -3 | +3 | +2** | -2 | -3 |
| 24 | I think it is a fact that the adoption of such labels will cause severe setbacks for wine exports. | +1 | -1 | -4** | +1 | -1 |
| 26 | I think there is nothing wrong with creating labels inviting moderate consumption. It could be a way to encourage responsible alcohol consumption without scaring consumers with too negative information. | -1 | +1 | +4 | +2 | +1 |
| 32 | I believe using these labels will negatively affect the promotion policy of alcoholic beverages, wine included. | +1 | -1 | -2** | +2 | +2 |
| 33 | I don’t think that the introduction of these labels represents an attempt by some northern European countries to demonise sectors that represent a heritage of our food and wine culture and tradition. | -4 | +4 | +3** | 0 | -2 |
| 35 | I think that inserting some important analytical values on the back of the label is not so harmful; on the contrary, it could - together with other precautions - lead to a greater valorisation of wines produced responsibly. | -1 | +1 | +2** | -2 | -2 |
| 39 | I believe that to reduce the adverse effects that introducing these labels would have on the wine sector, the Italian government should intervene with economic-financial support to all operators in the sector. | -1 | +1 | -3** | +2 | +1 |
| 40 | For me, adopting such labels is irresponsible and would create difficulties in a vital supply chain, one of the most relevant to our agri-food sector. | +2 | -2 | -3* | +3 | -1 |
| n | Statement | F1A | F1B | F2 | F3 | F4 |
|---|---|---|---|---|---|---|
| 3 | I think nobody wants to ban drinking, but at the same time, the government should limit individual choices if this negatively impacts public health. | -1 | +1 | +1 | +1 | -3 |
| 7 | For me, using these labels is wrong because the habit of getting drunk should be fought by adopting a different cultural approach to wine, drunk with meals and in limited quantities. | +2 | -2 | 0 | -3 | +3 |
| 8 | I think that we should not engage in psychological terrorism but use proper communication (e.g., on social media, TV, etc.) to educate citizens about the consumption of wine. | +4 | -4 | +4 | -1 | +3 |
| 12 | For me, there are no safe amounts of alcohol consumption for health. | -2 | +2 | -4 | -2 | +4** |
| 18 | I think that the use of these labels represents a sort of ‘disclaimer’ by those who impose them. | +2 | -2 | -2 | +1 | +4* |
| 19 | In my opinion, using these labels would not change consumption in any way, and it would ruin the pleasure of drinking wine at the table. | 0 | 0 | 0 | 0 | -3** |
| 22 | I think that information policies on bottles related to the risks of alcohol abuse cannot be based solely on labels because these warnings receive very minimal attention from consumers | +1 | -1 | +3 | -3 | +2 |
| 30 | I believe that freedom of choice in our society is a thing of fact. In any case, being free to drink as much as you like is separate from being correctly informed about the possible risks. | 0 | 0 | +3 | 0 | +2 |
| 31 | For me, using health warnings on the label is supported by a scientific basis. | -1 | +1 | +1 | +4 | +3 |
| 36 | I think there are a lot of carcinogenic foods today. From meat to vegetables. You only live once, and it will certainly not be these labels that influence my alcohol consumption. If you don’t die of one thing, you die of another. | 0 | 0 | 0 | -1 | +3** |
3.1 Factor 1: The “Nationalism” view
The first factor is bipolar; eight of the nine defining Q sorts have positive loadings, and only one (Q sort 2) is negative [20,58]. For this reason, the bipolar factor composed of discourses 1A and 1B. The latter can be considered a ‘mirror image’ Q sort to that of 1A [59]. The most distinguishing and high ranked statements are reported in .
Table 5. The positive loadings of this factor (Factor 1A) perceive the adoption of health warnings on wine labels with solid hostility. For the ‘pro- Nationalism’ view, the proposal appears dangerous for the wine market, especially for the Italian one. Participants belonging to Factor 1A believe that these labels are essentially an attack on the Italian economy. This negative perception is drawn from their ‘anti-European’ position, which made it strongly different from all other factors. The participants who shared this attitude felt protection towards national interests against European policies (4, +4**; 27, +3**; 33, -4*; 40, +2). According to this viewpoint, wine is an ambassador of Made in Italy and part of the national culinary tradition. For this reason, the national government should protect the Italian wine sector by contrasting the use of HWLs (9, -3**). Looking at the post-sort interviews, some participants stated: “The government should oppose it because it is not the right solution to the problem of alcoholism” (P3); “It is an attack on Italy, on our economy, which will surely cause strong repercussions” (P11). Adopting warning labels is also wrong for other reasons. First, if wine bottles would be treated as cigarettes - adopting HWLs - a precious sector which involves thousands of companies will be compromised (5, +3**; 21, -3). Second, warning labels are considered “useless” and an instrument for imposing “psychological terrorism” on consumers (8, +4; 25, -4). Third, this view supports the moderate consumption of wine in accordance with the Mediterranean diet principles (38, +3**). Lastly, for participants, the proposal is not supported by scientific basis (31, -1**). Regarding discourse 1B, factor scores should be reversed, e.g., statements 9, 25, 33 engender a strong agreement, and statements 4, 5, 27, 38 engender a strong disagreement. It is important to underline that Factor 1B focuses on the same relevant topics of Factor 1A but with a negative view. The participant (Q sort 2) provided some comments that might verify his position. For example, it takes distance from ‘victimhood’, which characterise the ‘pro-Nationalism’ opinions (Factor 1A). In particular, referring to the statement 27, which disagrees, this participant stated: “How boring is this sovereignist victimhood?”. The adoption of HWLs was not seen as an attack on the national economy. Also, the participant strongly disagreed that the adoption of HWLs will damage the Mediterranean diet and added, “What does the Mediterranean diet have to do with alcohol?”.
3.2 Factor 2: The “Market-oriented” view
An optimistic attitude towards the adoption of health warnings mainly characterizes this second factor Table 6. According to this view, health warnings will help to increase transparency in the market and help consumers to make informed choices. The factor has a strong focus on market dynamics and does not perceive that warning labelling adoption would negatively compromise the image of Italian wine worldwide (21, +2**) and the economy of the entire sector, including turnover, employment and total exports (6, -3*; 24, -4**; 40, -3*). Some participants stated: “I do not think that these labels will do devastating damage to the world of wine, particularly Italian wine, which remains an excellent quality product” (P15); “Those who take a healthy and consistent approach to wine will not change the way they consume it, so I don’t think exports would be affected” (P12). Furthermore, for this view, HWLs will not create obstacles to the free circulation of goods nor increase wine costs or prices for the final consumer (17, -2**). One participant stated: “I believe that adopting health warning labels is useful and low-cost” (P6). Contrary to perspectives 1 and 4, this view does not perceive these labels with hostility as an attempt by other European countries to penalize Italian wines (33, +3**). Regarding this point one affirmed: “Good communication is necessary to ensure that people are educated on the correct consumption of wine” (P6). Also, adopting warning labels with proper communication could add more value to wines produced responsibly (35, +2**), inform consumers, and promote moderate and responsible consumption (26, +4).
3.3 Factor 3: The “Health-first” view
More than all the other views, this third view shows a strong focus on health aspects and has high expectations towards the ability of HWLs to protect consumers’ health Table 7. One participant affirmed: “Health is the first element to protect” (P16). Looking at the most distinguishing statements, adopting health warnings is perceived as necessary to protect public health, which contrasts mainly with the first perspective (10, +3**, 25, +4**). For example, concerning the statement 25, one stated: “I find these labels useful for highlighting the motivations” (P18). Overall, this view particularly trusts the use of measures based on labelling to inform consumers about health risks (7, -3*). The overconfidence with HWLs of those belonging to this factor is also supported by a scientific base (31, +4) and by the belief that consumers will pay high for those health-related information (22, -3**). Distinct from all other viewpoints, this third perspective is not worried about the aesthetic impact of warning labels on wine bottles (14, -4**) and retained that this is a low-cost measure (28, -3**). However, this view raises some concerns about the possible price increase (17, +3*). Regarding this last point, one participant confirmed: “Anything that affects wine damages it; if it doesn’t damage it, it causes problems for those who consume it” (P18).
3.4 Factor 4: The “Keep us alive” view
This last view is mainly characterised by an evident scepticism regarding adopting health-warning labels Table 8. Participants from this view are conscious of the risks related to alcohol abuse and underline how, in the end, there are no safe amounts of alcohol consumption for health. Adopting HWLs for wine does not make sense for them (12, +4**). On the other hand, this viewpoint recognises that these labels are supported by scientific basis (+31, +3). However, for participants who share this view, governments should not impose limits on the consumption of wine (3, -3). This viewpoint expresses a “fatalistic” approach to health behaviour, supporting the idea that many foods could negatively affect individuals’ health (36, +3**). In this sense, showing a warning label on wine bottles that informs on the potential adverse effects of wine consumption is useless (22, +2), with the only result of ruining the pleasure of drinking a good wine (19, -3**). The strategy to use health-warning labels is unacceptable also because it represents a sort of disclaimer by politicians (18, +4*). For this perspective, similar to the first perspective, it would be more effective a radical cultural change (7, +3). Regarding this last point, one participant confirmed: “Nowadays, practically everyone knows the side effects of many substances, and yet they continue to abuse them. If there is genuine interest, a radical change in lifestyle must be done” (P1).
The results identify four key perspectives on adopting HWLs on wine bottles, each offering valuable insights into consumer and expert opinions within the wine sector. The results generally reveal a broad awareness of the health impact associated with wine consumption across all factors. However, the four viewpoints differed substantially in their responses to the mandatory adoption of HWLs.
The results showed that, for Factors 2 and 3, mandatory HWLs on all alcoholic beverages, including wine, could raise awareness of health-related risks and support consumers make better-informed choices. This suggests a potential positive impact of HWLs on wine bottles, offering hope for a more informed and healthier consumer base. Nevertheless, significant differences exist between the viewpoints of Factor 2 and Factor 3 regarding the HWLs on wine bottles. According to the latter (the “Health-first” view), Italian consumers still have a low level of awareness about the health risks associated with alcohol consumption. Therefore, HWLs on wine container could be crucial in raising awareness about the dangers of alcohol consumption. Previous studies [9,11], highlighting that only a small percentage of alcohol consumers are aware of the health-related risks associated with alcohol consumption. However, while HWLs may enhance awareness of these risks, their effectiveness ultimately depends on an individual’s perception. As found in [60] and [11], risk perception can strongly affect an individual’s level of engagement with a risky situation (e.g., beverage alcohol consumption) and, consequently, his acceptance of the related consequences [61]. According to some scholars [11] and [62], peoples’ perceptions of health-related risks from alcohol consumption do not necessarily increase after being exposed to HWLs. The findings of [63] support this, showing that society tends to have higher acceptability for voluntary risks (e.g., smoking, drinking alcohol) compared to involuntary risks (e.g., flooding, storms, earthquakes). Furthermore, as also raised by [64] research suggests that HWLs alone may not be sufficient to reduce alcohol consumption.
According to [61] an individual’s perception of risk is strongly influenced by their knowledge of specific hazards, such as alcoholic beverages. The mandatory introduction of HWLs on wine bottles should be part of a broader strategy. This strategy should not only include HWL education campaigns but also support programs targeting at-risk populations, highlighting the complexity of the issue, and pressing the need for multi-faceted solutions.
Similarly to the previous viewpoint, Factor 2 (the “Market-oriented” view) is also favourable for adopting of HWLs. People who are part of this factor consider the mandatory adoption of detailed HWLs on wine containers (e.g., bottles and cans) an effective policy tool to regulate the alcohol market and address various externality costs, including those related to public health impact [65]. According to this view, mandatory HWLs can be considered both a regulatory instrument and an informational tool used by the government to establish the socially optimal level of alcohol consumption. Moreover, according to this “Market-oriented” viewpoint, the mandatory adoption of HWLs on wine containers does not necessarily cause a decrease in wine consumption. According to a previous study, improving knowledge and understanding of wine health related risks may lead to a general increase in consumption [64]. According to [66], responsible wine consumption should be promoted through national and international programmes to reduce alcohol abuse. At the same time, consumers should be educated to consume alcohol based on cultural norms and healthy lifestyles. Typical examples of other regulatory instruments governments could adopt include licensing restrictions to retailers and bars, setting a minimum legal drinking age, and restricting alcohol advertising addressed to young people and adolescents [67]. Health taxes on alcoholic products, which can also be defined as Pigouvian taxes, are considered one of the main economic instruments implemented in many countries worldwide [65,68,69]. In the UK, where excise duty on alcohol has been in place for many years, the government has recently proposed changing the tax from a product volume tax to an alcohol volume tax [70]. These taxes can be complemented with other economic instruments, such as incentives to alcohol-free beverage productions. According to [71], wine with reduced alcohol content or de-alcoholised wine has proven to be an effective measure in reducing the potential health-related effects of alcohol consumption. Governments must implement economic strategies, including price incentives and subsidies, to promote the production and consumption of No-and Low-Alcohol (No-Lo) beverages. As the production of No-Lo wine is still more expensive than traditional wines, supporting innovations in production techniques through R&D projects is necessary [72].
Factor 4 (the “Keep us alive” view) is characterised by a limited interest in adopting HWLs, primarily due to perceptions of limited effectiveness in promoting positive behaviours. The scepticism associated with this factor stems from the belief that individuals who consume wine in moderation will continue to do so, regardless of the presence of HWLs. As reported in the literature, the moderated consumption of wine is considered important for reducing the risk of cardiovascular diseases (CHD). This was first explored by [73], whose findings are often referred to as the “French paradox”. According to this study, despite the relatively high consumption of food rich in saturated fatty acids (e.g., cheese and meat), the mortality rate of the French population due to cardiovascular disease was lower compared to that in other countries with similar diets. This has been partially attributed to the effect of moderate red wine drinking [73]. Regular consumption of red wine is beneficial in many other recent studies conducted in Mediterranean countries [74,75]. The challenge lies in finding effective strategies for those who abuse alcoholic beverages, including wine, and preventing harmful behaviour, especially among younger individuals. According to the Factor 4 viewpoint, if decreasing alcohol abuse is the main objective of the EU Commission, this goal cannot be achieved using labelling alone, which could be seen as a way of discharging responsibility from institutions. Achieving meaningful changes in drinking behaviour requires enhancing knowledge and understanding of the potential health-related hazards connected to the consumption of alcoholic beverages. According to [7,76], the use of HWLs on alcoholic beverages should be only part of a broader campaign to educate people about the health-related risks of alcohol consumption. Public health agencies should implement several other information strategies at the member state level to address misinformation about the alcohol use (and abuse), particularly among the younger generation [68]. These include implementing evidence-based advertising restrictions [77] and school-based preventive alcohol use interventions for adolescents [78,79]. Moreover, a notable feature of the Mediterranean Diet, inscribed in 2013 on the UNESCO list of the Intangible Cultural Heritage of Humanity [80,81] for its cultural significance and health-related benefits, is the moderate consumption of wine.
Factor 1 (the “Nationalism” view) strongly criticised HWLs for reasons beyond the health implications of alcohol use. From this perspective, the labelling is seen as a threat to the national wine industry. Consequently, contrasting the adoption of HWLs on wine bottles is essential to protect domestic and international demand for wine, as this product plays a crucial role in the national economy. These findings are consistent with those in [76], which highlight the general resistance of the alcohol industry to include public health information on the label. The wine industry and farmers have a strong interest in protecting their sector. The Italian wine industry plays a significant role in the global wine market [82]. According to [83], in 2023, Italy produced about 49 million hectolitres of wine, 40% of which was exported in EU and non-EU countries. In Italy, winemaking is performed by over 30,000 wineries, most of which are smallholder grape growers, and involves about 690,000 hectares of vineyard area [83]. The valorisation and protection of this important sector are also seen as important for the Factor 4 viewpoint. This perspective brings the view that introducing HWLs could be an attempt by northern European countries to undermine a key sector of Italy’s economy and cultural heritage. Among typical products, such as Geographical Indication (GI) products, wine represents a strong connection between geographical, environmental and cultural contexts. Some authors [84,85] define this concept as terroir, which refers to the interaction between environmental factors (i.e., biological and physical) and winemaking practices applied in each context that can provide distinctive characteristics to the final product.
This study provides a preliminary investigation into the perception and acceptance of health warning labels (HWLs) on wine bottles, focusing on experts and non-experts within the Italian context, where wine is deeply rooted in national culinary tradition. Using Q methodology, a systematic approach to studying human subjectivity, the research highlights a lack of consensus on mandatory HWLs for wine in Italy. While Factor 2 (the “Market-oriented” view) and Factor 3 (the “Health-first” view) reflect a more positive stance towards HWLs, accounting for the majority of consumers, Factor 1 (the “Nationalism” view) and Factor 4 (the “Keep us alive” view), mainly represented by wine industry professionals, oppose such measures. Despite these divergent views, there is shared recognition of the need to distinguish between alcohol abuse and moderate consumption. Different countries have varying regulations; in regions with less stringent warnings, companies may leverage this to market their products more aggressively. The Irish regulation on alcoholic products, among the strictest in the EU, has sparked widespread debate, illustrating the complexity of implementing HWLs across diverse cultural and market contexts. Discussions in Italy and other major EU wine-producing countries are intensifying due to the potential implications for the wine industry. As this debate unfolds, a nuanced and multi-faceted approach is essential for evaluating the potential effects of HWLs on both abusive and social wine consumption, particularly among younger generations. Future research should analyse the impact of HWLs in countries where such measures are already enforced, by promoting real-world studies, and comparing the findings with existing experimental research in Italy.
In some cases, companies may view HWLs as a competitive disadvantage. Stricter regulations on health warnings may push companies to innovate or differentiate their products in ways that comply without compromising appeal. On the other side, companies might use health warnings strategically to enhance their image by appearing responsible and socially conscious, thus potentially gaining a competitive edge in the marketplace.
In this framework, harmonizing HWL designs with international regulatory frameworks, such as the Trans-Pacific Partnership (TPP), could be crucial to minimize disruptions to both domestic and export markets. Careful alignment with existing EU and member state wine legislation is equally important. Health warnings can serve as a competitive measure in the marketplace, nevertheless, the effectiveness of these warnings often depends on various factors, including cultural context, consumer behaviour, and regulatory enforcement.
While this study sheds light on critical perspectives, it is limited by its focus on the Italian context and the exclusion of wine growers from the participant set. Replicating the research in other EU countries and incorporating additional stakeholders would provide a broader understanding of the varied responses to HWLs, offering valuable insights for future policy development.
The experimental procedure was approved by Università Politecnica delle Marche ethical committee and conducted in accordance with the principles outlines in the Declaration of Helsinki.
CRediT authorship contribution statement
Conceptualization: Francesco Solfanelli and Serena Mandolesi; Data curation: Francesco Solfanelli, Serena Mandolesi, Simona Naspetti and Ileana Silvestri; Investigation: Francesco Solfanelli, Serena Mandolesi and Ileana Silvestri; Methodology: Serena Mandolesi; Formal analysis: Francesco Solfanelli and Serena Mandolesi; Validation: Raffaele Zanoli; Writing - original draft: Francesco Solfanelli and Serena Mandolesi; Writing - review & editing: Francesco Solfanelli, Serena Mandolesi, Simona Naspetti and Raffaele Zanoli; Supervision: Francesco Solfanelli.
[1] European Parliament, The EU wine sector, 2023. https://www.europarl.europa.eu/RegData/etudes/BRIE/2023/751399/EPRS_BRI(2023)751399_EN.pdf.
[2] E. Fiorio, Wine, Italy: despite a growing consumer base, Italy’s overall wine consumption is declining, (2022). https://www.winemeridian.com/english-news/wine_italy_despite_a_growing_consumer_base_italy_s_overall_wine_consumption_is_declining/#:~:text=The number of people who,half a liter per day.
[3] M. Lanfranchi, A. Alibrandi, A. Zirilli, G. Sakka, C. Giannetto, Analysis of the wine consumer’s behavior: an inferential statistics approach, British Food Journal 122 (2020) 884–895. https://doi.org/10.1108/BFJ-08-2019-0581.
[4] European Commission, EU agricultural outlook for markets, income and environment, 2021-2031, DG Agriculture and Rural Development, Brussels, 2021. https://doi.org/10.2762/753688.
[5] A. Annunziata, L. Agnoli, R. Vecchio, S. Charters, A. Mariani, Health warnings on wine labels: a discrete choice analysis of Italian and French Generation Y consumers, Wine Economics and Policy 8 (2019) 81–90. https://doi.org/10.1016/j.wep.2019.03.001.
[6] WHO, Global status report on alcohol and health 2018, 2018. http://www.who.int/substance_abuse/publications/global_alcohol_report/msbgsruprofiles.pdf%0Ahttp://www.ncbi.nlm.nih.gov/pubmed/29355346 (accessed June 25, 2023).
[7] WHO, Global strategy to reduce the harmful use of alcohol, (2010) 1–38.
[8] A. Annunziata, L. Agnoli, R. Vecchio, S. Charters, A. Mariani, The Influence of Alcohol Warning Labels on Consumers’ Choices of Wine and Beer, Wine Economics and Policy 9 (2020) 3–21. https://doi.org/10.36253/web-8189.
[9] K. Vallance, T. Stockwell, J. Zhao, S. Shokar, N. Schoueri-Mychasiw, D. Hammond, T.K. Greenfield, J. McGavock, A. Weerasinghe, E. Hobin, Baseline assessment of alcohol-related knowledge of and support for alcohol warning labels among alcohol consumers in northern canada and associations with key sociodemographic characteristics, J Stud Alcohol Drugs 81 (2020) 238–248. https://doi.org/10.15288/JSAD.2020.81.238.
[10] S. Ramlo, Mixed Method Lessons Learned From 80 Years of Q Methodology, J Mix Methods Res 10 (2016) 28–45. https://doi.org/10.1177/1558689815610998.
[11] C. Staub, M. Siegrist, How health warning labels on wine and vodka bottles influence perceived risk, rejection, and acceptance, BMC Public Health 22 (2022) 1–13. https://doi.org/10.1186/s12889-022-12564-8.
[12] C. Staub, C. Fuchs, M. Siegrist, Risk perception and acceptance of health warning labels on wine, Food Qual Prefer 96 (2022) 104435. https://doi.org/10.1016/j.foodqual.2021.104435.
[13] European Parliament and of the Council, Regulation (EU) No 1308/2013, 2013. https://eur-lex.europa.eu/legal-content/EN/TXT/?uri=CELEX%3A02013R1308-20230101.
[14] European Parliament and of the Council, Regulation (EU) 2021/2117, 2021. https://eur-lex.europa.eu/legal-content/EN/TXT/?uri=uriserv:OJ.L_.2021.435.01.0262.01.ENG.
[15] Minister for Health, S.I. No 249/2023 - Public Health (Alcohol) (Labelling) Regulations, 2023.
[16] FoodNavigator, Should alcohol health warnings and ingredient lists appear on-label, off-label, or not at all?, (2022). https://www.foodnavigator.com/Article/2022/04/12/New-alcohol-labelling-on-label-off-label-via-QR-codes-or-not-at-all.
[17] S. Minzer, R. Estruch, R. Casas, Wine Intake in the Framework of a Mediterranean Diet and Chronic Non-Communicable Diseases: A Short Literature Review of the Last 5 Years, Molecules 25 (2020). https://doi.org/10.3390/molecules25215045.
[18] F.G. Santeramo, A. Seccia, G. Nardone, The synergies of the Italian wine and tourism sectors, Wine Economics and Policy 6 (2017) 71–74. https://doi.org/10.1016/j.wep.2016.11.004.
[19] W. Stephenson, Technique of factor analysis, Nature 136 (1935) 297–297. https://doi.org/10.1038/136297b0.
[20] S.R. Brown, Political subjectivity: Applications of Q methodology in political science, 1980.
[21] J. V. Stanton, D.T. Guion, Consumer attitudes toward organic foods: An exploration of U.S. market segments, Elsevier, 2010. https://doi.org/10.1108/S0885-2111(2010)0000012004.
[22] S. Naspetti, S. Mandolesi, R. Zanoli, Using visual Q sorting to determine the impact of photovoltaic applications on the landscape, Land Use Policy 57 (2016) 564–573. https://doi.org/10.1016/j.landusepol.2016.06.021.
[23] C. Hall, Identifying farmer attitudes towards genetically modified (GM) crops in Scotland: Are they pro- or anti-GM?, Geoforum 39 (2008) 204–212. https://doi.org/10.1016/j.geoforum.2007.06.003.
[24] S. Mandolesi, S. Naspetti, R. Zanoli, Exploring edible insects’ acceptance through subjective perceptions: a visual Q study, J Insects Food Feed 8 (2022) 565–577. https://doi.org/10.3920/jiff2021.0016.
[25] P. Walder, J. Kantelhardt, The Environmental Behaviour of Farmers – Capturing the Diversity of Perspectives with a Q Methodological Approach, Ecological Economics 143 (2018) 55–63. https://doi.org/10.1016/j.ecolecon.2017.06.018.
[26] K.B. Song, S. Lê, H.R. Kim, S.M. Yoo, M.S. Kang, H.N. Chu, I.S. Hwang, J.H. Hong, Consumer-driven characterization of healing foods using Q methodology and Q based sorting, Food Qual Prefer 117 (2024). https://doi.org/10.1016/j.foodqual.2024.105181.
[27] A. Goodluck, D.J. Otieno, W. Oluoch-Kosura, Understanding farmers’ perceptions on advisory services in Tanzania: Comparative insights from principal component analysis and Q-methodology, Heliyon 10 (2024) e34541. https://doi.org/10.1016/j.heliyon.2024.e34541.
[28] L. Zagata, T. Uhnak, J. Hrabák, Moderately radical? Stakeholders’ perspectives on societal roles and transformative potential of organic agriculture, Ecological Economics 190 (2021). https://doi.org/10.1016/j.ecolecon.2021.107208.
[29] N. Yarar, U.R. Orth, Consumer lay theories on healthy nutrition: a Q methodology application in Germany, Appetite 120 (2018) 145–157. https://doi.org/10.1016/j.appet.2017.08.026.
[30] A. Svanidze, M. Costa-Font, Revealing the challenges facing Georgia’s wine industry from a natural winemaker perspective using Q-methodology, International Journal of Wine Business Research 35 (2023) 89–120. https://doi.org/10.1108/IJWBR-06-2021-0036.
[31] L. Jakšić, E. Ivanjko, M. Njavro, Q-methodology: theoretical framework for policy making in the Croatian wine sector, International Journal of Wine Business Research 30 (2018) 428–445. https://doi.org/10.1108/IJWBR-07-2017-0046.
[32] K.J. Winkler, K.A. Nicholas, More than wine: Cultural ecosystem services in vineyard landscapes in England and California, Ecological Economics 124 (2016) 86–98. https://doi.org/10.1016/j.ecolecon.2016.01.013.
[33] W. Stephenson, The study of behavior: Q-technique and its methodology, University of Chicago Press, Chicago, IL, US, 1953.
[34] S. Ramlo, Examining Subjectivity with Q Methodology, 1st Editio, Routledge, London, 2025.
[35] W. Stephenson, The inverted factor technique, British Journal of Psychology. General Section 26 (1936) 344–361. https://doi.org/10.1111/j.2044-8295.1936.tb00803.x.
[36] D.J. Delprato, S.R. Brown, Q Methodology and the Operant Construct, Operant Subjectivity 25 (2002) 139–147. https://doi.org/10.22488/okstate.02.100599.
[37] T.A. Steelman, L.A. Maguire, Understanding participant perspectives: Q-methodology in national forest management, Journal of Policy Analysis and Management 18 (1999) 361–388. https://doi.org/10.1002/(SICI)1520-6688(199922)18:3<361::AID-PAM3>3.0.CO;2-K.
[38] B.F. Skinner, Science and Human Behavior, 1953.
[39] A. Stirling, “Opening Up” and “Closing Down,” Sci Technol Human Values 33 (2008) 262–294. https://doi.org/10.1177/0162243907311265.
[40] A. Wolf, Many Minds, Common Sense and Genetically Modified Food: A Role for Q Methodology, East Asian Sci Technol Soc 4 (2010) 565–583. https://doi.org/10.1007/s12280-010-9142-1.
[41] S. Watts, P. Stenner, Doing Q methodology: theory, method and interpretation, Qual Res Psychol 2 (2005) 67–91. https://doi.org/10.1191/1478088705qp022oa.
[42] B. McKeown, D.B. Thomas, Q Methodology (Quantitative Applications in the Social Sciences Book 66), 2nd ed., Sage Publications, 2013.
[43] C.H. Davis, C. Michelle, Q Methodology in Audience Research : Bridging the Qualitative / Quantitative ‘ Divide ’?, Journal of Audience & Reception Studies 8 (2011) 559–593.
[44] A. Zabala, C. Sandbrook, N. Mukherjee, When and how to use Q methodology to understand perspectives in conservation research, Conservation Biology 32 (2018) 1185–1194. https://doi.org/10.1111/cobi.13123.
[45] S.R. Brown, Q Technique and Questionnaires, Operant Subjectivity 25 (2002). https://doi.org/10.22488/okstate.02.100594.
[46] D.B. Thomas, L.R. Baas, The Issue of Generalization in Q Methodology: “Reliable Schematics” Revisited, Operant Subjectivity 16 (1992) 18–36. https://doi.org/10.22488/okstate.92.100599.
[47] W. Stephenson, Protoconcursus: the concourse theory of communication*, Operant Subjectivity (1986) 37–58.
[48] S.R. Brown, A primer on Q methodology, Operant Subjectivity 16 (1993) 91–138. https://doi.org/10.1177/104973239600600408.
[49] G. Sneegas, S. Beckner, C. Brannstrom, W. Jepson, K. Lee, L. Seghezzo, Using Q-methodology in environmental sustainability research: A bibliometric analysis and systematic review, Ecological Economics 180 (2021) 106864. https://doi.org/10.1016/j.ecolecon.2020.106864.
[50] S. Mandolesi, E. Cubero Dudinskaya, S. Naspetti, F. Solfanelli, R. Zanoli, Freedom of Choice - Organic Consumers’ Discourses on New Plant Breeding Techniques, Sustainability 14 (2022) 8718. https://doi.org/10.3390/SU14148718.
[51] R.A. Fisher, The design of experiments, 1960. https://doi.org/10.1136/bmj.1.3923.554-a.
[52] J.S. Dryzek, J. Berejikian, Reconstructive democratic theory, American Political Science Review 87 (1993).
[53] S.E. Toulmin, The Uses of Argument, Cambridge, United Kingdom: Cambridge University Press, 1958.
[54] P. Kline, An easy guide to factor analysis, 1st Editio, Routledge, London, London, UK, 1994. https://doi.org/https://doi.org/10.4324/9781315788135.
[55] S. Eden, A. Donaldson, G. Walker, Structuring subjectivities? Using Q methodology in human geography, Area 37 (2005) 413–422. https://doi.org/10.1111/j.1475-4762.2005.00641.x.
[56] T. Webler, S. Danielson, S. Tuler, Using Q method to reveal social perspectives in environmental research, Social and Environmental Research 01301 (2009) 1–54. http://www.seri-us.org/pubs/Qprimer.pdf.
[57] S. Banasick, KADE: A desktop application for Q methodology, J Open Source Softw 4 (2019) 1360. https://doi.org/10.21105/joss.01360.
[58] S. Watts, P. Stenner, Doing Q methodological research: theory, method and interpretation, 2012. https://doi.org/10.4135/9781446251911.
[59] J. Fisher, K. Brown, Wind energy on the Isle of Lewis: Implications for deliberative planning, Environ Plan A 41 (2009) 2516–2536. https://doi.org/10.1068/a41129.
[60] P. Lundborg, B. Lindgren, Risk perceptions and alcohol consumption among young people, J Risk Uncertain 25 (2002) 165–183. https://doi.org/10.1023/A:1020695730192.
[61] M. Siegrist, J. Árvai, Risk Perception: Reflections on 40 Years of Research, Risk Analysis 40 (2020) 2191–2206. https://doi.org/10.1111/risa.13599.
[62] K.M. Joyce, M. Davidson, E. Manly, S.H. Stewart, M. Al-Hamdani, A systematic review on the impact of alcohol warning labels, J Addict Dis 42 (2024) 170–193. https://doi.org/10.1080/10550887.2023.2210020.
[63] J. Rehm, D.W. Lachenmeier, R. Room, Why does society accept a higher risk for alcohol than for other voluntary or involuntary risks?, BMC Med 12 (2014) 1–6. https://doi.org/10.1186/s12916-014-0189-z.
[64] N. Gold, M. Egan, K. Londakova, A. Mottershaw, H. Harper, R. Burton, C. Henn, M. Smolar, M. Walmsley, R. Arambepola, R. Watson, S. Bowen, F. Greaves, Effect of alcohol label designs with different pictorial representations of alcohol content and health warnings on knowledge and understanding of low-risk drinking guidelines: a randomized controlled trial, Addiction 116 (2021) 1443–1459. https://doi.org/10.1111/add.15327.
[65] C.M. Doran, T.A. Jainullabudeen, Economic efficiency of alcohol policy, Appl Health Econ Health Policy 8 (2010) 351–354. https://doi.org/10.2165/11584830-000000000-00000.
[66] U. Fradera, N. Fritella, D. Gonzalez, G. Sandeman, E. de Diego, C. Terrien, Digital online training for wine professionals: From responsible service to a sustainable consumption of wine, BIO Web Conf 68 (2023) 3–6. https://doi.org/10.1051/bioconf/20236804011.
[67] WHO, Health Taxes Policy and Practice, 2022. https://doi.org/10.1142/9781800612396_bmatter.
[68] WHO, Global alcohol action plan, 2024.
[69] R. Griffith, M. O’Connell, K. Smith, Tax design in the alcohol market, J Public Econ 172 (2019) 20–35. https://doi.org/10.1016/j.jpubeco.2018.12.005.
[70] K. Anderson, G. Wittwer, Proposed alcohol tax reform in the United Kingdom: Implications for wine-exporting countries, Journal of Wine Economics 17 (2022) 117–126. https://doi.org/10.1017/jwe.2022.19.
[71] T. Bucher, K. Deroover, C. Stockley, Production and Marketing of Low-Alcohol Wine, in: Advances in Grape and Wine Biotechnology, 2019. https://doi.org/10.5772/intechopen.87025.
[72] K. Anderson, The emergence of lower-alcohol beverages: The case of beer, Journal of Wine Economics 18 (2023) 66–86. https://doi.org/10.1017/jwe.2023.8.
[73] S. Renaud, M. de Lorgeril, Wine, alcohol, platelets, and the French paradox for coronary heart disease, The Lancet 339 (1992) 1523–1526. https://doi.org/https://doi.org/10.1016/0140-6736(92)91277-F.
[74] A. Nieddu, L. Vindas, A. Errigo, J. Vindas, G.M. Pes, M.P. Dore, Dietary Habits, Anthropometric Features and Daily Performance in Two Independent Long-Lived Populations from Nicoya peninsula (Costa Rica) and Ogliastra (Sardinia), Nutrients 6 (2020) 1621. https://doi.org/10.3390/nu12061621.
[75] G. Benedetto, D. Carboni, The Health effects of wine: The case of longevity in Sardinia, BIO Web Conf 56 (2023) 1–9. https://doi.org/10.1051/bioconf/20235604004.
[76] P. O’Brien, D. Gleeson, R. Room, C. Wilkinson, Marginalising health information: Implications of the Trans-Pacific Partnership Agreement for alcohol labelling, 2017.
[77] N. Siegfried, D.C. Pienaar, J.E. Ataguba, J. Volmink, T. Kredo, M. Jere, C.D.H. Parry, Restricting or banning of alcohol advertising to reduce alcohol consumption in adults and adolescents, Cochrane Database of Systematic Reviews 2013 (2013). https://doi.org/10.1002/14651858.CD010704.
[78] E.A. Hennessy, E.E. Tanner-Smith, Effectiveness of brief school-based interventions for adolescents: A meta-analysis of alcohol use prevention programs, Prev Sci. 16 (2015) 463–474. https://doi.org/10.1007/s11121-014-0512-0.
[79] K.K. Strøm, F. Adolfsen, S. Fossum, S. Kaiser, M. Martinussen, Effectiveness of school-based preventive interventions on adolescent alcohol use: A meta-analysis of randomized controlled trials, Subst Abuse Treat Prev Policy 9 (2014) 1–11. https://doi.org/10.1186/1747-597X-9-48.
[80] UNESCO, What is Intangible Cultural Heritage?, (2010). https://ich.unesco.org/en/what-is-intangible-heritage-00003.
[81] A. Trichopoulou, Mediterranean diet as intangible heritage of humanity: 10 years on, Nutrition, Metabolism and Cardiovascular Diseases 31 (2021) 1943–1948. https://doi.org/10.1016/j.numecd.2021.04.011.
[82] E. Pomarici, A. Corsi, S. Mazzarino, R. Sardone, The Italian Wine Sector: Evolution, Structure, Competitiveness and Future Challenges of an Enduring Leader, Springer International Publishing, 2021. https://doi.org/10.1007/s40797-021-00144-5.
[83] ISMEA, Vino - I numeri del settore, (2024).
[84] P. Clingeleffer, Terroir: The Application of an Old Concept in Modern Viticulture, in: N.K. Van Alfen (Ed.), Encyclopedia of Agriculture and Food Systems, Academic Press, 2014: pp. 277–288. https://doi.org/https://doi.org/10.1016/B978-0-444-52512-3.00157-1.
[85] H. Johnson, The world atlas of wine: A complete guide to the wines spirits of the world, First Edit, Mitchell Beazley, 1971.