Sustainable wine – for whom? Consumer preferences for different environmental labels
1 Department of Agriculture, Food, Environment and Forestry – DAGRI – University of Florence, P.le delle Cascine 18, 50144 Florence, Italy
2 National Research Council, Institute of BioEconomy (CNR-IBE), Sesto Fiorentino (FI), Italy
*Corresponding author. Email: tommaso.fantechi@unifi.it
Abstract. As sustainability concerns increasingly influence agri-food systems, environmental labels have become an important tool for signalling producers’ ecological responsibility to consumers. However, the effectiveness of such labels depends on how they are perceived and valued in specific product contexts. This study investigates consumer preferences for four environmental labels in the wine sector: organic certification, carbon neutral, reduced water footprint, and reduced pesticide use. A discrete choice experiment conducted with 300 Italian wine consumers, combined with latent class analysis, revealed four distinct segments with heterogeneous responses to environmental labels. While one group rejected environmental labels altogether, others displayed selective interest based on the perceived relevance of the label to specific concerns such as health or resource conservation. These findings highlight the need for tailored communication strategies that take into account both consumers’ cultural associations with wine – such as tradition, authenticity, and artisanal value – and their individual priorities, including differing levels of engagement with various aspects of environmental sustainability. In a category as culturally embedded as wine, where tradition, identity, and quality perceptions play a central role, tailored messaging becomes especially crucial to ensure that environmental-labels are understood, trusted, and valued.
Keywords: sustainable wine, consumer preferences, environmental label, discrete choice experiment.
Index
2. Methodology and econometric analysis
2.3 Econometric model and Latent Class Analysis
3.1 Discrete choice experiment and latent class analysis
Growing environmental concerns have placed increasing attention on the role of agriculture in climate change and the depletion of natural resources [1,2]. Viticulture exemplifies this link, as it generates multiple environmental pressures through various channels, including greenhouse gas emissions, pesticide use, and water consumption. The majority of greenhouse gas emissions in vineyard operations stem from energy use (mainly electricity and fuel) required for irrigation and field work [3–7]. Additionally, in water-limited viticultural areas, irrigation can significantly increase pressure on local water supplies and contribute to the overall environmental footprint [8]. Moreover, due to the susceptibility of grapevines to fungal diseases, viticulture ranks among the sectors with the highest pesticide use per hectare in Europe [9,10]. This dependency raises concerns related to biodiversity, soil health, and the contamination of water bodies, thus prompting interest in more sustainable practices, such as low-input strategies and integrated pest management [11,12]. Given these combined pressures, viticulture provides a compelling case for examining sustainability transitions both for its environmental challenges and its strong connections to local economies, cultural heritage, and rural identity [8,12]. In many wine-producing regions, vineyards are more than a source of agricultural output, they shape landscapes, support tourism, and contribute to the symbolic and economic value of entire territories. These ties are further reinforced by the fact that wineries are often small, locally embedded enterprises, deeply integrated into the social and economic fabric of rural areas. This territorial relevance makes viticulture especially visible and politically salient in sustainability debates [4,6].
Sustainability in viticulture is influenced by a range of conflicting factors. Producers must balance the need to maintain grape quality and economic viability, while consumers demand environmentally responsible products without compromising on taste or price. Meanwhile, public policies promote stricter environmental standards and regulations. At the European level, the Common Agricultural Policy and the Farm to Fork Strategy encourage the adoption of environmentally sustainable farming practices. At the national level, initiatives such as France’s Haute Valeur Environnementale certification and Italy’s National Quality System for Integrated Production (Sistema di Qualità Nazionale Produzione Integrata) encourage producers to meet specific ecological benchmarks and reduce chemical inputs. These initiatives not only drive sustainable practices at the production level but also support transparency through signals of environmental sustainability. In this context, environmental labels have become a key tool for communicating the sustainability attributes of a product whether by indicating reduced impacts, such as lower water consumption or pesticide use, or by highlighting contributions to ecosystem services, such as carbon sequestration [13,14].
As consumers become more environmentally conscious, they are increasingly drawn to products that carry environmental labels. However, despite this growing interest, consumer responses to sustainability claims are not uniform. Delmas and Gergaud [15] highlight that reactions to environmental labels can vary considerably. This may be due to the proliferation of labelled products in the marketplace, which can lead to information overload [16,17], or to concerns about potential trade-offs between environmentally friendly practices and product quality [18,19]. Indeed, some studies show that environmentally certified wines may be perceived as lower in sensory quality, or that consumers struggle to distinguish between different types of labels [20].
The coexistence of various types of environmental labels, ranging from broad sustainability claims to indicators focused on single issues, further complicates consumer interpretation. While some labels, such as organic certification, are often associated with a holistic approach to sustainability, they may not explicitly address all environmental dimensions (e.g., greenhouse gas emissions or water use). Conversely, labels like “carbon neutral” focus on specific impacts but do not account for other aspects such as pesticide use or biodiversity. This divergence can lead consumers to perceive fundamentally different sustainability efforts as interchangeable [21,22]. In this context, the credibility, familiarity, and clarity of environmental labels become decisive for consumer acceptance. Yet, as Schäufele and Hamm [23] point out, such qualities are often lacking in the wine sector, where label meanings and standards are not always well understood [24].
In Italy, while labels highlighting specific positive impacts on natural resources are not yet widespread or standardised, they are beginning to emerge, particularly through private initiatives and pilot projects, reflecting a growing interest in communicating differentiated environmental performances to consumers [25]. Understanding how these labels are perceived can help producers tailor their sustainability strategies and allow policymakers to design clearer and more targeted communication tools. It also sheds light on the specific environmental concerns that matter most to consumers, offering practical insights into the drivers of their purchasing decisions and helping to align supply-side initiatives with real demand.
Building on this premise, the present study explores how consumers perceive different types of environmental labels and how these perceptions influence their preferences in the wine sector. Four labels were selected to reflect distinct dimensions of sustainability: organic certification, carbon neutrality, reduced water footprint, and reduced pesticide use. Extending previous research such as Tait et al. [26], who examined preferences for sustainable wine attributes in Californian Sauvignon blanc and emphasised the relevance of specific environmental outcomes, our study applies a discrete choice experiment to the Italian context. While organic certification is well established in Italy, labels referring to more targeted environmental impacts such as carbon emissions, water use, or pesticide application remain relatively less familiar to consumers and less embedded in their purchasing routines. This context, where wine production is deeply rooted in cultural practices and heritage values, provides a novel perspective for examining how consumers interpret differentiated sustainability claims in a product category shaped by tradition and identity.
In this setting, we adopt a latent class approach to understand how different environmental labels are perceived, uncovering the diversity of consumer reactions to sustainability claims and offering insights into how environmental messaging can be effectively tailored. This paper is structured as follows: the following section presents the methodology employed and the econometric analysis. The subsequent sections report the results, followed by a discussion and concluding remarks, presented in two distinct parts.
2. Methodology and econometric analysis
The data were collected through an online questionnaire administered via Google Forms, structured into five consecutive sections covering respondent eligibility, wine consumption behaviours, motivations underlying preferences, and both psychographic and socio-demographic profiling.
More specifically, the section included three filter questions. The first filter excluded individuals who were not responsible or co-responsible for food purchases within their family, ensuring that participants were involved in purchasing decisions. The second filter focused on the frequency of wine consumption, to ensure that only individuals who consumed wine regularly (at least once a month) were included. Those who never consumed wine or drank it less than once a month were excluded. The third filter concerned the price range at which individuals usually purchase wine for domestic consumption. We excluded those who typically spent more than 14.99 € per bottle, as the study aimed to focus on wines purchased for routine consumption, within a price range of 4 € to 14 €. While wine prices can vary significantly, with some wines exceeding 14 €, this decision aligned with the average monthly wine expenditure per family, which is 11.43 € [27], and the average price of a bottle with a designation of origin, which is 5.40 € [28]. As a result, the respondents who participated in the study were those involved in food purchasing decisions, consumed wine regularly, and spent an amount consistent with the average for routine wine consumption.
The second section presented consumers with a discrete choice experiment (DCE), which will be described in detail in Section 2.2.
In the third section of the questionnaire, consumers were asked to choose their preferred label from the four options and to explain the reasons behind their choice.
The fourth section aimed to assess the psychographic characteristics of the sample in order to explore potential correlations with their preferences. Existing literature highlights the role of sustainability awareness in shaping sustainable food choices [29,30]. To measure this dimension, we employed the Involvement in Sustainable Eating (ISE) scale developed by Pieniak et al. [31] and adapted by Van Loo et al. [32]. Linked to this aspect, we evaluated how consumers perceive the impact of their choices on the future, using the scale on the Consideration of Future Consequences (CFC), developed by Joireman et al. [33]. Finally, assessed the extent to which individuals attribute responsibility to themselves when making sustainability-related choices, utilising the Ascription of Responsibility (AOR) scale [34,35]. All three constructs were measured using five-point Likert scales ranging from 1 (completely disagree) to 5 (completely agree). This range was chosen to ensure consistency, as both the CFC and ISE are originally measured on a 1-to-5 scale, and the AOR scale was consequently adapted. Table 1 presents the items included in each scale, along with key descriptive statistics and Cronbach’s α, which exceeds the minimum threshold of 0.70, indicating satisfactory internal consistency and reliability.
| Scale (Alpha) | Item | Mean | Standard deviation | Source |
|---|---|---|---|---|
| Consideration of future consequences (0.83) | My behaviour is generally influenced by future consequences | 3.26 | 1.26 | Joireman et al., 2012 |
| When I decide to consume food products, I think about the future consequences of my decision | 3.40 | 1.32 | ||
| I prefer foods that make me feel better in the future to foods that satisfy me here and now | 3.34 | 1.25 | ||
| I often think about negative outcomes of the food I consume even if the negative outcome will not occur for many years | 3.43 | 1.36 | ||
| Involvement in sustainable eating (0.94) | Sustainable eating is very important to me | 3.61 | 1.14 | Pienak et al., 2010; Van Loo et al., 2017 |
| I care a lot about sustainable eating | 3.35 | 1.12 | ||
| Sustainable eating means a lot to me | 3.43 | 1.16 | ||
| I am very concerned about the consequences of what I eat in terms of sustainability | 3.43 | 1.16 | ||
| Ascription of responsibility (0.90) | I feel personally responsible for the problems resulting from my non-ecofriendly product purchases | 3.16 | 1.29 | Abrahamse et al., 2011 |
| My non-ecofriendly purchases contribute to environmental problems | 3.46 | 1.27 | ||
| I take joint responsibility for environmental problems | 3.43 | 1.23 |
The fifth and final section of the questionnaire aimed to gather the primary sociodemographic characteristics of the sample.
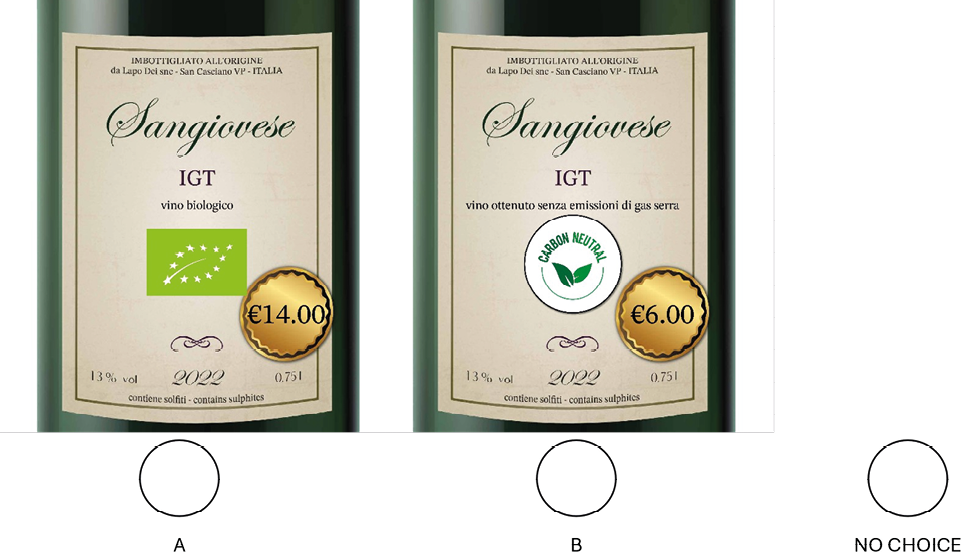
The DCE allows comparing a discrete number of alternatives differentiated by the levels characterising the different attributes of the product. Widely acknowledged in the literature as an effective and intuitive tool, the DCE is capable of readily capturing consumer preferences [36]. Specifically, we asked respondents to imagine themselves at the place where they usually buy wine, with the intention of purchasing a Bordeaux-style bottle of red wine for a regular meal at home. We then asked them to choose between two products or to opt for the no-choice option if neither satisfied their preferences. The base wine selected for our scenarios was a Sangiovese IGT, produced and bottled in Italy (San Casciano, Tuscany, in the Chianti Region) with an alcohol content of 13%. We know from the literature that the grape variety and the origin are fundamental characteristics in the choice of the wine [37-39]. Therefore, we opted for Sangiovese due to its widespread cultivation throughout Italy, making it one of the nation’s most significant and emblematic grape varieties. Furthermore, we chose San Casciano because it is a locality renowned for its strong association with winemaking [40,41]. We centred the analysis on two attributes: price and environmental label (Table 2). As outlined in the introduction, our analysis focused on three key sustainability aspects that environmental labels can signal – water use, pesticide use, and carbon footprint [8–12] – comparing them with the most widespread environmental label on the market, organic certification, and with the absence of any label. While labels addressing specific environmental dimensions (e.g. “carbon neutral” or “reduced water footprint”) have begun to emerge in various markets [25], none of them is yet consolidated or widely recognised by consumers in the Italian context. The environmental labels tested were kept general by design, in order to reflect their current state of development and limited standardisation in the Italian market. The price levels were selected based on market research: the minimum level was set just below the average price of a bottle with a designation of origin, while the maximum level corresponded to the cut-off point used in our sample selection criteria for everyday wine consumption [27, 28]. Figure 1 displays the 4 labels used for the different levels.

| Attribute | Level |
|---|---|
| Price | 4 € |
| 6 € | |
| 10 € | |
| 14 € | |
| Environmental label | None |
| Organic | |
| Reduced water footprint | |
| Reduced pesticides | |
| Carbon neutral |
Once attributes and levels were chosen, we implemented a pilot study involving a sample of 50 wine consumers. Then, we created an efficient design using Ngene software (ChoiceMetrics Ltd.), based on the priors obtained through a pilot study (as suggested by [42]). To minimise respondents’ fatigue in order to ensure their engagement until the end of the survey, each participant was exposed to five choice sets. The sample was randomly divided into two blocks to maintain variation and balance in presentation.
2.3 Econometric model and Latent Class Analysis
Discrete Choice Models derive from McFadden’s Random Utility Theory [43] and Lancaster’s [44] consumer studies. Their theoretical framework posits that a consumer tends to act rationally by choosing among various market options the one that provides them with the maximum utility. Simultaneously, the utility of a good is the result of the characteristics that the good possesses. Therefore, the utility U that individual i obtains by opting for alternative n in a choice set k is:
Uink = β′Xink + ASC + εink(1)<
In Equation 1, β′ represents a vector of coefficients encompassing the impact of each level Xink of every attribute on the utility function. The term ASC (Alternative Specific Constant) is a constant that encapsulates all the product characteristics present in the scenario but not considered within the experimental design (serving as the baseline image). εink is the stochastic component of utility, identically and independently distributed. In our study, during data processing the price was considered a continuous variable, while the environmental labels were treated as categorical variables.
Based on these assumptions, the probability (Equation 2) of choosing a product in a scenario is linked to the utility that the option has compared to the other options [45]. Therefore, it is the ratio between the deterministic component of the utility of alternative n and the sum of the deterministic component of the utility of all the possible alternatives.
(2)
Xin represents the vector of the attributes for individual i for alternative n, while Xik is the same vector for alternative k.
Given the assumption of heterogeneous consumer preferences [46–48], we applied Latent Class Analysis (LCA) to analyse the DCE data. LCA enables the identification of distinct latent classes based on individual response patterns. The analysis was conducted using Latent Gold Choice 4.5 (Statistical Innovation Inc.).
To profile the identified classes, we employed Chi-squared Automatic Interaction Detection (CHAID) analysis, which performs chi-squared tests to assess whether class membership is significantly associated with selected variables. In our study, the dependent variable was class membership as defined by the latent class analysis. CHAID was used to explore class differences across a set of psychographic, sociodemographic, and behavioural variables, and served as the basis for describing class profiles. Although CHAID does not imply causal relationships or offer predictive power, it provides a robust exploratory framework for interpreting latent class structures and identifying the variables that most clearly differentiate one segment from the others. Data processing was conducted using SICHAID Define (version 4.0.5.18305).
The survey was disseminated to a sample of Italian consumers across various social platforms from November 2023 to January 2024. Out of the 437 Italians who initially agreed to participate in our questionnaire, 56 were excluded as they were not responsible for food purchases, and an additional 47 declared never consuming wine. After this screening, the remaining 334 consumers were considered. Among them, 34 reported purchasing wine for more than 14.99 € per litre. Consequently, our final sample consisted of 300 consumers (Table 3). The sample is well-distributed by gender and includes participants from a broad age range. When it comes to wine consumption, our sample primarily spends between 5 and 10 euros on a Bordeaux bottle for regular home consumption, and, additionally, 88% of respondents stated consuming wine more than once a month, with one-third of the sample consuming it at least once every two days.
| Variable | Sample (%) |
|---|---|
| Gender | |
| Male | 144 (48%) |
| Female | 151 (50%) |
| Other | 5 (2%) |
| Age | |
| 18-33 | 100 (33%) |
| 34-53 | 93 (31%) |
| >53 | 107 (36%) |
| Usual spending on wine consumed at home | |
| 0-4.99 € | 90 (30%) |
| 5-9.99 € | 152 (51%) |
| 10-14.99 € | 58 (19%) |
| Frequency of wine consumption at home | |
| Less than once a month | 25 (8%) |
| Once a month | 11 (4%) |
| 2-3 times a month | 52 (17%) |
| 1-2 times a week | 110 (37%) |
| 3-4 times a week | 50 (17%) |
| More than 4 times a week | 52 (17%) |
3.1 Discrete choice experiment and latent class analysis
To choose the best model for our analysis, we explored different options with varying numbers of latent classes. Based on the Bayesian Information Criterion (BIC), which balances model fit and complexity, the 4-class model was selected, as it showed the lowest BIC value, while also ensuring the interpretability and significance of parameters [49,50] (Table 4).
| Number of classes | LL | BIC | Npar | R2 | |||||||||||||||
|---|---|---|---|---|---|---|---|---|---|---|---|---|---|---|---|---|---|---|---|
| 1 | -1516 | 3067 | 6 | 3% | |||||||||||||||
| 2 | -1382 | 2838 | 13 | 19% | |||||||||||||||
| 3 | -1324 | 2762 | 20 | 37% | |||||||||||||||
| 4 | -1289 | 2732 | 27 | 44% | |||||||||||||||
| 5 | -1271 | 2737 | 34 | 51% | |||||||||||||||
| 6 | -1256 | 2746 | 41 | 53% | |||||||||||||||
| 7 | -1241 | 2756 | 48 | 58% | |||||||||||||||
| Note: LL represents log-likelihood, BIC stands for Bayesian Information Criterion, and N. Par denotes the number of parameters. | |||||||||||||||||||
The β coefficients related to the utility function are presented in Table 5. As for the size of the classes, the first class includes 35% of the sample, the second 30%, the third 24%, and the fourth 11%.
| Attribute | Level | Class 1 | Class 2 | Class 3 | Class 4 | ||||||||||||||
|---|---|---|---|---|---|---|---|---|---|---|---|---|---|---|---|---|---|---|---|
| Price | -0.02 | -0.17*** | -0.10* | -1.71 | |||||||||||||||
| Label | Organic | -0.90*** | 0.94* | 5.24*** | 5.69 | ||||||||||||||
| Reduced water footprint | -1.95*** | 1.61*** | 2.13*** | 2.52 | |||||||||||||||
| Reduced pesticides | -0.97*** | 1.58** | 4.30*** | 3.20 | |||||||||||||||
| Carbon neutral | -0.61** | 0.72* | 3.43*** | 2.79 | |||||||||||||||
| ASC | 0.80** | 6.81*** | 3.16*** | -2.84** | |||||||||||||||
| Note: *indicates a significance of 90%, **of 95%, and ***of 99%. For the label attribute, the reference category is the absence of any environmental label. | |||||||||||||||||||
For Class 1, the price of wine does not pose a barrier, at least up to 14 €, which is the highest price point in our experiment. Conversely, all four environmental labels create disutility for these consumers, who prefer a bottle without such characteristics. Class 4 also diverges from the environmentally oriented segments, but does so by predominantly opting for the no-choice alternative—indicating limited engagement with the product options overall. Classes 2 and 3, by contrast, share similarities, as both show a preference for wines with an environmental label. While differences emerge in the relative importance attributed to price – higher for Class 2 than for Class 3 – a clearer understanding of their preferences can be gained by examining how each class evaluates the environmental labels included in the experiment. To this end, we analysed the distribution of preferences across the four labels for Classes 2 and 3. The results, shown in Figure 3, illustrate the relative importance attributed to each label.
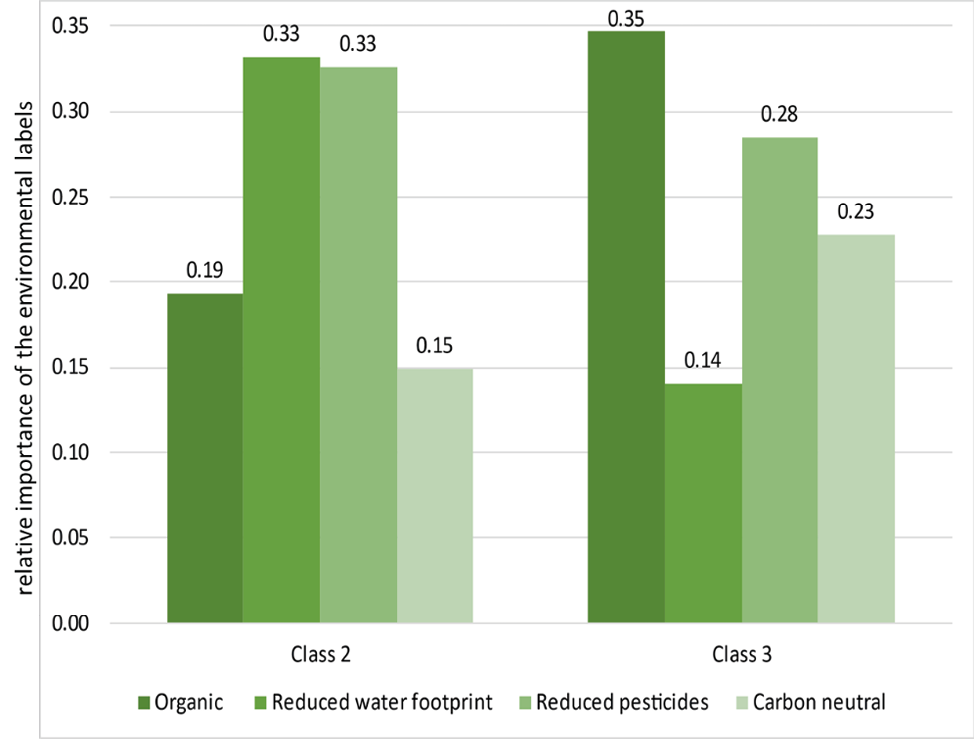
As shown in Figure 3, Class 2 assigns greatest importance to labels indicating reduced water footprint and reduced pesticide use, while organic certification is considered less relevant, and carbon neutrality is the least valued. In contrast, Class 3 places highest importance on organic wine, followed by reduced pesticide use and carbon neutrality. The label referring to reduced water footprint receives the lowest importance in this class.
To better understand the underlying reasons behind the preference for environmental labels in Classes 2 and 3 (i.e., the two segments showing positive utility for environmental labels in the DCE) we analysed responses to a follow-up question included in the third section of the questionnaire. After completing the choice tasks, participants were asked to select their preferred label among the four options and indicate up to three reasons for their choice. For each class, we calculated the relative frequency of each reason by dividing the number of times it was selected by the total number of responses given for that label. The results are presented in Table 6. Data for Classes 1 and 4 are not included, as Class 1 tended to avoid labelled wines, while Class 4 showed general indifference.
| Reason | Organic | Reduced water footprint | Reduced pesticides | Carbon neutral |
|---|---|---|---|---|
| Class 2 | ||||
| Perceived reliability | 23% | 0% | 18% | 3% |
| Familiarity with the label | 14% | 0% | 2% | 0% |
| Concern for the specific issue | 23% | 40% | 24% | 31% |
| Personal relevance of the issue | 3% | 28% | 11% | 28% |
| General concern for sustainability | 6% | 30% | 4% | 31% |
| Perceived health benefits | 17% | 0% | 35% | 0% |
| Appeal of the label design | 8% | 2% | 2% | 7% |
| Expected sensory quality | 6% | 0% | 4% | 0% |
| Class 3 | ||||
| Perceived reliability | 39% | 0% | 7% | 0% |
| Familiarity with the label | 7% | 0% | 0% | 6% |
| Concern for the specific issue | 16% | 33% | 18% | 35% |
| Personal relevance of the issue | 7% | 17% | 20% | 24% |
| General concern for sustainability | 12% | 33% | 15% | 29% |
| Perceived health benefits | 13% | 0% | 38% | 0% |
| Appeal of the label design | 2% | 0% | 2% | 6% |
| Expected sensory quality | 4% | 17% | 0% | 0% |
Cross-referencing the information from Figure 3 and Table 6 offers more specific insights into these two classes. Following the preference ranking expressed in the DCE, the reduced water footprint label, along with the reduced use of pesticides, emerges as most valued in Class 2. The preference for the reduced water footprint label appears to be driven primarily by a specific concern for this issue, followed by its perceived personal relevance and, to a lesser extent, a broader attention to sustainability. The preference for reduced pesticide use is particularly linked to health motivations. The organic certification, third in importance, is primarily appreciated for the trustworthiness of the certification scheme and for concern with pollution reduction as a specific issue. Finally, the carbon neutral label, although the least preferred, still gains support due to a perceived connection with the issue of emissions, personal relevance, and general sustainability awareness.
Class 3, with a strong preference for organic certification, favours this label primarily due to the trust placed in the certification scheme. The reduced pesticide label is also appreciated, primarily for health-related motivations. Preferences for the carbon neutral label reflect a combination of concern about emissions and broader sustainability considerations. The reduced water footprint label, although less central, is valued by some respondents due specific awareness of the issue and its perceived personal relevance.
Table 7 reports the characteristics that were found to be significant in the CHAID analysis (AOR, age, usual spending on wine for domestic consumption, and frequency of wine consumption at home). The analysis was conducted for each class, aiming to understand the variables that distinguish each cluster from the rest of the sample. Finally, Table 8 illustrates how the variables reported in Table 7 distinguish the different classes.
| Class | Variable | ||||||||||||||||||
|---|---|---|---|---|---|---|---|---|---|---|---|---|---|---|---|---|---|---|---|
| Class 1 | Low-Responsibility Consumers – 35% | ||||||||||||||||||
| Ascription of responsibility | Class 1 | Others | Total | ||||||||||||||||
| Medium-low | 43% | 57% | 152 | ||||||||||||||||
| High | 27% | 73% | 148 | ||||||||||||||||
| Class 2 | Budget-Conscious Young Adults – 30% | ||||||||||||||||||
| Age | Class 2 | Others | Total | ||||||||||||||||
| Under 33 | 42% | 58% | 100 | ||||||||||||||||
| Over 33 | 24% | 76% | 200 | ||||||||||||||||
| Usual spending on wine consumed at home | |||||||||||||||||||
| Under 5€ | 49% | 51% | 90 | ||||||||||||||||
| Over 5€ | 19% | 81% | 210 | ||||||||||||||||
| Class 3 | Higher-Spending Wine Buyers – 24% | ||||||||||||||||||
| Usual spending on wine consumed at home | Class 3 | Others | Total | ||||||||||||||||
| Under 5€ | 13% | 87% | 90 | ||||||||||||||||
| Over 5€ | 28% | 72% | 210 | ||||||||||||||||
| Class 4 | Frequent Wine Drinkers – 11% | ||||||||||||||||||
| Frequency of wine consumption at home | Class 4 | Others | Total | ||||||||||||||||
| Less than once a week | 3% | 97% | 88 | ||||||||||||||||
| At least once a week | 14% | 86% | 212 | ||||||||||||||||
| Note: For clarity, the underlined values highlight the variables through which each class differs most markedly from the rest of the sample. Percentages are to be read row-wise and should be interpreted in relation to the overall size of each class. For example, in Class 1 – which represents 35% of the total sample – having 43% of respondents with medium-low Ascription of Responsibility indicates a prevalence of this trait within the group. | |||||||||||||||||||
| Class | Variable | LR Chi-Squared | df | ||||||||||||||||
|---|---|---|---|---|---|---|---|---|---|---|---|---|---|---|---|---|---|---|---|
| Class 1 | Ascription of responsibility** | 8.16 | 1 | ||||||||||||||||
| Class 2 | Age** | 10.62 | 1 | ||||||||||||||||
| Usual spending on wine consumed at home*** | 25.48 | 2 | |||||||||||||||||
| Class 3 | Usual spending on wine consumed at home*** | 9.34 | 1 | ||||||||||||||||
| Class 4 | Frequency of wine consumption at home*** | 9.55 | 1 | ||||||||||||||||
| Note: the sociodemographic, behavioural, and psychographic variables that are not statistically significant are not included in the table. **indicates a significance of 95%, and ***of 99%. | |||||||||||||||||||
Class 1, which shows a preference for wines without environmental labels, includes consumers who report lower levels of responsibility attribution for the environmental impact of their choices. Class 2 is primarily composed of individuals under the age of 33 who typically spend less than €5 per bottle for everyday wine consumed at home. Class 3 is similarly defined by wine expenditure, but in the higher range – consumers who usually spend more than €5 per bottle. Lastly, Class 4, identified by the frequent selection of the no-choice option in the DCE, predominantly includes respondents who drink wine on a daily basis.
The results highlight how environmental labels in the wine sector are perceived in ways that vary markedly across consumers, reflecting different priorities, cognitive filters, and expectations. Class 1, representing a substantial share of the sample, actively rejects environmental labels: the negative and significant coefficients in the utility function indicate that the presence of a label reduces product appeal. This suggests that, for these consumers, environmental labels may be perceived not simply as irrelevant, but as a disruption to the perceived authenticity of the wine. This is particularly relevant in the wine sector, where conventional practices that often involve chemical inputs are culturally associated with sensory quality and artisanal expertise. As noted by Delmas and Lessem [20], environmental label can conflict with quality expectations when they are seen as departing from tradition. In this context, environmental messaging might be interpreted as a signal of lower quality or as an ideological intrusion [51]. Communication strategies targeting this segment may therefore benefit from avoiding polarising framings (e.g., conventional vs. sustainable) and instead seek to embed sustainability within familiar narratives, for example by presenting reduced pesticide use as a means of enhancing terroir expression and preserving traditional know-how [52].
Class 2 adopts a more pragmatic, issue-oriented perspective. These consumers, who are mostly younger and more price-sensitive, seem to evaluate environmental labels based on their perceived relevance to tangible issues, such as personal health or the protection of specific resources, rather than on broader ideological or abstract commitments. This may reflect the fact that younger generations have long been bombarded with sustainability-related messages, which could have contributed to a more pragmatic approach to such topics. It is possible that they view organic certification not as a response to a clearly defined environmental concern, but rather as a broad sustainability claim shaped by marketing language. Such evidence aligns with Schäufele and Hamm [23], who observe that younger consumers are not indifferent to sustainability, but need clear, targeted information to activate their interest and guide their choices. Similar results were obtained by Moscovici et al. [53]. This interpretation may also help explain why, in our results, organic certification was not particularly appreciated by this group: despite its environmental intentions, the label does not explicitly communicate specific benefits. As noted by Anagnostou and colleagues [54], the findings suggest that labels must clearly convey their specific environmental benefits to be valued by more pragmatic consumers. Communication strategies here should prioritise transparency, through direct and concise formats such as infographics or short claims, explicitly linking the label to specific benefits. Health-related concerns and the perceived relevance of water-related issues emerge as particularly effective drivers of interest in this group.
In contrast, Class 3 shows a clear preference for organic certification, which appears to be chosen primarily because it is considered trustworthy. While this preference seems to be driven by the perceived credibility of the label, our findings resonate with observations by Schäufele and Hamm [23], who suggest that, when consumers trust organic certification, it can also serve as a signal of quality. In this light, it is possible that, for this group, organic certification is seen not only as a marker of environmental responsibility but also as an indicator of overall product reliability or value. Communication strategies should therefore aim to reinforce this trust—by highlighting long-standing engagement with sustainability (e.g., “since 2010 we’ve worked to reduce our environmental impact”) and by integrating organic certification within a broader set of recognised quality cues. These might include official designations of origin or endorsements such as awards and scores from reputable wine guides, which can contribute to a coherent and trustworthy product profile.
Lastly, Class 4, composed of frequent wine consumers, shows a marked tendency to opt for the no-choice alternative. The negative and significant constant associated with this option suggests that the wines presented in the experiment, regardless of their environmental labels, often failed to meet the expectations of these consumers. This may indicate that frequent drinkers tend to rely on well-established preferences and are oriented toward wines they already know and feel confident choosing. Their decision-making appears to be driven by the pursuit of a wine that delivers a satisfying taste at a reasonable price, rather than by interest in new sustainability attributes. In this context, environmental labels do not actively influence preferences, not necessarily because of opposition, but because they are not salient in the evaluation process. This finding resonates with previous studies that identify frequent wine drinkers as less susceptible to environmental label influence, unless such labels are strongly associated with trusted brands or quality cues [20]. Communication efforts aiming to reach this segment might therefore benefit from showing how sustainability can contribute to maintaining product quality and price accessibility rather than positioning it as an added or separate value.
Overall, these findings confirm that environmental labels are not universally interpreted nor uniformly influential. Their impact depends on how well they resonate with consumers’ concrete concerns and decision-making logics, whether related to trust in the certification system, concerns about health, established consumption habits, or sensitivity to specific environmental issues. While some consumers appreciate environmental labels as a sign of credibility, others value them for addressing specific concerns such as pesticide use or water conservation, while others still disregard them altogether, seeing them as irrelevant or even at odds with their perception of what constitutes a “good wine”. This reinforces the idea, supported in recent literature, that sustainability in wine is not a simple binary attribute but interacts with the symbolic, emotional, and contextual layers of consumer experience [23]. Recognising these differences is essential to avoid reductive assumptions, such as expecting all consumers to respond similarly to the same label [54], and to develop communication strategies that are attuned to the diversity of decision criteria that shape wine consumption. Rather than assuming uniform sensitivity to sustainability, it becomes necessary to acknowledge that wine remains a deeply cultural and experiential product, where tradition, pleasure, routine and expectations coexist in complex ways [55].
This study investigated how different environmental labels – organic, carbon neutral, reduced water footprint, and reduced pesticide use – are perceived by wine consumers and how they influence purchase preferences. Using a discrete choice experiment combined with latent class analysis, we identified four distinct consumer segments, each characterised by different sensitivities to environmental labels.
The results reveal that environmental labels do not have a uniform effect across the sample. For a significant portion of consumers, environmental labels reduce the perceived utility of the product, suggesting a potential tension between sustainability messaging and traditional expectations in wine. Others evaluate labels based on their perceived relevance to specific concerns, such as pesticide exposure or water conservation, while another group places particular value on organic certification, appreciating it for its reliability. A final segment shows limited responsiveness to any of the proposed alternatives, as indicated by a significant tendency to opt for the no-choice option, a behaviour that likely reflects reliance on habitual choices and a lack of interest in unfamiliar cues.
These findings underline the importance of tailoring sustainability communication to different interpretive frameworks. Labels are not neutral signals, but are filtered through existing beliefs, priorities, and heuristics. Clear, differentiated, and context-sensitive communication is therefore essential not only to enhance label effectiveness, but also to avoid misunderstandings about what each label actually conveys.
For producers and policymakers, this suggests that the success of sustainability initiatives in the wine sector depends not only on improving environmental performance, but also on fostering more nuanced forms of engagement with consumers: acknowledging the plurality of motivations that shape wine choices, and the cultural and experiential nature of the product itself.
While the study offers relevant insights into how consumers interpret different environmental labels in the wine sector, some limitations also point to productive directions for future research. As with any stated preference method, the discrete choice experiment relies on a hypothetical setting. Future studies could explore how preferences observed here translate into actual purchasing behaviour. Moreover, the environmental labels tested were kept general by design, in order to reflect their current state of development and limited standardisation in the Italian market. Future work may investigate how consumer preferences vary when labels are framed with more detailed wording, design elements, or institutional endorsements. Finally, while our findings are grounded in the Italian context, they open avenues for cross-national comparisons aimed at understanding how cultural heritage interacts with sustainability perceptions in other wine-producing countries.
The authors wish to thank the Oenotrace project, funded by the Ministero dell’agricoltura, della sovranità alimentare e delle foreste under the ICT AGRIFOOD of ERA-NET programme.
[1] R. Buttinelli, R. Cortignani, G. Dono, 2021. Financial sustainability in Italian Organic Farms: An analysis of the FADN sample. Economia agro-alimentare: XXIII, 3, 2021, 1-32. https://doi.org/10.3280/ecag2021oa12766
[2] N. di Santo, I. Russo, R. Sisto, 2022. Climate change and natural resource scarcity: A literature review on dry farming. Land, 11(12), 2102. https://doi.org/10.3390/land11122102
[3] L. F. D. Lopes, D. J. C. da Silva, C. S. Teixeira, 2025. Innovation capacity of Brazilian wineries: an integrated approach using the fuzzy Delphi and random forest methods. Wine Economics and Policy. https://doi.org/10.36253/wep-16737
[4] T. Reinhardt, Y. Ambrogio, L. Springer, M. Tafel, 2024. Wine law, sustainable innovation and the emergence of a wine constitution. Wine Economics and Policy. https://doi.org/10.36253/wep-16041
[5] A. Zironi, P. Danese, P. Romano, R. Zironi, 2024. A Lean Six Sigma, Industry 4.0 and Circular Economy-driven methodology for wine supply chain process improvement. Wine Economics and Policy. https://doi.org/10.36253/wep-15803
[6] C. L. Beber, L. Lecomte, I. Rodrigo, M. Canali, A. S. Pinto, E. Pomarici, E. Giraud-Heraud, S. Pérès, G. Malorgio, 2023. The agroecological challenges in the wine sector: perceptions from European stakeholders. Wine Economics and Policy, 12(2), 103-120. https://doi.org/10.36253/wep-15244
[7] M.L. Longbottom, P.R. Petrie, 2015. Role of vineyard practices in generating and mitigating greenhouse gas emissions. Australian Journal of Grape and Wine Research. 21, 522–536. https://doi.org/10.1111/ajgw.12187
[8] D. Bentivoglio, G. Chiaraluce, A. Finco, 2024. Water stress as a critical issue for Mediterranean viti-culture: economic evidence from the Montepulciano d’Abruzzo PDO grape based on a case study in central Italy. Wine Economics and Policy, 13(1), 141-150. https://doi.org/10.36253/wep-15257
[9] L. Bavaresco, C. Squeri, 2022. Outlook on disease resistant grapevine varieties. BIO Web of Conferences. 44, 06001. https://doi.org/10.1051/bioconf/20224406001
[10] I. Pertot, T. Caffi, V. Rossi, L. Mugnai, C. Hoffmann, M. S. Grando et al., 2017. A critical review of plant protection tools for reducing pesticide use on grapevine and new perspectives for the implementation of IPM in viticulture. Crop Protection. 97, 70–84. https://doi.org/10.1016/j.cropro.2016.11.025
[11] E. Lamonaca, A. Seccia, F. G. Santeramo, 2023. Climate Cha (lle) nges in global wine production and trade patterns. Wine Economics and Policy, 12(2), 85-102. https://doi.org/10.36253/wep-13852
[12] S. Massaglia, T. Verduna, V. Varchetta, F. Brun, S. Blanc, S., 2023. The impact of alternative packaging on the life cycle of wine on tap. Wine Economics and Policy, 12(1), 51-62. https://doi.org/10.36253/wep-13016
[13] R. Buttinelli, R. Cortignani, F. Caracciolo, 2024. Irrigation water economic value and productivity: An econometric estimation for maize grain production in Italy. Agricultural Water Management, 295, 108757. https://doi.org/10.1016/j.agwat.2024.108757
[14] A. Muller, C. Schader, N. El-Hage Scialabba, J. Brüggemann, A. Isensee, K. H. Erb, P. Smith, P. Klocke, F. Leiber, M. Stolze, U. Niggli, 2017. Strategies for feeding the world more sustainably with organic agriculture. Nature Communications, 8(1), 1-13. https://doi.org/10.1038/s41467-017-00377-5.
[15] M. A. Delmas, O. Gergaud, 2021. Sustainable practices and product quality: Is there value in eco-label certification? The case of wine. Ecological Economics, 183, 107-114. https://doi.org/10.1016/j.ecolecon.2021.106955.
[16] T. P. Lyon, A. W. Montgomery, 2015. The means and end of greenwash. Organization & environment, 28(2), 223-249. https://doi.org/10.1177/108602661557533
[17] D. Brécard, 2014. Consumer confusion over the profusion of eco-labels: Lessons from a double differentiation model. Resource and energy economics, 37, 64-84. https://doi.org/10.1016/j.reseneeco.2013.10.002
[18] M. A. Delmas, O. Gergaud, J. Lim, 2016. Does organic wine taste better? An analysis of experts’ ratings. Journal of Wine Economics, 11(3), 329-354. https://doi.org/10.1017/jwe.2016.14
[19] M. G. Luchs, R. W. Naylor, J. R. Irwin, R. Raghunathan, 2010. The sustainability liability: Potential negative effects of ethicality on product preference. Journal of marketing, 74(5), 18-31. https://doi.org/10.1509/jmkg.74.5.018
[20] M. A. Delmas, N. Lessem, 2017. Eco-Premium or Eco-Penalty? Eco-Labels and Quality in the Organic Wine Market. Business & Society. 56(2), 318–356. https://doi.org/10.1177/0007650315576119
[21] E. Parga-Dans, R. Vecchio, A. Annunziata, P. A. González, R. O. Enríquez, 2023. A certification for natural wine? A comparative analysis of consumer drivers in Italy and Spain. Wine Economics and Policy, 12(1), 23-35. https://doi.org/10.36253/wep-12890
[22] G. Giannoccaro, D. Carlucci, R. Sardaro, 2019. Assessing consumer preferences for organic vs eco-labelled olive oils. Organic Agriculture. 9, 483–494. https://doi.org/10.1007/s13165-019-00245-7
[23] I. S. Schäufele, U. Hamm, 2017. Consumers’ perceptions, preferences and willingness-to-pay for wine with sustainability characteristics: A review. Journal of Cleaner Production, 147, 379-394. https://doi.org/10.1016/j.jclepro.2017.01.113.
[24] F. Solfanelli, S. Mandolesi, I. Silvestri, S. Naspetti, R. Zanoli, 2025. Debating wine health-warning labels using Q methodology. Wine Economics and Policy. https://doi.org/10.36253/wep-17056
[25] J.J. Czarnezki, 2011. The future of food eco-labeling: Organic, carbon footprint, and environmental life-cycle analysis. Stanford Environmental Law Journal. 30, 3. https://digitalcommons.pace.edu/lawfaculty/914/
[26] P. Tait, C. Saunders, P. Dalziel, P. Rutherford, T. Driver, M. Guenther, 2019. Estimating wine consumer preferences for sustainability attributes: A discrete choice experiment of Californian Sauvignon blanc purchasers. Journal of Cleaner Production, 233, 412-420. https://doi.org/10.1016/j.jclepro.2019.06.312.
[27] ISTAT (2024). Spese delle famiglie. Available at: https://www.istat.it/informazioni-sulla-rilevazione/spese/. Accessed on 08/04/2025.
[28] Il fatto alimentare (2024). Vini più bevuti dagli italiani: il prezzo come fattore determinante. Available at: https://ilfattoalimentare.it/vini-piu-bevuti-dagli-italiani-prezzo.html. Accessed on 08/04/2025.
[29] Y.K. Huang, M.A. Palma, J. Rangel, 2024. Can a Local Food Label Nudge Consumer Behavior? Implications of an Eye-tracking Study of Honey Products. Journal of Agricultural and Applied Economics. 1–19. https://doi.org/10.1017/aae.2024.2
[30] G. Piracci, T. Fantechi, L. Casini, 2024. Emerging trends in healthy and sustainable eating: The case of fresh convenience plant-based foods. Plant-Based Food Consumption, 83-103.
[31] Z. Pieniak, W. Verbeke, S. O. Olsen, K. B. Hansen, K. Brunsø, 2010. Health-related attitudes as a basis for segmenting European fish consumers. Food Policy, 35(5), 448-455. https://doi.org/10.1016/j.foodpol.2010.02.004.
[32] E. J. Van Loo, C. Hoefkens, W. Verbeke, 2017. Healthy, sustainable and plant-based eating: Perceived (mis) match and involvement-based consumer segments as targets for future policy. Food Policy, 69, 46-57. https://doi.org/10.1016/j.foodpol.2017.02.004.
[33] J. Joireman, M. J. Shaffer, D. Balliet, A. Strathman, 2012. Promotion orientation explains why future-oriented people exercise and eat healthy: Evidence from the two-factor consideration of future consequences-14 scale. Personality and Social Psychology Bulletin, 38(10), 1272-1287. https://doi.org/10.1177/01461672124493
[34] W. Abrahamse, L. Steg, 2011. Factors related to household energy use and intention to reduce it: The role of psychological and socio-demographic variables. Human Ecology Review. 18(1), 30–40. https://doi.org/http://www.jstor.org/stable/24707684.
[35] W. Abrahamse, L. Steg, R. Gifford, C. Vlek, 2009. Factors influencing car use for commuting and the intention to reduce it: A question of self-interest or morality? Transportation Research Part F: Traffic Psychology and Behaviour. 12(4), 317–324. https://doi.org/10.1016/j.trf.2009.04.004
[36] S.R. Jaeger, J.M. Rose, 2008. Stated choice experimentation, contextual influences and food choice: A case study. Food Quality and Preference. 19(6), 539–564. https://doi.org/10.1016/j.foodqual.2008.02.005
[37] F. Boncinelli, C. Contini, F. Gerini, C. Romano, G. Scozzafava, L. Casini, 2020. The role of context definition in choice experiments: A methodological proposal based on customized scenarios. Wine Economics and Policy. 9(2), 49–62. https://doi.org/10.36253/wep-7978
[38] E. Pabst, A. M. Corsi, R. Vecchio, A. Annunziata, S. M. Loose, 2021. Consumers’ reactions to nutrition and ingredient labelling for wine–A cross-country discrete choice experiment. Appetite, 156, 104843. https://doi.org/10.1016/j.appet.2020.104843.
[39] M. Corduas, L. Cinquanta, C. Ievoli, 2013. The importance of wine attributes for purchase decisions: A study of Italian consumers’ perception. Food Quality and Preference. 28(2), 407–418. https://doi.org/10.1016/j.foodqual.2012.11.008
[40] S.R. McCann, 2023. Certainty, wine and haematology. Bone Marrow Transplantation. 58(12), 1293–1295. https://doi.org/10.1038/s41409-023-01990-3
[41] V. A. Sottini, E. Barbierato, I. Bernetti, I. Capecchi, S. Fabbrizzi, S. Menghini, 2019. Winescape perception and big data analysis: An assessment through social media photographs in the Chianti Classico region. Wine Economics and Policy, 8(2), 127-140. https://doi.org/10.1016/j.wep.2019.09.003.
[42] M. C. J. Bliemer, J. M. Rose, 2011. Experimental design influences on stated choice outputs: an empirical study in air travel choice. Transportation Research Part A: Policy and Practice. 45(1), 63–79. https://doi.org/10.1016/j.tra.2010.09.003
[43] D. McFadden, 1972. Conditional logit analysis of qualitative choice behavior. In: P. Zarembka (Ed.), Frontiers in Econometrics. Academic Press, New York, 105–142.
[44] K.J. Lancaster, 1966. A new approach to consumer theory. Journal of Political Economy. 74(2), 132–157. https://doi.org/10.1086/259131
[45] K. E. Train, 2009. Discrete choice methods with simulation. Cambridge University Press.
[46] F. Caracciolo, M. Furno, M. D’Amico, G. Califano, G. Di Vita, 2022. Variety seeking behavior in the wine domain: A consumers segmentation using big data. Food Quality and Preference. 97, 104481. https://doi.org/10.1016/j.foodqual.2021.104481
[47] S. Hynes, N. Hanley, R. Scarpa, 2008. Effects on welfare measures of alternative means of accounting for preference heterogeneity in recreational demand models. American Journal of Agricultural Economics. 90(4), 1011–1027. https://doi.org/10.1111/j.1467-8276.2008.01148.x
[48] R. Scarpa, M. Thiene, T. Tempesta, 2007. Latent class count models of total visitation demand: days out hiking in the eastern Alps. Environmental and Resource Economics, 38, 447-460. https://doi.org/10.1007/s10640-007-9100-0.
[49] H. Andruff, N. Carraro, A. Thompson, P. Gaudreau, B. Louvet, 2009. Latent class growth modelling: a tutorial. Tutorials in Quantitative Methods for Psychology. 5(1), 11–24. https://doi.org/10.20982/tqmp.05.1.p011
[50] R. Scarpa, M. Thiene, 2005. Destination choice models for rock climbing in the Northeastern Alps: a latent-class approach based on intensity of preferences. Land Economics, 81(3), 426-444. https://doi.org/10.3368/le.81.3.426.
[51] M. Simeone, C. Russo, D. Scarpato, 2023. Price quality cues in organic wine market: is there a veblen effect?. Agronomy, 13(2), 405. https://doi.org/10.3390/agronomy13020405
[52] M. Wagner, P. Stanbury, T. Dietrich, J. Döring, J. Ewert, C. Foerster, M. Freund, M. Friedel, C. Kammann, M. Koch, T. Owtram, H. R. Schultz, K. Voss-Fels, J. Hanf, 2023. Developing a sustainability vision for the global wine industry. Sustainability, 15(13), 10487. https://doi.org/10.3390/su151310487
[53] D. Moscovici, J. Gow, L. Valenzuela, R. Rana, A. A. Ugaglia, R. Mihailescu, 2024. Assessing the age effect on consumer attitudes and willingness to pay for sustainably produced wine: A transnational analysis. Journal of Sustainability Research, 6(3), 1-18. https://doi.org/10.20900/jsr20240048
[54] E. Anagnostou, T. Tsiakis, I. Zervas, 2025. Highlighting Wine Labels: A Systematic Literature Review of Dominant Informational Parameters as Communicative Elements. Beverages, 11(1), 12. https://doi.org/10.3390/beverages11010012
[55] A. Dias, B. Sousa, V. Santos, P. Ramos, A. Madeira, 2023. Wine tourism and sustainability awareness: A consumer behavior perspective. Sustainability, 15(6), 5182. https://doi.org/10.3390/su15065182