Data Irregularities in Wine Sector Statistics: A Benford’s Law Approach to the Portuguese Case
1 Wroclaw University of Economics and Business, Komandorska 118/120, 53-345 Wroclaw, Poland
2 Ambis University, Lindnerova 575/1, 180 00 Praha 8 – Libeň, Czech Republic
Email: piotr.luty@ue.wroc.pl; hana.bohusova@ambis.cz
*Corresponding author
Abstract. The wine industry plays an important role in many national economies, it combines agricultural production with cultural heritage and global trade. In Portugal, it contributes significantly to economic value, regional identity, and rural sustainability. As international wine markets become increasingly complex, the information from financial and production data is essential for regulation, policymaking, and economic analysis. Despite the growing emphasis on viticulture and market dynamics, the wine sector data anomalies have attracted only limited attention so far. This study introduces Benford’s Law – a statistical method used to detect irregularities in naturally occurring datasets. Applying first- and second-digit Benford’s Law tests to Portuguese wine industry data from 2014 to 2023, which includes company-level financial statements and wine production figures, the analysis reveals data irregularities. Nonconformity between empirical data and theoretical expectations refers to wine must production data and profit before tax. The irregularities must be explained in a further and more detailed survey. The study offers a novel application of Benford’s Law in the wine sector.
Keywords: Benford’s Law, wine production, reporting.
Index
2.2 Quality data measures – Benford‘s law in real-world applications
2.3 Quality data measures – Benford‘s law in agricultural data
2.4 Research gap and contribution
3. Methodology, research sample
4. Research results and discussion
The wine industry plays a central role in many national economies, combining agricultural production with cultural heritage, regional identity, and participation in global trade. In Portugal, where viticulture is deeply embedded in rural structures and economic activity, the availability of reliable financial and production data is essential for informed policymaking, regulatory oversight, and sectoral analysis. As wine markets become increasingly globalised and complex, the accuracy of reported figures – both at the firm level and in official production statistics – assumes strategic importance for tax administration, subsidy allocation, and market monitoring.
Although a substantial body of research has examined viticulture, oenology, climate impacts, and market behaviour, relatively little attention has been devoted to the quality and reliability of the numerical data underpinning these analyses. It contrasts with other empirical fields, where data integrity assessment has become a standard component of validation. Benford’s Law, which describes the expected logarithmic distribution of digits in many naturally occurring datasets, has been widely applied in areas such as forensic accounting, macroeconomic reporting, environmental monitoring, and financial market analysis to detect irregularities or patterns warranting further investigation [1, 2]. Its usefulness lies in its domain-independence and sensitivity to reporting errors, structural anomalies, and potential manipulation in large numerical datasets.
Given the wine sector’s reliance on both firm-level accounting data and officially reported production statistics, it represents a particularly relevant yet largely unexplored context for applying Benford’s Law. Existing empirical studies have focused mainly on macro-level agricultural aggregates or individual commodity markets, leaving open the question of whether digit distributions remain consistent across different types of wine-sector data and whether deviations may signal issues in reporting practices.
This study addresses this gap by examining the conformity of Portuguese wine-sector data with Benford’s expected digit distributions. Using first- and second-digit tests evaluated through Mean Absolute Deviation (MAD) and the Kolmogorov–Smirnov (K–S) test and Chi-square test, the analysis covers company-level financial statements and official wine must production statistics for the period from 2014 to 2023. Rather than treating conformity as proof of data accuracy or deviations as evidence of manipulation, the study adopts a conservative perspective, using Benford-based diagnostics as indicators of potential irregularities that may merit closer scrutiny.
By integrating two distinct data sources within a single analytical framework, this research contributes to the literature on wine economics and agribusiness by introducing a systematic approach to assessing data quality. It provides empirical evidence on the consistency of reported figures in an economically significant and heavily regulated sector, highlighting the potential of Benford’s Law as a complementary tool for enhancing transparency and confidence in sectoral data used for economic, regulatory, and scientific analyses.
The paper is structured as follows. Section 2 reviews the relevant literature and outlines the theoretical background and research gap. Section 3 describes the methodology and research sample. Section 4 presents and discusses the results, and Section 5 concludes the study.
Research on the quantity of wine grapes and wine production provides fundamental insights into the functioning, efficiency, and resilience of the wine industry. Studies in this area address diverse issues such as yield optimisation, the economic implications of viticulture, tax policy, climate change, and market behaviour. The majority of research focuses on viticultural and oenological determinants of production volumes [3, 4], while relatively few studies investigate the economic and regulatory consequences of these patterns [5–7].
Among the studies addressing these interrelated factors, Anderson et al. [8] provide a comprehensive analysis of global wine production dynamics. They showed that climatic variability, technological progress, and economic cycles jointly determine production outcomes. Their findings highlight a general stabilisation of output in traditional European regions and faster growth in emerging markets such as South America and Asia. These observations support the notion that stable production promotes predictable market behaviour and aids in policy design.
Earlier work by Jones et al. [4] identified several critical factors affecting production, including vineyard management practices, technological innovation, and, in particular, climate change. Their study demonstrated how rising temperatures have led to shifts in vineyard locations and the adoption of adaptive techniques to maintain both yield and quality. More recently, Del Rey and Loose [9] explored the economic implications of global wine production trends, noting that fluctuations in production volumes have a pronounced effect on price volatility and trade flows.
While environmental and technological factors remain crucial determinants of production, a growing body of research highlights the influence of economic and institutional conditions on the performance and stability of the wine sector. Taxation policies also play an essential role in shaping production decisions and market competitiveness. Anderson and Pinilla [8] and Katunar et al. [10] examined how fiscal regulations influence production incentives, emphasising that well-structured and transparent data are indispensable for designing equitable tax systems. Behmiri et al. [5] further linked macroeconomic conditions – GDP growth, exchange rates, and agricultural policy – to production trends across the European Union. In parallel, Rickard et al. [6] investigated the effects of trade liberalisation on the EU and US wine markets, illustrating how the interaction between international trade agreements and domestic regulations affects production stability.
Together, fiscal, macroeconomic, and trade factors define the context in which wine producers operate, although environmental conditions continue to play a decisive role in shaping production outcomes. Finally, Ashenfelter and Storchmann [3] discussed the economic implications of climate change, demonstrating how variations in temperature and precipitation influence grape yields, wine quality, and production costs.
Overall, these studies highlight the complex interplay of environmental, technological, and economic factors that determine wine production patterns. Understanding these interactions relies heavily on the availability of accurate and transparent production data. Yet, despite its importance, the usefulness of such data has rarely been evaluated systematically. To address this gap, statistical tools capable of identifying irregularities in numerical data can be applied, among which Benford’s Law has proven particularly useful.
2.2 Quality data measures – Benford‘s law in real-world applications
Benford‘s Law describes the expected frequency of digits in naturally occurring numerical datasets. Rather than following a uniform distribution, the first digit in many datasets is disproportionately likely to be small – most commonly „1“ – with probabilities decreasing logarithmically for higher digits [11]. This statistical regularity arises in datasets that span several orders of magnitude and result from multiplicative or exponential processes.
Initially discovered in the natural sciences, this method has found widespread application in economics, finance, and environmental monitoring. For example, various geophysical datasets such as measurements of the Earth‘s geomagnetic field, earthquake depths, and seismic velocities have been shown to conform closely to Benford‘s distribution [1]. In economics, the method has become a cornerstone of forensic accounting, where it helps detect potential manipulation or fraud in financial statements [2,12]. Auditors routinely use Benford-based analyses of assets, liabilities, and revenues to identify anomalies that warrant further investigation [13,14].
Benford‘s Law has also been applied in emerging areas such as cryptocurrency analysis, where it helps identify suspicious transaction patterns [14]. In macroeconomics, it has been used to evaluate the plausibility of reported figures – such as GDP, inflation, and fiscal data – submitted by national governments to Eurostat, revealing significant irregularities in Greece‘s statistics [12]. Likewise, it has served as a diagnostic tool for validating self-reported water-use data in the United States [15] and detecting anomalies in ecotoxicity datasets [1].
The versatility of Benford‘s Law lies in its simplicity and universality. Because it does not require prior assumptions about the data structure, it can be applied across disciplines to reveal inconsistencies that might otherwise remain unnoticed. Given its proven effectiveness in auditing and environmental monitoring, the method is well-suited to the validation of agricultural and production datasets, where manual reporting and aggregation often introduce potential errors. Despite its wide application, empirical research using Benford‘s Law in agriculture and the wine industry remains scarce: according to Web of Science database data, more than two hundred studies address its role in fraud detection and only a limited number focus on agricultural data (twelve studies such as Hanci [16], Suzuki et al. [17], Novovic et al. [18]) whereas only two refer to the wine sector [7,19].
2.3 Quality data measures – Benford‘s law in agricultural data
Benford‘s Law has increasingly been recognised as a valuable instrument for assessing the quality of numerical data in agriculture. As a statistical regularity describing the distribution of digits, it provides a straightforward yet powerful means of detecting irregularities and improving the quality of agricultural datasets.
Several empirical studies have explored its application in agricultural and related contexts. In the Philippines, Parreño [20] applied Benford‘s Law to crop production data – covering six major commodities, including bananas – using both Chi-squared and Mean Absolute Deviation (MAD) tests. The results confirmed that Benford‘s Law is applicable for evaluating data integrity and identifying inconsistencies in national agricultural statistics.
A detailed investigation by Hanci [16] extended this approach to official production data in Sri Lanka, encompassing multiple crop categories across several years. Employing first- and second-digit conformity tests, Hanci found that most datasets closely followed Benford‘s expected pattern, suggesting a generally reliable reporting system. However, moderate deviations in some manually reported crops indicated localised inconsistencies. Importantly, Hanci emphasised the preventive role of Benford‘s Law, arguing that its use could strengthen national data collection and monitoring practices.
Complementing these findings, a large-scale study conducted in China applied Benford‘s Law to agricultural and precipitation datasets spanning the period from 1951 to 2015. The analysis revealed a high degree of conformity between actual and expected digit distributions, confirming both internal consistency and robustness in long-term agricultural data [21]. Minor deviations were attributed mainly to transcription errors and incomplete time series, again demonstrating the method‘s diagnostic potential.
Beyond crop statistics, Benford‘s Law has also been successfully applied to fisheries and commodity markets. Noleto-Filho et al. [15] evaluated small-scale fisheries data in Brazil, discovering localised deviations caused by manual reporting, while Domínguez-Bustos et al. [22] used the method to detect structural shifts in tuna catch data following the introduction of total allowable catch (TAC) regulations. Similarly, Martínez-Sánchez [23] analysed Spanish almond prices, noting weaker conformity in first-digit tests but stronger alignment in second- and third-digit analyses. This outcome was attributed to the moderate variability of price data. This observation may also hold for the wine sector, where regional and quality constraints bound prices and production volumes.
Collectively, these studies demonstrate the adaptability and robustness of Benford‘s Law as a tool for assessing data irregularities in agriculture. However, most research has concentrated on single data sources or aggregate statistics, leaving open questions regarding the consistency between official datasets and firm-level financial data. This gap is particularly relevant for specialised branches of agriculture such as the wine industry, where both production statistics and firm-level accounting data are systematically collected and reported.
2.4 Research gap and contribution
While Benford‘s Law has been widely employed to assess the usefulness of data in various economic and agricultural contexts, its potential application within the wine industry has received little attention. This study, therefore, addresses that gap by examining whether the Law‘s expected digit patterns hold for both official production data and firm-level financial statements. Existing studies have focused on macro-level agricultural statistics, such as crop yields, production volumes, and fisheries data, confirming that Benford‘s distribution can serve as a valuable indicator of data integrity. However, no prior research has examined whether the same principles apply to a wine production sector that simultaneously produces official agricultural statistics and firm-level financial data.
The wine sector provides a particularly suitable context for such analysis. It combines highly regulated production environments with heterogeneous firm structures, varying from small family-owned vineyards to large-scale cooperatives. Moreover, the coexistence of official production records and independently reported accounting data raises questions about the consistency of information across reporting levels. Understanding whether these datasets conform to Benford‘s distribution provides valuable insight into data irregularities, which is crucial for both data quality and the effectiveness of institutional reporting frameworks in agribusiness.
This study aims to address this research gap by developing a dual-source Benford framework for Portuguese viticulture. The contribution is threefold:
1. It establishes theoretical and practical criteria for selecting between first- and second-digit tests based on the numerical dispersion and aggregation levels typical of viticultural data.
2. It applies Benford analysis simultaneously to official production statistics and company-level accounting data, assessing both internal validity and cross-source consistency.
3. It interprets deviations in light of the institutional and regulatory context of the Portuguese wine industry, where market concentration, climate variability, and reporting obligations may influence numerical regularities.
The following section outlines the methodological framework used to test the conformity of Portuguese wine sector data with Benford‘s Law. It specifies the datasets examined, the structure of the Benford tests applied (first- and second-digit), and the criteria for evaluating conformity through statistical indicators such as the Chi-squared (Chi-2) test, the Kolmogorov-Smirnov (K-S) test, and the Mean Absolute Deviation (MAD) test.
3. Methodology, research sample
The study draws on two primary data sources: the BvD Orbis database, which provides financial information for companies in the wine sector, and the Statistics Portugal (ine.pt) database, which provides data on wine production.
The criteria for selecting financial data from the BvD Orbis database were as follows:
1. Status – active companies
2. Country – Portugal
3. Sector activity NACE Rev. 2 - 1102 - Manufacture of wine from grapes
In total, BvD Orbis gives 1366 companies that match our search criteria. In the next step, the dataset was manually refined, and cases with missing or incomplete data were excluded from the analysis. The study period covers 10 years, from 2014 to 2023. The choice of the final year (2023) reflects the availability of the most recently published financial statements.
The selected variables from companies‘ financial statements relate to wine production activities. The first variable is sales revenues (turnover), i.e., the value of economic benefits companies realise when selling wine. The pre-tax financial result is the second variable used to measure the business‘s effectiveness. The choice of this pre-tax variable is related to the elimination of tax optimisation used by companies and the possibility of tax management. In terms of income, profit before tax and loss before tax are separately calculated. The separate analysis is consistent with the assumption that there might be different irregularities for losses and profits.
The variables related to the companies‘ resources are total assets and inventories. Total assets represent the company‘s total resources, whereas stock refers to inventories (e.g., materials, work-in-progress, finished products). Wine producers‘ inventories disclose the value of current assets at all stages of wine production, from the must to bottled wine, which is ready for sale (from the extraction of the must to the final finished product). The variables from financial statements for Benford‘s Law tests used in the survey follow the literature review considerations. Ausloos et al. [24] analysed pre-taxation data (pre-tax income, separately for profit and loss) and total assets. Nigrini [2] justifies the separate analysis of positive and negative numbers, as there may be different causes for profit and loss manipulation. Revenues are also frequently used for Benford‘s law irregularity analysis [25–27].
Data from the Statistics Portugal database (INE) were subject to the following selection:
1. Source - Statistics Portugal, Vegetable production statistics
2. Name of the table - Wine production declared in grape must (hl) by producers by Vinification location (NUTS - 2013) and quality and colour of wine (New regulation) - annual
3. Measure unit (symbol) - Hectolitre (hl)
The data included the locations of wine producers where they produce must through the vinification process. The database lists 308 official geographical areas of Portugal (municipales) where information on the grape must produced was collected. The data collected is the same as the available financial data of companies in the wine production sector (2014–2023).
The irregularities in financial and non-financial data that occurred will be assessed using Benford’s Law. This Law is not limited to specific phenomena and units of measurement. It is a universal concept that refers to analysing the distributions of digits occurring in measures of various natural, financial, and non-financial phenomena. The frequency of occurrence of specific digits in a given place in a number can be described by the logarithmic formula proposed by Benford. We calculate the Benford distribution as follows [2]:
Where:
d – number of digits
Based on the calculation formula for the Benford distribution, you can obtain information about the frequency of digits in the number in the first place from the left for the first-digit test. Figure 1 shows the Benford distribution for the first digit.
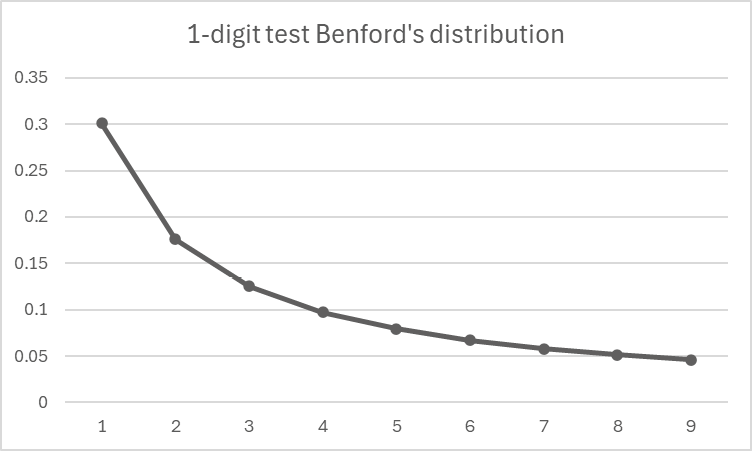
Based on Figure 1, it can be observed that the digit 1 appears most frequently (30%) as the leading digit in the data representing the analysed phenomenon, while the digit 9 appears the least often (4%). Discrepancies between the actual digit distribution, such as assets or revenues, and the expected Benford distribution may suggest the presence of anomalies that warrant further investigation. These irregularities might stem from data manipulation, for instance, due to rounding practices employed by companies when reporting financial information or errors in data collection. Additionally, anomalies could result from the construction of the research sample, such as restricting companies based on the size of a specific variable. In such cases, analysing the second-digit distribution may provide further insight.
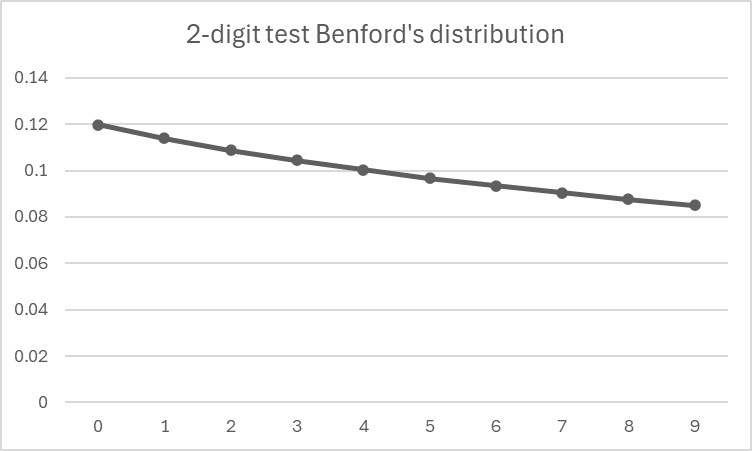
The first-digit test examines the frequency distribution of digits ranging from 1 to 9, whereas the second-digit test analyses digits from 0 to 9. The second-digit test is particularly useful for identifying underlying irregularities or inconsistencies within the data. [16].
The study of deviations between the empirical (for each variable) and theoretical (Benford) distributions can be measured using the Kolmogorov-Smirnov, Chi-squared, and Mean Absolute Deviation (MAD) test [1,2,20,28]. The conformity with Benford’s Law is tested by Isaković-Kaplan, Demirović, and Proho [25] or Adahali and Hall [29], who used all three approaches. MAD is also used by Půček, Plaček, Ochrana [30] or Van Caneghem [31]. The previous application of the Chi-squared test for this purpose can be found in the research of González [32], Cella and Zanolla [33], or Geyer and Drechsler [34]. Aggarwal, Dharni [35] and Badal-Valero, Alvarez-Jareňo, Pavía [36] have already used the Kolmogorov-Smirnov test for this kind of comparison. The K-S test applies to the study of the fit of distributions for smaller research samples [37]. Carno [38] analysed the conformity of empirical data (pandemic-related data) with Benford’s distribution through a literature review and found that the most frequently used conformity tests were the Chi-square test (21 out of 26 studies), the Mean Absolute Deviation (MAD) test (11 out of 26), and the Kolmogorov–Smirnov test (9 out of 26). Moreover, seven studies used both Chi-square and K–S tests, eight used Chi-square and MAD, and four employed all three methods simultaneously.
Figueiredo and Silva [39] utilised multiple conformity tests, including the Chi-squared, K–S, and MAD tests. They observed that as the sample size increases, statistical tests tend to become more sensitive, raising the likelihood of detecting smaller deviations. It has been noted that the Chi-squared test is particularly sensitive to sample size [40]. However, the excessive statistical power typically becomes noticeable only for datasets exceeding 5,000 records [2]. In our research, the variables: profit before tax, loss before tax and wine production, all consist of fewer than 5,000 observations, thereby mitigating this concern (Tables 2, 3 and 4). The other variables, revenues, assets, and stock, exceeded 5,000 observations. In the study, the conformity of distributions (both empirical and theoretical) is measured using the Chi-2 test, K-S test and MAD [41].
MAD provides a more robust measure of conformity with Benford’s Law than other statistical measures. It can handle outliers, detect minor deviations, and is based on a strong statistical foundation [2, 42, 43]. In this study, MAD:
where:
m(X) – average data value;
n – number of data values;
xi – data values in the set.
Depending on the level of MAD, it can be considered a close conformity, an acceptable conformity, a marginally acceptable conformity, or a nonconformity. The ranges for MAD are presented in Table 1. MAD does not test the hypothesis of whether two samples originate from the same or different distributions. MAD provides the level of conformity.
| Digit | Range | Conclusion | |||||||||||||||||
|---|---|---|---|---|---|---|---|---|---|---|---|---|---|---|---|---|---|---|---|
| First-digit | 0,000–0,006 | close conformity | |||||||||||||||||
| 0,006–0,012 | acceptable conformity | ||||||||||||||||||
| 0,012–0,015 | marginally acceptable conformity | ||||||||||||||||||
| above 0,015 | Nonconformity | ||||||||||||||||||
| Second-digit | 0,000–0,008 | close conformity | |||||||||||||||||
| 0,008–0,010 | acceptable conformity | ||||||||||||||||||
| 0,010–0,012 | marginally acceptable conformity | ||||||||||||||||||
| above 0,012 | Nonconformity | ||||||||||||||||||
| Source: based on Nigrini [2]. | |||||||||||||||||||
Measuring the fit of MAD distributions is commonly used to determine the conformity of an empirical distribution with the Benford distribution [44,45]. The rejection threshold for distribution conformity is 0.015 for the first-digit test. For the second-digit test, the nonconformity threshold is 0.012.
The Kolmogorov–Smirnov test, in contrast, is a nonparametric statistic based on the empirical distribution function [2,25]. It is used to determine whether a random sample originates from a specified continuous distribution.
Kolmogorov-Smirnov test (K-S)
where:
– empirical distribution function of the first sample
– empirical distribution function of the second sample
Two distribution functions are compared using the following test criterion:
where:
n1 - number of observations of the first sample;
n2 - number of observations of the second sample;
Kα - test criterion at level α.
The tested hypotheses are:
H0: Two univariate random variables come from the same probability distribution.
H1: Two univariate random variables do not come from the same probability distribution.
The Chi-square test (Chi-2) is a nonparametric statistical method used to determine whether an observed frequency distribution differs significantly from an expected theoretical distribution [2]. It is commonly applied to categorical data to assess how well the observed data fit a specified model.
Chi-square test ( )
where:
n – total number of phenotypic classes;
e – experimental frequency of the i-th class;
t – theoretical frequency of the i-th class.
The tested hypotheses are:
H0: The observed frequency distribution is consistent with the theoretical distribution.
H1: The observed frequency distribution is not consistent with the theoretical distribution.
Carno [38] reported that at least one of the conformity tests indicated nonconformity even when other tests did not. Consequently, the assumption applied in our research is that if at least one of the applied tests (Chi-2, K-S or MAD) indicates nonconformity between empirical and theoretical distributions, this may serve as evidence of potential anomalies.
The analysis and statistical evaluation were processed using MS Excel for extracting digits and the MAD test, and Statistica 13.3 for the Chi-2 test and the KS test.
4. Research results and discussion
Upon examining the financial data of companies from the wine production sector, a subset of companies met the criteria described in the methodological section. The mere indication of a company belonging to the NACE 1102 sector in Portugal does not mean that the BvD Orbis database will include figures on financial results and company resources. The first-digit test requires the first digit of the values of the relevant variables in the study to be analysed between 1 and 9. Table 2 presents the final research sample, excluding companies with missing financial data from the database and those with variables of 0.
| Variable | No. Obs. | Chi-2 | Decision | K-S test | Decision | MAD | Decision | ||||||||||||
|---|---|---|---|---|---|---|---|---|---|---|---|---|---|---|---|---|---|---|---|
| Revenues | 6766 | 12.061 | conformity | 0.500 | conformity | 0.004 | close | ||||||||||||
| p-value | p = 0.149 | p > 0.05 | conformity | ||||||||||||||||
| Assets | 7503 | 9.924 | conformity | 0.797 | conformity | 0.003 | close | ||||||||||||
| p-value | p = 0.270 | p > 0.05 | conformity | ||||||||||||||||
| Profit before tax | 4345 | 18.967 | nonconformity | 1.469 | nonconformity | 0.007 | acceptable | ||||||||||||
| p-value | p = 0.015 | p < 0.05 | conformity | ||||||||||||||||
| Loss before tax | 2506 | 14.945 | conformity | 1.135 | conformity | 0.008 | acceptable | ||||||||||||
| p-value | p = 0.060 | p > 0.05 | conformity | ||||||||||||||||
| Stock | 6098 | 7.128 | conformity | 0.485 | conformity | 0.003 | close | ||||||||||||
| p-value | p = 0.523 | p > 0.05 | conformity | ||||||||||||||||
| Df = 8, at 5%, critical value Chi-2 (8) = 15.507; critical value K-S test = 1.36. | |||||||||||||||||||
| Source: Authors’ calculation. | |||||||||||||||||||
The second-digit test requires seeing which variables have values greater than 10. It is a condition for the second digit in the number. Therefore, only those companies that reported data for individual variables were selected from the database: stock, total assets, operating revenue, or profit before tax with a value of at least 10. Table 3 shows the number of observations for each variable.
| Variable | No. Obs | Chi-2 | Decision | K-S test | Decision | MAD | Decision | ||||||||||||
|---|---|---|---|---|---|---|---|---|---|---|---|---|---|---|---|---|---|---|---|
| Revenues | 6321 | 9.746 | conformity | 0.532 | conformity | 0.003 | close | ||||||||||||
| p-value | p = 0.371 | p > 0.05 | conformity | ||||||||||||||||
| Assets | 7190 | 12.310 | conformity | 0.471 | conformity | 0.003 | close | ||||||||||||
| p = 0.196 | p > 0.05 | conformity | |||||||||||||||||
| Profit before tax | 3114 | 7.799 | conformity | 0.512 | conformity | 0.004 | acceptable | ||||||||||||
| p = 0.554 | p > 0.05 | conformity | |||||||||||||||||
| Loss before tax | 1768 | 8.418 | conformity | 0.589 | conformity | 0.007 | acceptable | ||||||||||||
| p = 0.493 | p > 0.05 | conformity | |||||||||||||||||
| Stock | 5561 | 6.433 | conformity | 0.447 | conformity | 0.003 | close | ||||||||||||
| p = 0.696 | p > 0.05 | conformity | |||||||||||||||||
| Df = 9, at 5%, critical value Chi-2 (9) = 16.919, critical value K-S test = 1.36. | |||||||||||||||||||
| Source: Authors’ calculation. | |||||||||||||||||||
Figure 3 illustrates the first- and second-digit tests for data from the financial statements of companies in the Portuguese wine industry. It can be observed that the digits in the first and second positions of operating revenue, total assets, profit before tax, loss before tax, and inventories conform to the theoretical values implied by Benford’s Law.
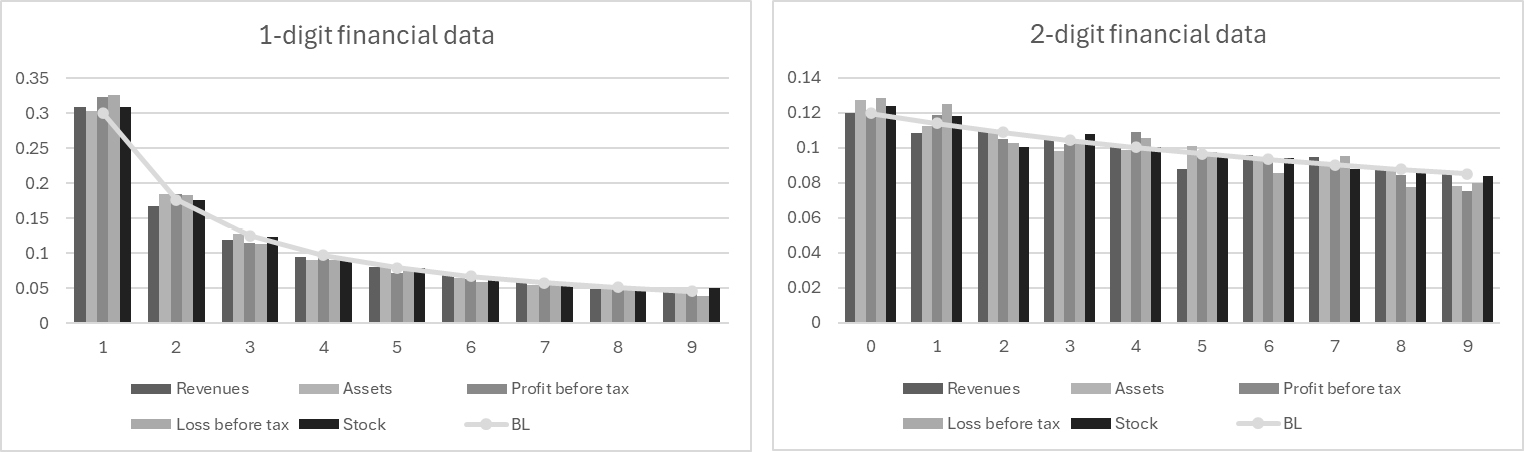
Table 2 presents the results of three goodness-of-fit tests for financial variables: revenues, assets, profit before tax, loss before tax, and stock. It can be noted that for the profit before tax variable, two tests indicated acceptance of the alternative hypothesis: chi-square (the observed frequencies differ from the expected frequencies) and K-S (the sample does not follow the specified distribution). The lack of consistency between the distributions demonstrated by the chi-square and K-S tests may suggest anomalies in determining profit before tax. A closer examination of profit formation in Portuguese wine sector companies would enable an assessment of the potential scale of earnings management practices in these companies.
For the remaining variables: revenues, assets, loss before tax, and stock, the results of the first-digit test using the chi-square and K-S goodness-of-fit measures indicate no basis for rejecting the null hypothesis that the observed counts for digits 1 to 9 do not differ from the expected counts based on the Benford distribution. The MAD measure additionally introduces a range of fit, and for all these variables, the range of fit is either close conformity or acceptable conformity.
Table 3 presents the results for the second-digit test. All goodness-of-fit tests indicate goodness-of-fit distributions or no basis for rejecting the hypothesis that there is no difference in observed and expected numbers. For the second-digit test, the analysis ranged from digits 0 to 9.
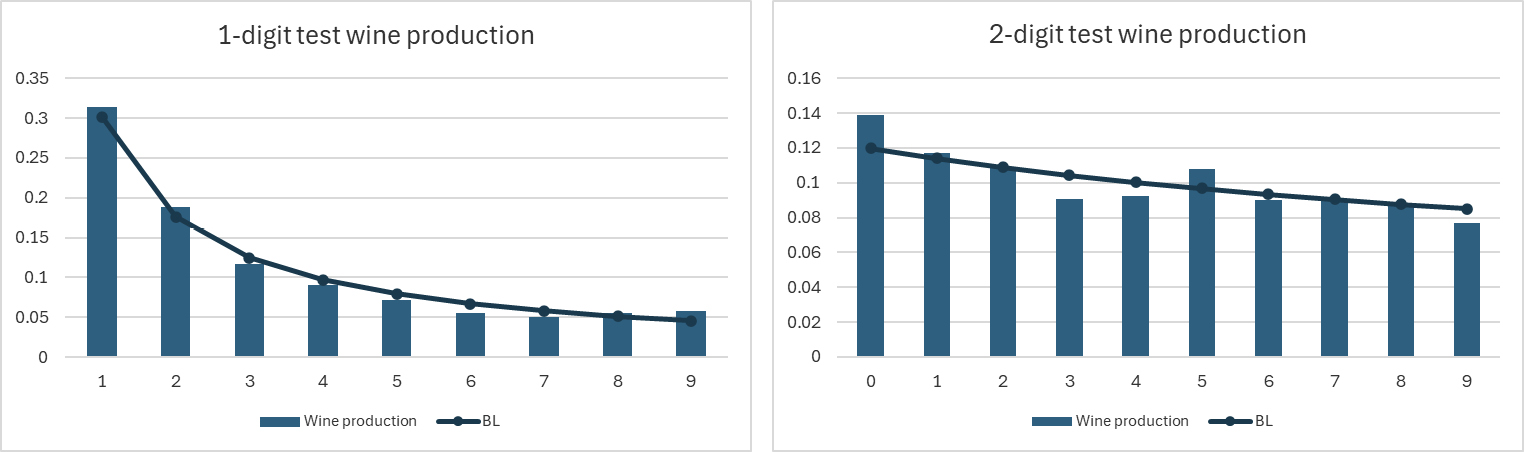
The next step in the study is to verify the statistical data on wine must production in Portugal. The study examined anomalies in the distribution of the amount of wine must produced in 308 regions of Portugal between 2014 and 2023 using the first- and second-digit tests. The data collectively refer to the production of must from white and red grapes and various appellations: Generous wine by protected designation of origin, wine by protected designation of origin, wine by protected geographical indication, wine with grape variety indication, and wine without certification.
Table 4 presents the results of the first and second digit tests for the grape must production variable. The chi-square goodness-of-fit test supported the alternative hypothesis that the empirical and theoretical observation counts were significantly different for both the first and second digit tests. Although the remaining K-S and MAD goodness-of-fit tests did not reveal any discrepancies in the distributions, the chi-square test indicates irregularities that require further investigation.
| Variable | No. | Chi-2 | Decision | K-S test | Decision | MAD | Decision | ||||||||||||
|---|---|---|---|---|---|---|---|---|---|---|---|---|---|---|---|---|---|---|---|
| 1-digit test wine production | 2349 | 22.859 | nonconformity | 0.835 | conformity | 0.009 | acceptable | ||||||||||||
| p = 0.004 | p > 0.05 | conformity | |||||||||||||||||
| 2-digit test wine production | 2281 | 17.815 | nonconformity | 0.758 | conformity | 0.007 | close | ||||||||||||
| p = 0.037 | p > 0.05 | conformity | |||||||||||||||||
| Df = 8, at 5%, critical value Chi-2 (8) = 15.507; critical value K-S test = 1.36. | |||||||||||||||||||
| Df = 9, at 5%, critical value Chi-2 (9) = 16.919, critical value K-S test = 1.36. | |||||||||||||||||||
| Source: Authors’ calculation. | |||||||||||||||||||
Based on the results of the first-digit and second-digit tests (Table 4) for grape must production, it can be seen that the chi-square test indicates a lack of basis for accepting the null hypothesis of equality between the empirical and theoretical digit distributions. The lack of conformity between the distributions, as indicated by the chi-square test, may result from difficulties in obtaining this data by statistical offices [16]. Possible causes of nonconformity of distributions may include data entry errors or misinterpretation during data collection, as well as inconsistencies in data processing methods [20].
This study examined the application of Benford‘s Law to identify irregularities in financial and production data within the Portuguese wine industry. By examining company-level financial variables – such as operating revenues, total assets, profit before tax, loss before tax, and inventories – alongside official statistics on wine must production across 308 regions, the research provides a robust evaluation of data integrity over ten years (2014–2023). The first- and second-digit test results demonstrate strong conformity with Benford‘s expected digit distributions, with Mean Absolute Deviation (MAD) values falling within the ranges of close or acceptable conformity. To confirm the consistency of the distributions, the study employed the Chi-squared and the K-S tests in addition to the MAD. The Chi-2 and K-S test results indicate a lack of consistency in one case of the financial variable (profit before tax) and in the wine production variable (wine must production).
These findings hold important implications. First, they validate the use of financial and statistical data in subsequent economic modelling, sectoral studies, and policy assessments in viticulture. Second, they demonstrate the applicability of Benford‘s Law in the wine production sector, providing a replicable methodology for auditing financial and non-financial data. Parreño [20] revealed significant deviations from the expected Benford distribution, indicating potential issues with data accuracy, collection methods, or reporting irregularities. These deviations highlight the importance of data validation in wine production statistics. The problem of obtaining precise data in the agriculture sector was highlighted by Hanci [16]. Our findings revealed that some irregularities were detected in the Portuguese wine sector, as indicated in data collected by the statistical office.
The causes of irregularities may differ between companies that report profits and those that report losses. A discrepancy in the distribution of pre-tax profits may suggest actions related to corporate earnings management. The literature offers explanations for the detected irregularities in financial figures, including rounding errors [34,46,47], fraud detection [2,11], and adjustments to comply with legal regulations [48,49]. Revealed in the survey, nonconformity in reported profit before tax indicates the threat of earnings management and financial figure manipulation [2,50]. The findings revealed the need to assess earnings management in the wine production sector and identify the reasons for nonconformity. These actions prompt further research to conduct a first two-digit test to select companies whose first-digit pre-tax profits had the most significant deviations.
Moreover, the results of this study may inform the work of public institutions and regulatory bodies, particularly in areas such as tax compliance, subsidy allocation, and agricultural monitoring. By ensuring that datasets are reliable, authorities can base their decisions on solid evidence. In the private sector, wineries and investors may employ similar analytical approaches to audit internal data, enhance transparency, and mitigate the risk of reporting errors or fraud.
However, the study has certain limitations. Benford‘s Law can identify anomalies, but does not reveal the specific causes of irregularities. Additionally, the data may be affected by limitations in availability or representativeness, particularly for smaller producers. Future research could expand its scope to other wine-producing countries or examine trends in data quality over time.
[1] P. de Vries and A.J. Murk, “Compliance of LC50 and NOEC data with Benford’s Law: An indication of reliability?,” Ecotoxicology and Environmental Safety, vol. 98, pp. 171–178, 2013, https://doi.org/10.1016/j.ecoenv.2013.09.002.
[2] M.J. Nigrini, Benford’s law: Applications for forensic accounting, auditing, and fraud detection. 2012. https://doi.org/10.1002/9781119203094.
[3] O. Ashenfelter and K. Storchmann, “Climate Change and Wine: A Review of the Economic Implications,” Journal of Wine Economics, vol. 11, no. 1, pp. 105–138, 2016, https://doi.org/10.1017/jwe.2016.5.
[4] G.V. Jones, E.J. Edwards, M. Bonada, et al., “17 - Climate change and its consequences for viticulture,” in A.G. Reynolds, ed. Managing Wine Quality (Second Edition), Woodhead Publishing, 2022, pp. 727–778. https://doi.org/10.1016/B978-0-08-102067-8.00015-4.
[5] N.B. Behmiri, L. Correia, and S. Gouveia, “Drivers of wine production in the European Union: a macroeconomic perspective,” New Medit, vol. 18, no. 3, pp. 85–96, 2019, https://doi.org/10.30682/nm1903g.
[6] B.J. Rickard, Gergaud ,Olivier, Ho ,Shuay-Tsyr, et al., “Trade liberalization in the presence of domestic regulations: public policies applied to EU and U.S. wine markets,” Applied Economics, vol. 50, no. 18, pp. 2028–2047, Apr. 2018, https://doi.org/10.1080/00036846.2017.1386278.
[7] N. Sequeira, M. Mota, R. Costa, et al., “The Influence of the COVID-19 Crisis on Financial Statements Manipulations in the Portuguese Wine and Tourism Sector,” in A. Abreu, J.V. Carvalho, P. Liberato, et al., eds. Advances in Tourism, Technology and Systems, Singapore: Springer Nature, 2024, pp. 483–493. https://doi.org/10.1007/978-981-99-9765-7_42.
[8] , Wine Globalization: A New Comparative History. Cambridge: Cambridge University Press, 2018. https://doi.org/10.1017/9781108131766.
[9] S.M. Loose and R. del Rey, “State of the International Wine Markets in 2023. The wine market at a crossroads: Temporary or structural challenges?,” Wine Economics and Policy, vol. 13, no. 2, pp. 3–14, Sept. 2024, https://doi.org/10.36253/wep-16395.
[10] J. Katunar, M. Grdinić, and D. Maradin, “EU Tax and Agricultural Policy in the Wine Sector,” in B. Olgić Draženović, V. Buterin, and S. Suljić Nikolaj, eds. Real and Financial Sectors in Post-Pandemic Central and Eastern Europe: The Impact of Economic, Monetary, and Fiscal Policy, Cham: Springer International Publishing, 2022, pp. 109–120. https://doi.org/10.1007/978-3-030-99850-9_7.
[11] T.P. Hill, “A statistical derivation of the significant-digit law,” Statistical Science, vol. 10, no. 4, pp. 354–363, 1995, https://doi.org/10.1214/ss/1177009869.
[12] C. Durtschi, W. Hillison, and C. Pacini, “The Effective Use of Benford’s Law to Assist in Detecting Fraud in Accounting Data,” J. Forensic Account, vol. 5, Jan. 2004.
[13] S. Günnel and K.-H. Tödter, “Does Benford’s Law hold in economic research and forecasting?,” Empirica, vol. 36, no. 3, pp. 273–292, 2009, https://doi.org/10.1007/s10663-008-9084-1.
[14] J. Vičič and A. Tošić, “Application of Benford’s Law on Cryptocurrencies,” Journal of Theoretical and Applied Electronic Commerce Research, vol. 17, no. 1, pp. 313–326, 2022, https://doi.org/10.3390/jtaer17010016.
[15] E.M. Noleto-Filho, A.R. Carvalho, M.J.F. Thomé-Souza, et al., “Reporting the accuracy of small-scale fishing data by simply applying Benford’s law,” Frontiers in Marine Science, vol. 9, 2022, https://doi.org/10.3389/fmars.2022.947503.
[16] F. Hanci, “Application of Benford’s law in agricultural production statistics,” Journal of the National Science Foundation of Sri Lanka, vol. 50, no. 2, pp. 387–393, 2022.
[17] T. Suzuki, T. Kamimasu, T. Nakatoh, et al., “Identification of Unnatural Subsets in Statistical Data,” in 2018 7th International Congress on Advanced Applied Informatics (IIAI-AAI), 2018, pp. 74–80. https://doi.org/10.1109/IIAI-AAI.2018.00024.
[18] D. Petrović, M. Novović, and M. Šoškić, “Comparative analysis of milling-bakery and confectionery industry in Serbia based on Benford’s Law,” Economic of Agriculture, vol. 72, no. 1, pp. 13–32, Mar. 2025, https://doi.org/10.59267/ekoPolj250113P.
[19] M. Parker and C. Jeynes, A Maximum Entropy Resolution to the Wine/Water Paradox. 2023. https://doi.org/10.20944/preprints202306.1551.v1.
[20] S.J.E. Parreño, “Analyzing crop production statistics of the Philippines using the newcomb-benford law,” Multidisciplinary Science Journal, vol. 6, no. 6, 2024, https://doi.org/10.31893/multiscience.2024079.
[21] L. Qin, S. Han, L. Xing, et al., “Application Research of Benford’s Law in Testing Agrometeorological Data,” in 2019. https://doi.org/10.1088/1755-1315/310/5/052030.
[22] Á.R. Domínguez-Bustos, R. Cabrera-Castro, M.L. Ramos, et al., “Using Benford’s Law to Detect Possible Biases in Reported Catches of Tropical Tuna From the Indian Ocean,” Fisheries Management and Ecology, vol. 32, no. 1, pp. e12749, 2025, https://doi.org/10.1111/fme.12749.
[23] F. Martinez-Sanchez, “Tracking the Price of Almonds in Spain,” Journal of Competition Law and Economics, vol. 17, no. 3, pp. 750–763, 2021, https://doi.org/10.1093/joclec/nhab002.
[24] M. Ausloos, P.E. Sastroredjo, and P. Khrennikova, “Note on Pre-Taxation Data Reported by UK FTSE-Listed Companies: Search for Compatibility with Benford’s Laws,” Stats, vol. 8, no. 1, pp. 15, Mar. 2025, https://doi.org/10.3390/stats8010015.
[25] Š. Isaković-Kaplan, L. Demirović, and M. Proho, “Benford’s law in forensic analysis of income statements of economic entities in Bosnia and Herzegovina,” Croatian Economic Survey, vol. 23, no. 1, pp. 31–61, 2021, https://doi.org/10.15179/ces.23.1.2.
[26] X. Garza-Gomez, X. Dong, and Z. Yang, “Unusual patterns in reported segment earnings of US firms,” Journal of Applied Accounting Research, vol. 16, no. 2, pp. 287–304, 2015, https://doi.org/10.1108/JAAR-04-2013-0031.
[27] M.J. Nigrini, “An Assessment of the Change in the Incidence of Earnings Management Around the Enron-Andersen Episode,” Review of Accounting and Finance, vol. 4, no. 1, pp. 92–110, 2005, https://doi.org/10.1108/eb043420.
[28] P. Fernandes, Sé. Ciardhuáin, and M. Antunes, “Unveiling Malicious Network Flows Using Benford’s Law,” Mathematics, vol. 12, no. 15, 2024, https://doi.org/10.3390/math12152299.
[29] L.M. Adahali and M. Hall, “Application of the Benford’s law to Social bots and Information Operations activities,” in 2020, . https://doi.org/10.1109/CyberSA49311.2020.9139709.
[30] M. P\uuček, M. Plaček, and F. Ochrana, “Do the data on municipal expenditures in the Czech Republic imply incorrectness in their management?,” Economics and Management, 2016.
[31] T. Van Caneghem, “NPO Financial Statement Quality: An Empirical Analysis Based on Benford’s Law,” Voluntas, vol. 27, no. 6, pp. 2685–2708, 2016, https://doi.org/10.1007/s11266-015-9629-4.
[32] F.A.I. González, “Self-reported income data: are people telling the truth?,” Journal of Financial Crime, vol. 27, no. 4, pp. 1349–1359, 2020, https://doi.org/10.1108/JFC-08-2019-0113.
[33] R.S. Cella and E. Zanolla, “Benford’s Law and transparency: An analysis of municipal expenditure,” Brazilian Business Review, vol. 15, no. 4, pp. 331–347, 2018, https://doi.org/10.15728/bbr.2018.15.4.2.
[34] D. Geyer and C. Drechsler, “Detecting cosmetic debt management using Benford’s law,” Journal of Applied Business Research, vol. 30, no. 5, pp. 1485–1492, 2014, https://doi.org/10.19030/jabr.v30i5.8801.
[35] V. Aggarwal and K. Dharni, “Deshelling the Shell Companies Using Benford’s Law: An Emerging Market Study,” Vikalpa, vol. 45, no. 3, pp. 160–169, 2020, https://doi.org/10.1177/0256090920979695.
[36] E. Badal-Valero, J.A. Alvarez-Jareño, and J.M. Pavía, “Combining Benford’s Law and machine learning to detect money laundering. An actual Spanish court case,” Forensic Science International, vol. 282, pp. 24–34, 2018, https://doi.org/10.1016/j.forsciint.2017.11.008.
[37] R.B. Sowby, “Conformance of Public Water Use Data to Benford’s Law,” Journal - American Water Works Association, vol. 110, no. 12, pp. E52–E59, 2018, https://doi.org/10.1002/awwa.1161.
[38] C.R.S. Carmo, F.C. Nunes, and F. de L. Caneppele, “The limits of conformity analysis under the Newcomb-Benford law and the COVID-19 pandemic in Brazil,” Brazilian Journal of Biometrics, vol. 41, no. 3, pp. 234–248, Sept. 2023, https://doi.org/10.28951/bjb.v41i3.626.
[39] D. Figueiredo and L. Silva, “Multiple conformity tests to assess deviations from the Newcomb-Benford Law (NBL): A replication of Koch and Okamura (2020),” Model Assisted Statistics and Applications, vol. 19, no. 1, pp. 117–122, 2024, https://doi.org/10.3233/MAS-231459.
[40] A.W. Meade, E.C. Johnson, and P.W. Braddy, “Power and Sensitivity of Alternative Fit Indices in Tests of Measurement Invariance,” Journal of Applied Psychology, vol. 93, no. 3, pp. 568–592, 2008, https://doi.org/10.1037/0021-9010.93.3.568.
[41] P. Luty, M. Petković, and R. Vavrek, “Applying Benfordʼs Law on assessing the reliability of financial information in European companies from the rental and leasing sector before and after the adoption of IFRS 16,” Zeszyty Teoretyczne Rachunkowosci, vol. 46, no. 4, pp. 51–68, 2022, https://doi.org/10.5604/01.3001.0016.1302.
[42] R. Cerqueti and M. Maggi, “Data validity and statistical conformity with Benford’s Law,” Chaos, Solitons & Fractals, vol. 144, pp. 110740, Mar. 2021, https://doi.org/10.1016/j.chaos.2021.110740.
[43] C. Goh, “Applying visual analytics to fraud detection using Benford’s law,” Journal of Corporate Accounting and Finance, vol. 31, no. 4, pp. 202–208, 2020, https://doi.org/10.1002/jcaf.22440.
[44] D. Figueiredo Filho, L. Silva, and H. Medeiros, ““Won’t get fooled again”: statistical fault detection in COVID-19 Latin American data,” Globalization and Health, vol. 18, no. 1, 2022, https://doi.org/10.1186/s12992-022-00899-1.
[45] H.R. Morales, M. Porporato, and N. Epelbaum, “Benford’s law for integrity tests of high-volume databases: a case study of internal audit in a state-owned enterprise,” Journal of Economics, Finance and Administrative Science, vol. 27, no. 53, pp. 154–174, 2022, https://doi.org/10.1108/JEFAS-07-2021-0113.
[46] M. Miranda-Zanetti, F. Delbianco, and F. Tohmé, “Tampering with inflation data: A Benford law-based analysis of national statistics in Argentina,” Physica A: Statistical Mechanics and its Applications, vol. 525, pp. 761–770, July 2019, https://doi.org/10.1016/j.physa.2019.04.042.
[47] C.J. Skousen, L. Guan, and T.S. Wetzel, “Anomalies and unusual patterns in reported earnings: Japanese managers round earnings,” Journal of International Financial Management and Accounting, vol. 15, no. 3, pp. 212–234, 2004, https://doi.org/10.1111/j.1467-646X.2004.00108.x.
[48] B. Demir and B. Javorcik, “Trade policy changes, tax evasion and Benford’s law,” Journal of Development Economics, vol. 144, pp. 102456, May 2020, https://doi.org/10.1016/j.jdeveco.2020.102456.
[49] P. Luty and Z. Zawolska, “Detecting Anomalies in Tax Revenues Using Benford’s Law. The Case of Polish Adjustment,” Central European Business Review, vol. 14, June 2025, https://doi.org/10.18267/j.cebr.401.
[50] D. Amiram, Z. Bozanic, and E. Rouen, “Financial statement errors: evidence from the distributional properties of financial statement numbers,” Review of Accounting Studies, vol. 20, no. 4, pp. 1540–1593, 2015, https://doi.org/10.1007/s11142-015-9333-z.