Regional Variations in the Returns to Credible Signals of Product Quality: Empirical Evidence from the German Wine Industry
1 Management Department, Paderborn University, Warburger Strasse 100, 33098 Paderborn, Germany
2 Faculty of Business and Law, University of Portsmouth, Portsmouth PO1 3DE, United Kingdom
3 Management Department, Paderborn University, Warburger Strasse 100, 33098 Paderborn, Germany
4 Lancaster University, Business School, Lancaster, LA1 4YX, United Kingdom
Email: bernd.frick@uni-paderborn.de; daniel.kaimann@port.ac.uk; spiessb@mail.uni-paderborn.de; r.simmons@lancaster.ac.uk
*Corresponding author
Abstract. This study examines regional variation in the returns to quality signals in the German wine industry. Utilizing signaling theory, we investigate whether the price premiums associated with producer reputation and sustainable production methods vary across regional quality contexts. Using 51,069 wine observations from the Gault Millau guide from 2010 to 2017, covering 1,396 wineries, we classify Germany’s major wine regions into high-, medium-, and low-quality clusters based on yield per hectare and the density of elite association memberships. Hedonic price regressions reveal that individual reputation commands significant premiums across all contexts. However, sustainability signals, such as organic and biodynamic production, yield meaningful price premiums only in low-quality regions. In high-quality regions where collective reputation is strong, sustainability certifications provide limited incremental value. These findings suggest that optimal signaling strategies are context-dependent: in established high-quality environments, producers benefit most from individual reputation building and elite association membership, whereas in regions with weaker collective reputation, sustainability certification offers an effective differentiation mechanism. Our results extend signaling theory by demonstrating that signal effectiveness depends on both production costs and the information environment in which signals are deployed. We acknowledge that our sample comprises guide-selected wines, representing a quality-filtered subset, and our findings should be interpreted accordingly.
Keywords: quality signals, reputation, organic wine, biodynamic, wine prices, German wine industry.
Index
2.1 Information asymmetry and market breakdown
2.2 Signaling and separating equilibrium
2.4 Collective reputation and common property problems
2.5 Institutional solutions: the case of the VDP
2.6 Two- stage model of reputation formation
2.7 Sustainable production as a signaling mechanism
2.8 Context- dependent signal effectiveness
2.9 Heterogeneous objectives: utility vs. profit maximization
2.10 The objectives of differentiation
5. Conclusion and implications
The importance of producer reputation on the one hand and of sustainable production methods on the other hand in determining consumers’ willingness to pay for a particular product has been widely acknowledged in the theoretical as well as the empirical literature [see e.g. 1,2,3,4]. Theoretical models have established the mechanisms through which reputation operates as a market signal [5,6,7]. Empirical research has documented significant price effects across various industries [8]. The evidence available for the wine industry in countries like France, Germany Italy and the US shows that individual as well as collective reputation are equally important as they both have a statistically significant and economically relevant impact on bottle prices [see e.g. 9–18]1.
The effect of different production methods on bottle prices has not yet received the same attention and the available results are so far inconclusive. Germany’s wine industry offers a suitable context for the examination of these questions, given that its eight primary wine-producing regions exhibit significant variations in their collective reputations. The regions are then classified into three clusters: Cluster 1 (high quality) consists of the Mosel, Nahe, and Rheingau regions; Cluster 2 (medium quality) consists of Baden, Franken, and Württemberg; and Cluster 3 (low quality) consists of Pfalz and Rheinhessen. The classification is based on yield per hectare and density of VDP (Verband Deutscher Prädikatsweingüter) membership. This classification enables the investigation of whether quality signals function differently across regional reputation contexts.
In the wine industry, three types of production methods can be distinguished. First, the conventional or traditional one, that relies on the use of fungicides, herbicides and pesticides to protect the grapes from vermin particularly during blossom2. Second, the organic one that largely refrains from chemicals inputs. Third, biodynamic production incorporates additional practices based on lunar and cosmic cycles, including specific soil preparations; scientific assessments of these methods remain contested [19]3. While organic production is usually considered “serious” as growers use established procedures, biodynamic production is often considered “dubious” and “esoteric” as its proponents take into account cosmic and lunar rhythms when burying cow horns filled with manure and later spray the swirled ingredients in their vineyards4. Moreover, it is necessary to further distinguish between self-declared ecological behavior (which most economists would immediately dismiss as “cheap talk”) and certified ecological behavior (which – due to the costs involved – is typically regarded a “credible commitment”). While some papers identify a price premium that the producers of organic and biodynamic wines can charge [e.g. 14], others find a price penalty especially for high-quality wines [e.g. 29]5.
We extend the available literature by asking whether the effect of individual and collective reputation on the one hand and the impact of different production methods on the other hand on the prices charged by wine-makers are similar in different regions or whether they vary with certain characteristics of the environment. More specifically, we seek to answer two different, yet closely related questions: First, which firms abandon conventional production methods and decide to produce either according to organic or biodynamic rules in three homogenous regional clusters and, second, what are the returns to reputation and organic/biodynamic production methods in these clusters?
We operationalize returns as the price premiums estimated via hedonic regression, conditional on wine characteristics, over our 2010–2017 observation period.
Our theoretical framework generates the following hypotheses:
H1: Individual reputation positively affects wine prices across all regional contexts.
H2: VDP membership (collective reputation signal) positively affects wine prices across all regional contexts.
H3: The price premium for sustainable production methods varies across regional quality contexts.
H4: Sustainable production methods generate larger price premiums in low-quality regions than in high-quality regions.
Our findings support these hypotheses. Individual reputation commands similar significant premiums across all regions. Sustainable production signals, however, yield meaningful returns only in regions with weaker collective reputation, where they serve as differentiation mechanisms. These results suggest that optimal signaling strategies are environment-dependent.
The reminder of the paper proceeds as follows: In the next section, we develop a model of investing in reputation and the choice of sustainable production methods. We then continue with the presentation of the data and our econometric results. We conclude with an interpretation of our findings, the limitations of our study and some suggestions for future research.
The economic theory of signaling provides a framework for understanding market outcomes under asymmetric information, where one party – typically the producer – possesses private information about product quality that is not directly observable to consumers6. The seminal works of Akerlof [32], Spence [33], and Shapiro [7] established the foundations for analyzing such markets, demonstrating that information asymmetries generate inefficiencies in exchange and that credible signaling mechanisms can partially restore allocative efficiency.
2.1 Information asymmetry and market breakdown
In markets for experience goods – where product quality is known only after consumption – buyers face uncertainty about the true quality of the good ex ante. Absent credible information, consumers rationally form expectations based on the average quality in the market. In equilibrium, low-quality producers (lemons) have an incentive to mimic high-quality producers, leading to adverse selection and potential market unraveling [32]. High-quality firms therefore face incentives to separate themselves through costly signaling.
2.2 Signaling and separating equilibrium
According to Spence [33], a credible signal must satisfy two conditions: (i) it must be observable by the uninformed party, and (ii) it must be less costly for high-quality types to produce than for low-quality types. When these cost differentials are sufficiently large, the equilibrium is separating, i.e. each type of firm reveals its quality through its chosen signal. Observable, costly actions such as investments in reputation, third-party certification, and self-commitment mechanisms constitute such signals. For high-quality firms, these expenditures serve as an investment in credibility; for low-quality firms, the cost of imitation is prohibitively high, ensuring the persistence of separation. In equilibrium, the price premium for high-quality goods represents a quasi-rent accruing to the firm’s stock of reputational capital. This premium both compensates the initial signaling investment and sustains incentives for quality maintenance. Conversely, in the absence of credible signaling channels or price differentials, opportunistic strategies – characterized by short-term cost reductions and quality deterioration – become privately optimal, even though they are socially inefficient.
When product quality is not directly observable prior to purchase, consumers rely on historical information to infer expected quality. Repeated interaction and consistent quality provision allow firms to accumulate reputation capital over time. During the initial reputation-building phase, producers must operate below cost, as market prices do not yet reflect the firm’s true quality. Once the reputation is established, equilibrium prices exceed marginal cost, yielding a return on reputation investment. The present value of these future rents must exceed the upfront costs for the investment to be privately optimal. In a steady-state equilibrium, reputation functions as an endogenous mechanism of market discipline. However, due to moral hazard and adverse selection, complete enforcement of quality is infeasible, particularly in industries with a large number of small producers and limited traceability. Consequently, collective mechanisms often emerge to mitigate free-riding and coordinate quality expectations.
2.4 Collective reputation and common property problems
Tirole [36] extends the analysis to consider collective reputation, where a firm’s expected quality is a function of the average quality of all producers within a group or region. In such settings, the collective reputation operates as a common property resource: individual firms internalize only a fraction of the reputational benefits of their quality investment but fully bear the cost. This generates a dynamic externality and a tendency toward underinvestment in quality [37]. As the number of producers increases, incentives for individual monitoring and quality maintenance diminish, producing a free-rider problem. Heterogeneity in product quality exacerbates this issue. High-quality producers capture only limited marginal benefits from collective reputation, while low-quality producers gain disproportionately. Hence, top producers face incentives to exit the pooling equilibrium and establish a separating mechanism through the creation of selective associations.
2.5 Institutional solutions: the case of the VDP
A salient institutional response is the formation of professional associations, such as the *Verband Deutscher Prädikatsweingüter* (VDP). Such associations function as endogenous signaling institutions that facilitate a separating equilibrium among heterogeneous producers. Membership is restricted and conditional on reputation-compatible behavior, enforced through peer monitoring and social sanctions. Incumbent members screen entrants ex ante and engage in continuous ex post evaluation to preserve the association’s collective reputation. Social proximity and repeated interaction among members generate informal enforcement mechanisms that reduce the incentive to free-ride on shared reputation. Membership thus acts as a credible signal of high quality, while individual reputation serves as a necessary precondition for access to the collective reputation mechanism.
2.6 Two- stage model of reputation formation
Reputation building can be conceptualized as a two-phase process. In the initial phase, producers incur losses by offering high-quality goods at prices below cost. In the subsequent equilibrium phase, the established reputation allows firms to charge a price premium exceeding production costs. The equilibrium premium represents the return on initial reputation investment, sustaining long-run incentives for quality maintenance. Absent such premiums, a firm may find an opportunistic strategy, that is temporarily lowering quality to reduce costs, more profitable. However, the reputational damage from such behavior manifests only in the long run. Thus, in a dynamic optimization framework, a firm will maintain quality if and only if the discounted value of future reputation rents exceeds the short-term gain from shirking. Nevertheless, moral hazard implies that full quality commitment is unattainable, as monitoring remains imperfect and guarantees incomplete.
2.7 Sustainable production as a signaling mechanism
The signaling framework extends to sustainable production technologies. From the perspective of information economics, self-declaration without third-party verification constitutes a weaker signal because it involves no cost to the producer. Conversely, third-party certification serves as a costly signal, representing a credible commitment to environmental quality, as it involves monitoring and compliance costs.
Although Demeter certification provides standard third-party verification for biodynamic practices, some producers adhere to biodynamic principles without pursuing certification. The underlying rationales encompass factors such as financial implications of certification, the administrative burden it entails, philosophical objections to formal certification regimes, and partial adoption scenarios that do not meet the criteria for full certification. In accordance with the theoretical framework employed, self-declared biodynamic production signifies a rather weak signal in comparison with Demeter certification, due to the complete absence of third-party verification. The Gault Millau guide identifies self-declared producers based on reported practices that editors verify through winery visits.
The transition from conventional to sustainable production occurs in stages: self-selection (initial declaration) and screening (certification authority evaluation). Conversion in this context is associated with higher expenses and a reduction in yield for producers. Certification serves as a differentiating factor, distinguishing authentic high-quality producers from those who seek to exploit market opportunities through imitation. The adoption decision constitutes an intertemporal optimization problem, determined by expected premiums, cost differentials, and discount rates.
In formal terms, let t0 denote the pre-transition period, t1 the initiation of the transition, and t2 the certification date. During t1 - t2, producers experience negative profit differentials. Only if the expected discounted value of post-certification premiums (in t3) exceeds the net present value of transition costs will the investment be rational for a profit-maximizing producer.
2.8 Context- dependent signal effectiveness
Our primary theoretical contribution pertains to the effectiveness of signals across diverse market environments. Standard signaling theory posits that credible signals must be costly. However, the value of a signal is contingent not solely on its cost but also on the information gap it addresses. In regions with a strong reputation, where mechanisms such as VDP membership, individual expert ratings, and a robust collective reputation already serve as reliable indicators of quality, the adoption of sustainable production certification, while costly, offers only limited additional information. The signal is costly but potentially redundant.
In regions where collective reputation is weaker and fewer producers have achieved individual distinction, sustainable production provides a mechanism for differentiation that is both costly and informative. This theoretical extension suggests that optimal signaling strategies are environment-dependent, thereby generating our core hypotheses about heterogeneous returns to sustainability signals across regional contexts.
2.9 Heterogeneous objectives: utility vs. profit maximization
Empirical studies suggest that not all producers conform to the neoclassical assumption of profit maximization. Morton and Podolny [38] document substantial non-pecuniary motivations among California winemakers: a majority express disutility from selling their wineries even at higher financial returns elsewhere, and a significant fraction willingly incur monetary losses to enhance product quality. Similarly, Delmas and Gergaud [39] find that producers with dynastic or stewardship motives exhibit higher propensities to adopt sustainable practices and seek certification. These findings imply that the representative producer’s objective function includes both pecuniary and non-pecuniary components. For such producers, the marginal utility of non-pecuniary attributes can offset the disutility of lower profits. In equilibrium, the market may consist of both profit- and utility-maximizing firms, generating heterogeneous behavioral responses and potentially stabilizing high-quality equilibria.
Summarizing, the economics of signaling provides a powerful analytical lens for understanding how markets with asymmetric information can sustain efficiency through endogenous signaling and reputation mechanisms. In industries such as wine production, reputation operates both at the individual and collective levels, with associations and certification bodies acting as institutionalized signals. When reputation and certification generate sufficient price premiums, they ensure that high-quality equilibria are sustainable. However, heterogeneity in objectives and information structures implies that equilibrium outcomes are shaped not only by profit incentives but also by broader notions of utility, identity, and social embeddedness.
2.10 The objectives of differentiation
In both, the strategic management and the economics literature, differentiation refers to the process of distinguishing a product or service by making it more appealing to a specific group of customers. Products that are horizontally differentiated vary in their characteristics. For wineries, this could involve differences in production methods. Vertically differentiated products, on the other hand, differ in quality, which in the wine industry may be reflected by star ratings or scores in various guidebooks. This distinction implies that a profit-maximizing firm can pursue two conceptually different strategies: it can either “do things better” by offering superior quality or “do things differently” by targeting market niches unoccupied by competitors. The fundamental objective of differentiation is to establish a position that existing customers value and potential customers perceive as unique. Both, horizontal as well as vertical differentiation enable a firm to command a price premium because customers who value the respective product or service become less sensitive to competing offers. In other words, successful differentiation decreases price sensitivity in a given market segment. As a result, it provides a competitive advantage, since the differentiated products or services are no longer seen as perfect substitutes for those of rival firms.
Consider a customer in a wine shop deciding between two wines, A and B. If the customer has no prior information about either option, both wines appear equally attractive. The choice, therefore, is random. Suppose the customer selects wine A. Future shoppers may then notice that wine A’s shelf is less full, inferring that its popularity signals higher quality. Consequently, they too are more likely to choose wine A. This behavior illustrates bounded rationality, where individuals make decisions based primarily on the observable actions of others [40–43]. Such “naïve” decision-making tends to occur in markets characterized by asymmetric information between producers and consumers. Since most wine buyers are initially uninformed about quality, they rely on signals, such as expert reviews or production method, to infer it. In this context, credible signals that are easily understood by consumers become crucial. Winery owners can thus choose among various signaling strategies to distinguish themselves from competitors and maximize profits.
This study draws on a large dataset of wines from the eight largest wine-growing regions in Germany. It identifies two distinct differentiation strategies: the exclusivity strategy and the sustainability strategy. These approaches have received limited attention in prior research but are credible because they involve substantial initial investments in either social capital (e.g., gaining entry to selective associations) or human capital (e.g., acquiring expertise in sustainable production techniques). According to Barney [44], firms that possess resources that are valuable, rare, inimitable, and non-substitutable can achieve and maintain a sustainable competitive advantage. While firms pursuing cost leadership typically rely on standardized, mass-produced products, those seeking differentiation-based advantage must focus more closely on the quality and allocation of resources devoted to customer service and product excellence [45].
We use the prestigious “Gault Millau” guide for the years 2010 to 2017, including 51,069 different wines produced by 1,396 wineries in the eight largest wine-growing regions of Germany.
It is imperative to note that the scope of our analysis is constrained to wines that have been meticulously selected for inclusion in this esteemed compendium, thereby constituting a select, quality-filtered subset of the market. Consequently, the findings of this study pertain to the functionality of quality signals among wines that have already passed an editorial quality threshold, rather than across the full quality distribution within each region.
The 2010–2017 period was selected as the subject of analysis due to the availability of the most recent complete Gault Millau data at the time of analysis. It is acknowledged that this period predates the acceleration of consumer interest in sustainable wines observed after 2018 [24]. Consequently, the estimates obtained may be regarded as conservative lower bounds on current sustainability premiums.
The classification of these regions is determined by two primary criteria: the quality of the wines produced, as indicated by the yield per hectare, and the number of members of the “Verband Deutscher Prädikatsweingüter” (VDP; Association of German Quality Wine Producers) per 1,000 hectares of cultivated land7. The initial cluster encompasses the regions of Mosel, Nahe, and Rheingau, which are regarded as high-quality. The subsequent cluster comprises Baden, Franken, and Württemberg, which are classified as intermediate in quality. The final cluster consists of the regions Pfalz and Rheinhessen, which are considered low-quality (see Figure 1, Tables 1 and 2). We deliberately excluded from our analysis the small regions of Ahr, Hessische Bergstraße, Mittelrhein, Saale-Unstrut, and Sachsen that together account for less than 3 percent of the acreage in Germany (see Table 1).
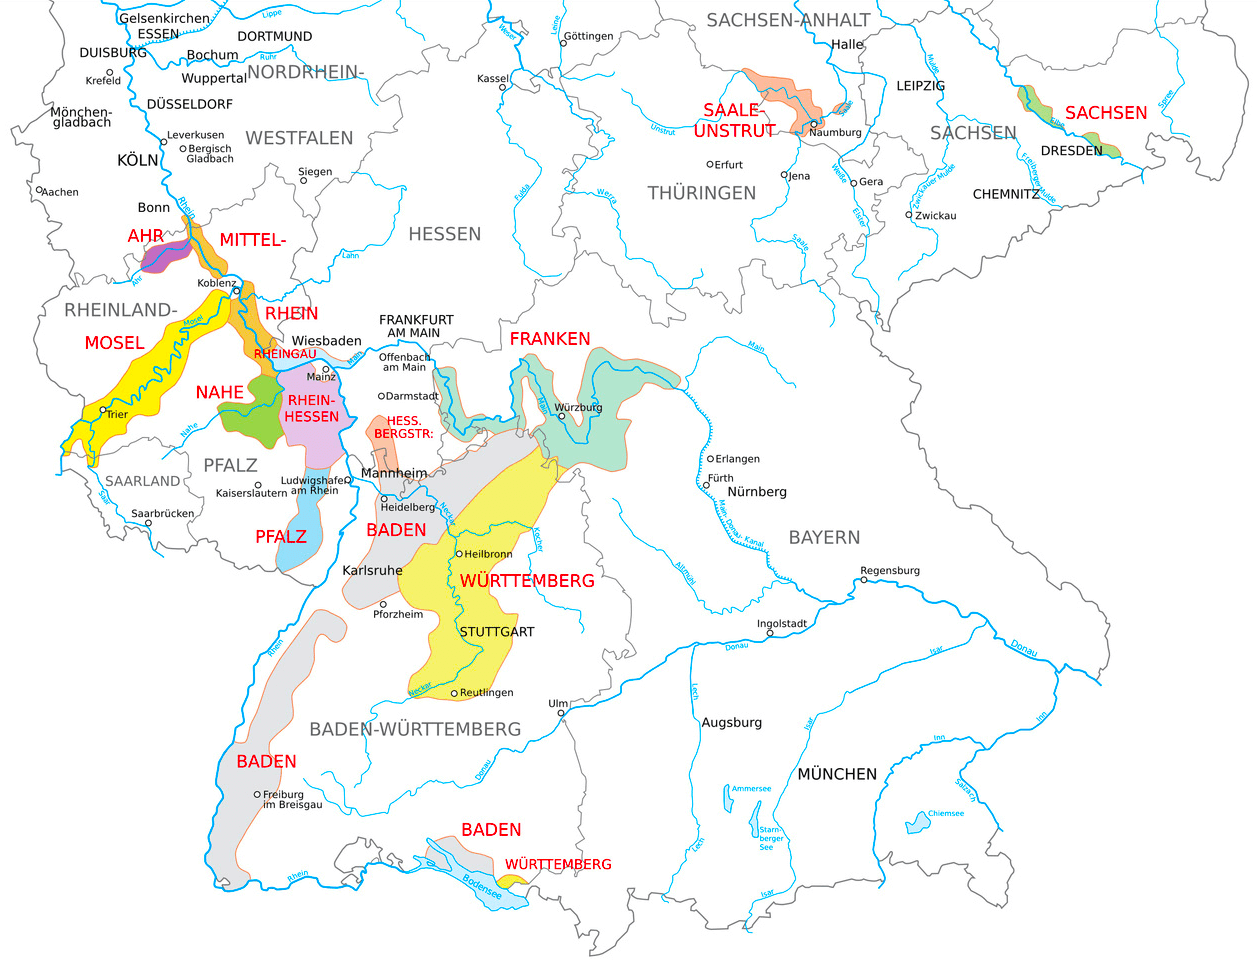
| Region | Size (hectares) | Acreage cultivated by wineries listed in Gault Millau |
|---|---|---|
| Cluster 1 (16,000 hectares) | ||
| Mosel | 9,000 | 21 |
| Nahe | 4,000 | 27 |
| Rheingau | 3,000 | 58 |
| Cluster 2 (33,000 hectares) | ||
| Baden | 16,000 | 35 |
| Franken | 6,000 | 55 |
| Württemberg | 11,000 | 22 |
| Cluster 3 (51,000 hectares) | ||
| Pfalz | 24,000 | 17 |
| Rheinhessen | 27,000 | 12 |
| Excluded Regions (2,900 hectares) | ||
| Ahr | 600 | 90 |
| Hessische Bergstraße | 500 | 11 |
| Mittelrhein | 500 | 31 |
| Saale-Unstrut | 800 | 16 |
| Sachsen | 500 | 50 |
We cluster regions rather than employing individual region fixed effects because our theoretical framework predicts differences in signaling returns based on regional quality environments. This theoretical framework suggests that different signaling returns are contingent upon regional quality differences. The incorporation of region-fixed effects would effectively address the variation under investigation. This clustering approach, therefore, enables testing of the hypothesis that signal effectiveness varies systematically with the collective reputation of the regional context.
Production Methods: A five-category system is employed to categorize these products: conventional (reference), self-declared organic, certified organic, self-declared biodynamic, and certified biodynamic. Certified organic producers hold EU organic certification. Certified biodynamic producers are recognized by Demeter. Self-declared producers are identified by Gault Millau editors as following either organic or biodynamic practices without formal certification, based on winery visits and producer communications.
Individual Reputation: Gault Millau employs a scale ranging from 0.5 to 5 to assign grape ratings, analogous to star ratings in restaurant guides or points in other wine rating systems. The presence of one grape indicates a satisfactory producer, whereas the presence of five grapes indicates an exceptional, world-class winery. The model incorporates dummy variables for each rating level, with the “promising newcomer” category (0.5 grapes) serving as the reference point.
VDP Membership: A binary indicator of membership in the Verband Deutscher Prädikatsweingüter.
Re-entry: A binary indicator for wineries previously included in the guide. It then disappeared, and subsequently returned, thereby capturing the phenomenon of reputation recovery or resurgence.
We estimate two sets of models. First, probit models examine determinants of sustainable production adoption. In the probit specifications, cluster 3 (Pfalz/Rheinhessen, the low-quality cluster) serves as the reference category, with individual region dummies capturing within-cluster variation. Second, hedonic price regressions estimate returns to quality signals.
The hedonic specification is:
where i indexes wines, j indexes wineries, and t indexes years. We estimate random-effects models to account for winery-level heterogeneity, clustering standard errors at the winery level.
We acknowledge that VDP membership and organic/biodynamic certification are endogenous decisions. Wineries self-select into these categories based on unobserved characteristics that likely correlate with both quality and price. For instance, producers who prioritize quality may be more inclined to seek VDP membership and consequently produce wines of a higher caliber, which can command premium prices regardless of membership.
Absent valid instrumental variables, regression discontinuity designs, or selection corrections, the estimated price premiums should be interpreted as conditional associations rather than causal effects. The premium estimates may partially reflect pre-existing quality differences among adopters rather than the marginal value of certification per se. Future research with quasi-experimental variation in certification eligibility could address this limitation.
Table 3 presents the descriptive statistics of the data set used to estimate the two sets of models. It is noteworthy that wines from the Pfalz and Rheinhessen regions (cluster 3) are underrepresented in relation to their acreage in Germany (49% of the total, as shown in Table 1) compared to the 35% representation of wines in the sample. Conversely, wines from the Mosel, Nahe, and Rheingau regions (cluster 1) are overrepresented, given their 15% share of total acreage in Germany (Table 1), which is lower than the 28% representation of wines in the sample. This pattern aligns with our quality classification. However, it should be interpreted as reflecting editorial preferences rather than validating our approach.
| Variable | Mean | Std. Dev. | Min. | Max. |
|---|---|---|---|---|
| Founding Year | 1788 | 226 | 817 | 2014 |
| Family Owned | 0.91 | --- | 0 | 1 |
| Cooperative | 0.03 | --- | 0 | 1 |
| VDP member | 0.26 | --- | 0 | 1 |
| Baden | 0.12 | --- | 0 | 1 |
| Franken | 0.17 | --- | 0 | 1 |
| Württemberg | 0.07 | --- | 0 | 1 |
| Mosel | 0.13 | --- | 0 | 1 |
| Nahe | 0.06 | --- | 0 | 1 |
| Rheingau | 0.09 | --- | 0 | 1 |
| Pfalz | 0.18 | --- | 0 | 1 |
| Rheinhessen | 0.17 | --- | 0 | 1 |
| Acreage | 26.30 | 66.67 | 0.30 | 1,450 |
| Bottles per Year | 203,736 | 697,130 | 2,900 | 1,600,000 |
| Price per Bottle | 12.75 | 9.63 | 3.10 | 430.00 |
The vast majority of these enterprises are family-run businesses, with a significant number of them having a history that spans centuries. The 26-percentage share of wines produced by VDP members indicates that these wineries are massively over-represented in the wine guide that was used as the data source for this study. Furthermore, an examination of the mean and standard deviation reveals that both variables exhibit significant skewness, with the standard deviation being 2 to 3 times greater than the respective mean8.
| Cluster | Percent of Acreage | Yield per Hectare | Percent Organic/ Biodynamic | Members in VDP | VDP members per 1,000 hectares |
|---|---|---|---|---|---|
| Cluster 1 | 16 | 69 | 8 | 72 | 4.5 |
| Cluster 2 | 33 | 75 | 12 | 66 | 2.0 |
| Cluster 3 | 49 | 93 | 11 | 45 | 0.9 |
| Total | 98 | 85 | 10 | 199 | 1.9 |
Table 4 displays the results of our probit estimations regarding the selection of production methods. It appears that firms in the low-quality cluster 3 exhibit a notably higher propensity to adopt organic or biodynamic practices as a competitive strategy. This observation is supported by the negative and statistically significant nature of 17 of the 18 coefficients denoting location in cluster 1 or 2 regions. Furthermore, empirical evidence suggests that older firms and family-owned businesses are more likely to adopt organic or biodynamic production methods. Cooperatives are also more likely to produce according to organic standards, primarily to improve their rather poor reputation [e.g., 46,47]. While acreage is positively and significantly associated with the adoption of sustainable practices, annual bottle production is negatively associated with it. Finally, members of the VDP are more likely to employ sustainable production methods, encompassing both organic and biodynamic practices.
| Model | (1) | (2) | (3) | (4) | |||||||||||||||
|---|---|---|---|---|---|---|---|---|---|---|---|---|---|---|---|---|---|---|---|
| Dependent Variable | Self-declared Organic |
Certified Organic |
Self-declared Biodynamic |
Certified Biodynamic |
|||||||||||||||
| Founding Year | 0.000625*** | 0.000581*** | 0.000685*** | 0.000474*** | |||||||||||||||
| (0.0000411) | (0.0000432) | (0.0000727) | (0.0000855) | ||||||||||||||||
| Family Owned | 0.170*** | 0.178*** | 0.800*** | --- | |||||||||||||||
| (0.0335) | (0.0348) | (0.0733) | |||||||||||||||||
| Cooperative | 0.933*** | 0.516*** | --- | --- | |||||||||||||||
| (0.0787) | (0.0815) | ||||||||||||||||||
| Franken | -0.392*** | -0.402*** | -0.418*** | -0.251*** | |||||||||||||||
| (0.0256) | (0.0280) | (0.0422) | (0.0540) | ||||||||||||||||
| Baden | -0.321*** | -0.102*** | -0.109*** | 0.111*** | |||||||||||||||
| (0.0227) | (0.0234) | (0.0341) | (0.0393) | ||||||||||||||||
| Württemberg | -0.642*** | -0.324*** | -0.762*** | -0.233*** | |||||||||||||||
| (0.0326) | (0.0324) | (0.0662) | (0.0664) | ||||||||||||||||
| Mosel | -0.628*** | -0.568*** | -0.454*** | -0.815*** | |||||||||||||||
| (0.0303) | (0.0334) | (0.0535) | (0.110) | ||||||||||||||||
| Nahe | -0.771*** | -0.525*** | 0.0132 | 0.352*** | |||||||||||||||
| (0.0439) | (0.0443) | (0.0514) | (0.0543) | ||||||||||||||||
| Rheingau | -0.843*** | -0.731*** | -0.795*** | -0.261*** | |||||||||||||||
| (0.0314) | (0.0338) | (0.0560) | (0.0569) | ||||||||||||||||
| VDP member | 0.574*** | 0.533*** | 0.614*** | 0.128*** | |||||||||||||||
| (0.0182) | (0.0189) | (0.0277) | (0.0348) | ||||||||||||||||
| Acreage | -0.00295*** | 0.00303*** | 0.0288*** | 0.0347*** | |||||||||||||||
| (0.000842) | (0.000828) | (0.00188) | (0.00203) | ||||||||||||||||
| Bottles per Year | -5.95e-08 | -0.000000567*** | -0.00000372*** | -0.00000397*** | |||||||||||||||
| (9.21e-08) | (9.47e-08) | (0.000000300) | (0.000000318) | ||||||||||||||||
| Year Dummies | included | included | included | included | |||||||||||||||
| Constant | -2.050*** | -2.348*** | -3.844*** | -2.990*** | |||||||||||||||
| (0.0868) | (0.0909) | (0.166) | (0.170) | ||||||||||||||||
| N | 35,078 | 35,078 | 33,768 | 30,923 | |||||||||||||||
| Standard errors (clustered at winery id) in parentheses; * p < 0.10, ** p < 0.05, *** p < 0.01. | |||||||||||||||||||
Looking at Table 5, it appears that – as expected – the returns to organic/biodynamic wine production vary considerably across the clusters (as does the likelihood of adopting organic/biodynamic practices). In low quality regions, their adoption seems to pay off, while in high quality regions other strategies (such as lobbying for VDP membership) are more rewarding9. In low quality regions, the adoption of organic/biodynamic standards helps to differentiate oneself from the competition, while in high quality regions VDP membership serves exactly the same purpose. From a consumer perspective, the price premium for organic and biodynamic wines is zero in cluster 1 (Mosel/Nahe/Rheingau), moderate in cluster 2 (Baden/Franken/Württemberg) and substantial in cluster 3 (Pfalz/ Rheinhessen). Thus, the lower the average quality in a particular region, the higher the price premium charged by organic/biodynamic producers. In other words: In low quality regions organic and biodynamic production (whether certified or not) serves as a quality signal, whereas this is not the case in regions with a high average reputation (similar results are presented by Delmas and Lessem [48] for the different wine growing regions in California).
| Model | (1.1) | (1.2) | (1.3) | ||||||||||||||||
|---|---|---|---|---|---|---|---|---|---|---|---|---|---|---|---|---|---|---|---|
| Average Quality Dep. Variable: Log(Bottle Price) |
High Cluster 1 |
Medium Cluster 2 |
Low Cluster 3 |
||||||||||||||||
| Self-Declared Organic (1=yes) | 0.000699 | 0.0392* | 0.0467*** | ||||||||||||||||
| (0.0422) | (0.0209) | (0.0160) | |||||||||||||||||
| Certified Organic (1=yes) | 0.0176 | 0.0572** | 0.0485* | ||||||||||||||||
| (0.0360) | (0.0245) | (0.0271) | |||||||||||||||||
| Self-Declared Biodynamic (1=yes) | -0.0154 | -0.00706 | 0.157*** | ||||||||||||||||
| (0.0535) | (0.0356) | (0.0404) | |||||||||||||||||
| Certified Biodynamic (1=yes) | 0.0943 | 0.0376 | 0.0876** | ||||||||||||||||
| (0.0947) | (0.0349) | (0.0403) | |||||||||||||||||
| VDP Member (1=yes) | 0.156*** | 0.0908*** | 0.0993*** | ||||||||||||||||
| (0.0345) | (0.0242) | (0.0323) | |||||||||||||||||
| Individual Reputation 1 | 0.0621*** | 0.0501*** | 0.0802*** | ||||||||||||||||
| (0.0189) | (0.0137) | (0.0173) | |||||||||||||||||
| Individual Reputation 2 | 0.113*** | 0.0929*** | 0.115*** | ||||||||||||||||
| (0.0225) | (0.0187) | (0.0212) | |||||||||||||||||
| Individual Reputation 3 | 0.162*** | 0.0996*** | 0.172*** | ||||||||||||||||
| (0.0263) | (0.0227) | (0.0263) | |||||||||||||||||
| Individual Reputation 4 | 0.164*** | 0.0942*** | 0.194*** | ||||||||||||||||
| (0.0478) | (0.0325) | (0.0469) | |||||||||||||||||
| Individual Reputation 5 | 0.233*** | 0.151*** | 0.249*** | ||||||||||||||||
| (0.0665) | (0.0325) | (0.0471) | |||||||||||||||||
| Re-entry (1=yes) | 0.0741 | 0.0202 | 0.0875* | ||||||||||||||||
| (0.0597) | (0.0241) | (0.0530) | |||||||||||||||||
| Alcohol | -0.514*** | -0.665*** | -0.221*** | ||||||||||||||||
| (0.0487) | (0.0522) | (0.0711) | |||||||||||||||||
| Alcohol2 | 0.0282*** | 0.0330*** | 0.0151*** | ||||||||||||||||
| (0.00219) | (0.00214) | (0.00291) | |||||||||||||||||
| Storage Potential (in years) | 0.129*** | 0.143*** | 0.187*** | ||||||||||||||||
| (0.00385) | (0.00392) | (0.00557) | |||||||||||||||||
| Barrique (1=yes) | 0.134*** | 0.139*** | 0.136*** | ||||||||||||||||
| (0.0188) | (0.0130) | (0.0131) | |||||||||||||||||
| Cooperative (1=yes) | -0.119 | -0.0864*** | -0.236*** | ||||||||||||||||
| (0.0803) | (0.0196) | (0.0327) | |||||||||||||||||
| Publication Year Dummies | Included | ||||||||||||||||||
| Harvest Year Dummies | Included | ||||||||||||||||||
| Quality Dummies | Included | ||||||||||||||||||
| Type Dummies | Included | ||||||||||||||||||
| Style Dummies | Included | ||||||||||||||||||
| Grape Dummies | included | ||||||||||||||||||
| Constant | 3.384*** | 4.746*** | 2.000*** | ||||||||||||||||
| (0.289) | (0.331) | (0.438) | |||||||||||||||||
| N of Wines | 14,504 | 18,312 | 18,253 | ||||||||||||||||
| N of Wineries | 500 | 449 | 447 | ||||||||||||||||
| Wines per Winery | 1-118 | 1-160 | 1-170 | ||||||||||||||||
| R2 within | 58.4 | 62.6 | 62.7 | ||||||||||||||||
| R2 between | 67.0 | 69.1 | 65.0 | ||||||||||||||||
| R2 overall | 64.0 | 66.8 | 67.2 | ||||||||||||||||
| Standard errors (clustered at winery id) in parentheses; * p < .10, ** p < 0.05, *** p < 0.01. | |||||||||||||||||||
The variable most strongly associated with bottle prices is, however, a wine-maker’s individual reputation. In a low- as well as in a high-quality environment, each additional grape awarded by the experts of the wine guide is associated with a similar increase in bottle prices10. In cluster 2, denoting an intermediate level of regional quality, this association is smaller, yet still economically highly relevant. Thus, investing in individual reputation and – particularly in the case of cluster 1 – membership in VDP pays off the most. However, since the talent required to obtain a four- or five-grape rating, is scarce, the costs are simply too high for most of the winemakers. A rational utility-maximizing individual, who knows his talent level relative to that of his competitors will stop investing in the acquisition of additional reputation at the point where the expected marginal returns are identical with the expected marginal costs11.
Table 6 displays the additional revenues that can be generated by moving from traditional to organic or biodynamic wine-making and by becoming a VDP member. It appears that in high-quality cluster 1 the adoption of organic and biodynamic practices are not associated with measurable additional revenues. Given the rather small size of the wineries in cluster 1, VDP membership is associated with additional revenues of 2€ per bottle. In cluster 3 – the low-quality environment – biodynamic practices show the largest positive association with revenues, irrespective of whether the winery is certified or not. In the case of self-declared biodynamic production the surprisingly strong effect is driven by 27 different firms, ruling out any outlier effect12.
| Type of Producer | Collective Reputation of Cluster | ||||||||||||||||||
|---|---|---|---|---|---|---|---|---|---|---|---|---|---|---|---|---|---|---|---|
| High | Medium | Low | |||||||||||||||||
| Mosel/Nahe/Rheingau | Baden/Franken/Württemberg | Pfalz/Rheinhessen | |||||||||||||||||
| Self-declared organic | 0 | 170,000 | 100,000 | ||||||||||||||||
| Certified organic | 0 | 260,000 | 100,000 | ||||||||||||||||
| Self-declared biodynamic | 0 | 0 | 310,000 | ||||||||||||||||
| Certified biodynamic | 0 | 0 | 170,000 | ||||||||||||||||
| VDP member | 210,000 | 360,000 | 180,000 | ||||||||||||||||
| Bottles per Year | 110,000 | 330,000 | 150,000 | ||||||||||||||||
| Numbers are based on the respective coefficients displayed in Table 5, multiplied by the average number of bottles produced per year. The coefficients were corrected using the method suggested by Halvorsen and Palmquist [50] and rounded for ease of presentation | |||||||||||||||||||
5. Conclusion and implications
We expand the existing empirical literature in two ways: First, we identify the factors that drive the choice of organic or biodynamic production methods for certified and non-certified firms. Then, we estimate the price premium that organic and biodynamic producers, as well as VDP members, charge for their products in three different wine region clusters. Rather than asking consumers about their willingness to pay for organic or biodynamic wines, we examine the revealed preferences of presumably profit-maximizing entrepreneurs.
In a highly competitive environment like the wine industry, where even the largest producers have negligible market shares and imports account for more than half of total consumption, high-quality producers must distinguish themselves from low-quality firms. The best way to do so is to invest in building an individual reputation. However, the second-best alternative for high-quality firms depends on the business environment in which they operate. While adopting organic or biodynamic is not associated with a measurable price premium in a high-quality environment, it is associated with a substantial premium in a low-quality environment, consistent with a competitive-advantage interpretation.
These findings challenge the traditional assumption that a signal is universally credible due to the costs of its production. Instead, our estimates suggest that, depending on the market environment, the same signal can be meaningfully associated with firm performance or show no detectable association at all13.
Admittedly, our findings may be difficult, if not impossible, to generalize. The wine market is heavily regulated everywhere, and the rules differ greatly from country to country. Thus, replicating our study with data from countries such as Austria, Italy, and France, for which the same wine guide has long been available, would either support or refute our conclusions based on German data.
Our results suggest context-specific strategies for wine producers. In established, high-quality regions, the best use of resources is building an individual reputation and pursuing elite association membership. While sustainable production may be worthwhile for non-pecuniary reasons, it is unlikely to generate significant price premiums. In regions with a weaker collective reputation, sustainable production is an effective differentiation strategy. Premiums are observed in association with both certified and self-declared sustainable practices, with the association being stronger for certification.
Several limitations warrant emphasis. First, our sample comprises wines selected for inclusion in the Gault Millau guide, which represents a quality-filtered subset. Our findings pertain to how signals function among the top wineries in Germany, not across the full market14. Second, we cannot establish causal effects. VDP membership and certification decisions are endogenous, so estimated premiums may reflect pre-existing quality differences rather than the value of membership or certification itself. Third, the period from 2010 to 2017 predates the recent acceleration in consumer sustainability preferences. Current premiums for sustainable production may exceed our estimates. Fourth, while theoretically motivated, our clustering approach involves researcher judgement. Fifth, our findings may not generalize beyond Germany. Replicating the study with data from Austria, Italy, or France will either confirm the external validity of our results or reveal a German peculiarity.
Conceptualization, B.F., D.K., R.S. and C.S.B.; methodology, B.F., D.K. and C.S.B.; formal analysis, B.F. and R.S.; data curation, B.F.; writing – original draft preparation, D.K. and C.S.B.; writing – review and editing, B.F., R.S. and D.K.. All authors have read and agreed to the published version of the manuscript.
[1] D. Gale, R.W. Rosenthal, Price and Quality Cycles for Experience Goods, Rand Journal of Economics. 25 (1994) 590–607.
[2] P.M. Ippolito, Bonding and Non-Bonding Signals of Product Quality, Journal of Business. 63 (1990) 41–60.
[3] R. Rob, A. Fishman, Is Bigger Better? Customer Base Expansion through Word‐of‐Mouth Reputation, Journal of Political Economy. 113(5) (2005) 1146–1162.
[4] S. Tadelis, The Market for Reputations as an Incentive Mechanism, Journal of Political Economy. 110 (2002) 854–882.
[5] F. Allen, Reputation and Product Quality, Rand Journal of Economics. 15 (1984) 311–327.
[6] C. Shapiro, Consumer Information, Product Quality, and Seller Reputation, Bell Journal of Economics. 13 (1982) 20–35.
[7] C. Shapiro, Premiums for High Quality Products as Returns to Reputations, Quarterly Journal of Economics. 98 (1983) 659–679.
[8] J. Mailath, L. Samuelson, Who Wants a Good Reputation? Review of Economic Studies. 68 (2001) 415–441.
[9] H.H. Ali, S. Lecocq, M. Visser, The Impact of Gurus: Parker Grades and en Primeur Wine Prices, Economic Journal. 118(529) (2008) F158–F173.
[10] B.A. Benjamin, J.M. Podolny, Status, Quality, and Social Order in the California Wine Industry, Administrative Science Quarterly. 44(3) (1999) 563–589.
[11] S. Castriota, M. Delmastro, The economics of collective reputation: Evidence from the wine industry, American Journal of Agricultural Economics. 97(2) (2015) 469–489.
[12] S. Castriota, S. Corsi, P. Frumento, G. Ruggeri, Does Quality Pay off? “Superstar” Wines and the Uncertain Price Premium across Quality Grades, Journal of Wine Economics. 17(2) (2022) 141–158.
[13] G. Gastaldello, I. Schäufele-Elbers, G. Schamel, Factors Influencing Wine Ratings in an Online Wine Community: The Case of Trentino-Alto Adige, Journal of Wine Economics. 19 (2024) 19–40.
[14] P. Fanasch, B. Frick, The Value of Signals: Do Self-Declaration and Certification Generate Price Premiums for Organic and Biodynamic Wines? Journal of Cleaner Production. 249 (2020) 119415.
[15] B. Frick, Does Ownership Matter? Empirical Evidence from the German Wine Industry, Kyklos. 57(3) (2004) 357–386.
[16] B. Frick, R. Simmons, The Impact of Individual and Collective Reputation on Wine Prices: Empirical Evidence from the Mosel Valley, Journal of Business Economics. 83 (2013) 101–119.
[17] S. Landon, C.E. Smith, The Use of Quality and Reputation Indicators by Consumers: The Case of Bordeaux Wine, Journal of Consumer Policy. 20(3) (1997) 289–323.
[18] S. Landon, C.E. Smith, Quality Expectations, Reputations, and Price, Southern Economic Journal. 64 (1998) 628–647.
[19] M.A. Delmas, O. Gergaud, Sustainable Practices and Product Quality: Is there Value in Eco-Label Certification? The Case of Wine, Ecological Economics. 183 (2021) 106953.
[20] M. Lanfranchi, E. Schimmenti, M.G. Campolo, C. Giannetto, The Willingness to Pay of Sicilian Consumers for a Wine Obtained with Sustainable Production Method: An Estimate through an Ordered Probit Sample-Selection Model, Wine Economics and Policy. 8(2) (2019) 203–215.
[21] G. Scozzafava, F. Gerini, F. Boncinelli, C. Contini, L. Casini, How Much is a Bottle of Conventional, Organic or Biodynamic Wine Worth? Results of an Experimental Auction, Food Quality and Preference. 93 (2021) 104259.
[22] R. Sellers-Rubio, J.L. Nicolau-Gonzalbez, Estimating the Willingness to Pay for a Sustainable Wine Using a Heckit Model, Wine Economics and Policy. 5(2) (2016) 96–104.
[23] A.A. Ugaglia, B. Niklas, W. Rinke, D. Moscovici, J. Gow, L. Valenzuela, R. Mihailescu, Consumer Preferences for Certified Wines in France: A Comparison of Sustainable Labels, Wine Economics and Policy. 10(2) (2021) 75–86.
[24] R. Vecchio, A. Annunziata, E. Parga Dans, P. Alonso González, Drivers of Consumer Willingness to Pay for Sustainable Wines: Natural, Biodynamic, and Organic, Organic Agriculture. 13 (2023) 247–260.
[25] H. Kirchmann, Biological Dynamic Farming – An Occult Form of Alternative Agriculture? Journal of Agricultural & Environmental Ethics. 7 (1994) 173–187.
[26] J. Barquin, D. Smith, On Fertile Ground? Objections to Biodynamics, The World of Fine Wine. 12 (2006) 108–110.
[27] M. Caon, Bio Beware: Biodynamic Vineyards. Few People know what Biodynamic Means, Skeptic. 41(1) (2021) 32–37.
[28] G. Negro, M.T. Hannan, M. Fassiotto, Category Signaling and Reputation, Organization Science. 26(2) (2015) 584–600.
[29] L.A. Abraben, K.A. Grogan, G. Zhifeng, Organic Price Premium or Penalty? A Comparative Market Analysis of Organic Wines from Tuscany, Food Policy. 69 (2017) 154–165.
[30] M.A. Delmas, O. Gergaud, J. Lim, Does Organic Wine Taste Better? An Analysis of Experts’ Ratings, Journal of Wine Economics. 11(3) (2016) 329–354.
[31] M.A. Delmas, O. Gergaud, Sustainable practices and product quality: Is there value in eco-label certification? The case of wine, Ecological Economics. 183 (2021) 106953.
[32] G. Akerlof, The Market for Lemons: Quality Uncertainty and the Market Mechanism, Quarterly Journal of Economics. 84 (1970) 1007–1040.
[33] M. Spence, Job Market Signaling, Quarterly Journal of Economics. 87(3) (1973) 355–374.
[34] P. Nelson, Information and Consumer Behavior, Journal of Political Economy. 78(2) (1970) 311–329.
[35] M.R. Darby, E. Karni, Free Competition and the Optimal Amount of Fraud, Journal of Law and Economics. 16(1) (1973) 67–88.
[36] J. Tirole, A Theory of Collective Reputations (with Applications to the Persistence of Corruption and to Firm Quality), Review of Economic Studies. 63 (1996) 1–22.
[37] J.A. Winfree, J.J. McCluskey, Collective Reputation and Quality, American Journal of Agricultural Economics. 87 (2005) 206–213.
[38] F.S.M. Morton, J.M. Podolny, Love or Money? The Effects of Owner Motivation in the California Wine Industry, Journal of Industrial Economics. 50(4) (2002) 431–456.
[39] M.A. Delmas, O. Gergaud, Sustainable Certification for Future Generations: The Case of Family Business, Family Business Review. 27(3) (2014) 228–243.
[40] A.V. Banerjee, A Simple Model of Herd Behavior, Quarterly Journal of Economics. 107 (1992) 797–817.
[41] S. Bikhchandani, D. Hirshleifer, I. Welch, A Theory of Fads, Fashion, Custom, and Cultural Change as Informational Cascades, Journal of Political Economy, 100 (1992) 992–1026.
[42] S. Bikhchandani, D. Hirshleifer, I. Welch, Learning from the Behavior of Others: Conformity, Fads, and Informational Cascades, Journal of Economic Perspectives. 12 (1998) 151–170.
[43] G. Heal, H. Kunreuther, Social Reinforcement: Cascades, Entrapment, and Tipping, American Economic Journal: Microeconomics. 2 (2010) 86–99.
[44] J. Barney, Firm Resources and Sustained Competitive Advantage, Journal of Management. 17 (1991) 99–120.
[45] M. Porter, Competitive Strategy, New York, NY: Free Press. (1980).
[46] B. Frick, B., Some Cooperatives Produce Great Wines, but the Majority Does Not: Complementary Institutional Mechanisms to Improve the Performance of an Indispensable Organizational Form, Journal of Wine Economics. 12(4) (2017) 386–394.
[47] P. Fanasch, B. Frick, What Makes Cooperatives Successful? Identifying the Determinants of their Organizational Performance, Journal of Wine Economics. 13(3) (2018) 282–308.
[48] M. Delmas, N. Lessem, Eco-Premium or Eco-Penalty? Eco Labels and Quality in the Organic Wine Market, Business & Society. 56(2) (2017) 318–356.
[49] A.A. Kugel, F. Witte, E. Bahrs, A Hedonic Pricing Analysis of Fungus-Resistant Grape Varieties in Germany, Journal of Wine Economics. 21 (2026) 48–81.
[50] R. Halvorsen, R. Palmquist, The Interpretation of Dummy Variables in Semilogarithmic Equations, American Economic Review. 70(3) (1980) 474–475.
[51] A.W. Bennett, S. Müller Loose, Analysing Economic Performance of German Wine Estates Across Three Decades - What Can We Learn for the Future? Wine Economics and Policy. 14(2) (2025) 3–24.
[52] E. Perucchini, C. Mazzocchi, S. Corsi, Uncorking Success: Exploring the Productivity of Italian Wine Farms, Wine Economics and Policy. 14(1) (2025) 83–96.
[53] B. Frick, L. Beck-Werz, F. Lensing, When an Exchange Semester Is No Longer Enough: Why and How the Bologna-Reforms Changed the Behavior of High-Ability Students, Economies. 11 (2023) 103.
1 While the former is based on the past quality of a single firm’s output, the latter may be defined as the average quality produced by a group of firms to which an individual firm belongs. It is typically less costly for consumers to acquire information on collective quality that can then be used as an indicator of the quality produced by individual firms in that group. For example, a consumer’s expectation of the quality of a wine made by an individual winemaker from the Mosel valley may depend on the average quality of all Mosel wines.
2 Traditional or conventional production does not rule out the use of full automatic harvesters or steel tanks.
3 A number of recent studies show that consumers in surveys say they are willing to pay between 15 and 30 percent more for an organic wine than for a traditional one [see e.g. 20,21,22,23,24]. As we will show below, the price premium charged by organic wine-makers is much smaller, suggesting that consumers overstate their willingness to pay.
4 Kirchmann [25], Barquin and Smith [26] as well as Caon [27] argue that the rejection of scientific objectivity in favour of the subjective mystical approach means that biodynamic recommendations cannot be tested and validated by established scientific methods. In practical terms this means that any effect attributed to biodynamic preparations is a matter of belief, not of empirical evidence. Using different samples of wines from Alsace, Negro et al. [28] show that biodynamically produced wines are evaluated better than traditionally produced wines only in non-blind tastings (i.e. when the name of the producer is displayed on the bottle) while in blind tastings both types of wines receive similar evaluations and explain their finding with the stronger “category signalling effect” of biodynamic wines.
5 Using two large samples with thousands of wines from California and from France, Delmas et al. [30] as well as Delmas and Gergaud [31] find that organic wines receive significantly better expert ratings than conventionally produced wines.
6 While the quality of search goods (e.g. computers) can be identified prior to purchase, experience goods (e.g. food and wine) can only be evaluated after consumption [34]. Moreover, the quality of credence goods (e.g. drugs or therapeutic treatments) is difficult to ascertain even after purchase and consumption [35].
7 A potential concern here is collinearity: Our clustering scheme is primarily based on VDP density while at the same time individual VDP membership is included as an independent variable in the cluster-specific regressions. This, however, should not be a problem since individual wineries cannot apply for membership in VDP, but are invited by incumbents to join the organization. VDP members have a significantly higher individual reputation than non-members (see footnote 9 on p. 109) and, therefore, carefully select new members. In general, the individual reputation of new members is at least as high as the average reputation of the incumbents [14]. On the other hand, wineries leaving VDP have recently experienced a decrease in their reputation and have, therefore, become a threat to the organization’s reputation (the annual number of entries and exits is quite similar, resulting in a stable membership of around 200 wineries).
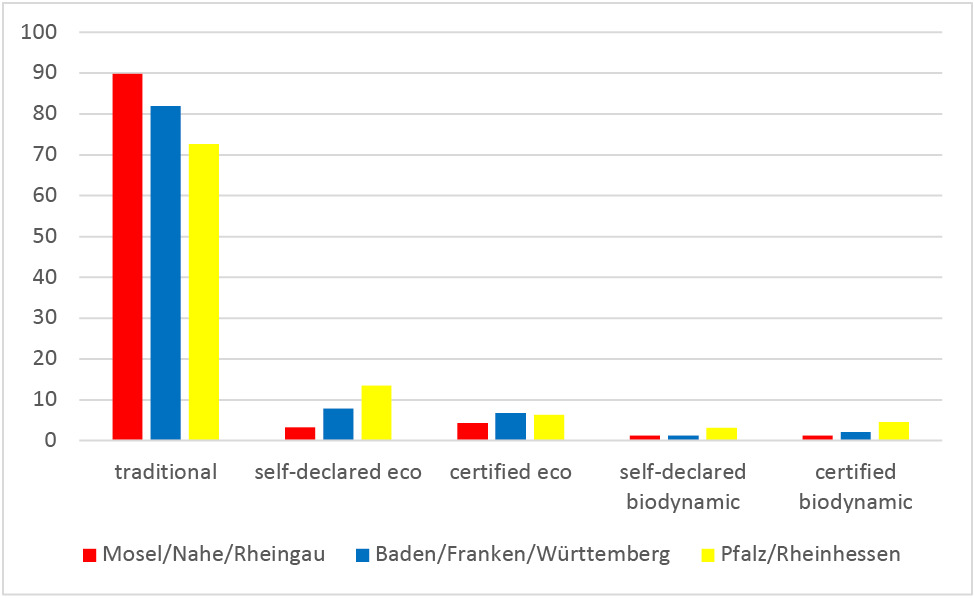
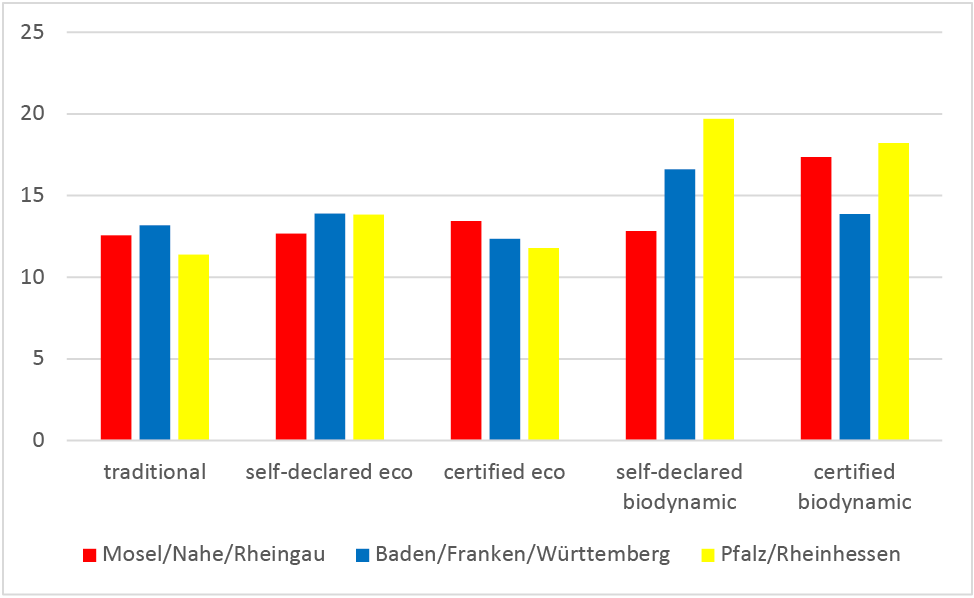
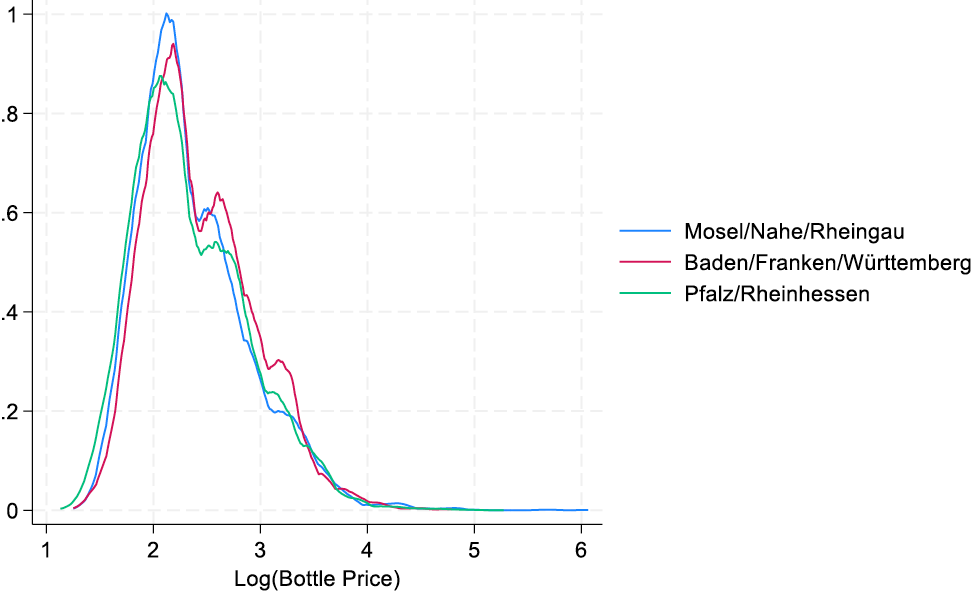
8 Figure A1 shows that in cluster 1 nearly 90 percent of the wines are conventionally produced while in cluster 3 the respective share is 73 percent only. On the other hand, 20 percent of the wines in cluster 3 are organic and 8 percent are biodynamic wines (the respective percentage shares in cluster 1 are 7 percent and 3 percent). Figure A2 displays the means of the bottle prices by cluster and method of production, Figure A3 the kernel density estimation of log of bottle price by cluster.
9 In each of the three clusters, the average individual reputation of VDP members is twice as high as the reputation of non-members. In cluster 1, the respective values are 3.01 and 1.55, in cluster 2 they are 1.50 and 2.94 and, finally, in cluster 3 they are 1.46 and 3.35 (always on a 5-point scale).
10 Reference category are the wineries that are included as “promising newcomers” with half a grape. In some exceptional cases, however, even newcomers are listed in the guide with one or two grapes.
11 The coefficients of the control variables (alcohol content, storage potential, wine aged in an oak barrel, winery is a cooperative) have the expected signs and are almost always statistically significant (with similar findings Kugel et al. [49]).
12 Further analyses of the productivity and/or profitability of wineries in Germany and Italy are provided by Bennett and Müller Loose [51] as well as Perucchini et al. [52].
13 Using a large dataset with detailed information on 9,096 German high-ability students, Frick et al. [53] find that following the Bologna reforms, high-ability students extended their stays and completed degrees abroad (instead of doing exchange semesters). No such changes in behavior are to be observed in the overall student population. Thus, given the changes in the environment, completing a degree abroad has become the new labor market signal for the ‘international qualification’ of high-ability students.
14 In 2023 – the most recent year for which the data is available – slightly more than 14,200 wineries existed in Germany, Thus, the sample used here includes the top 10 percent according to the evaluations provided by Gault Millau.