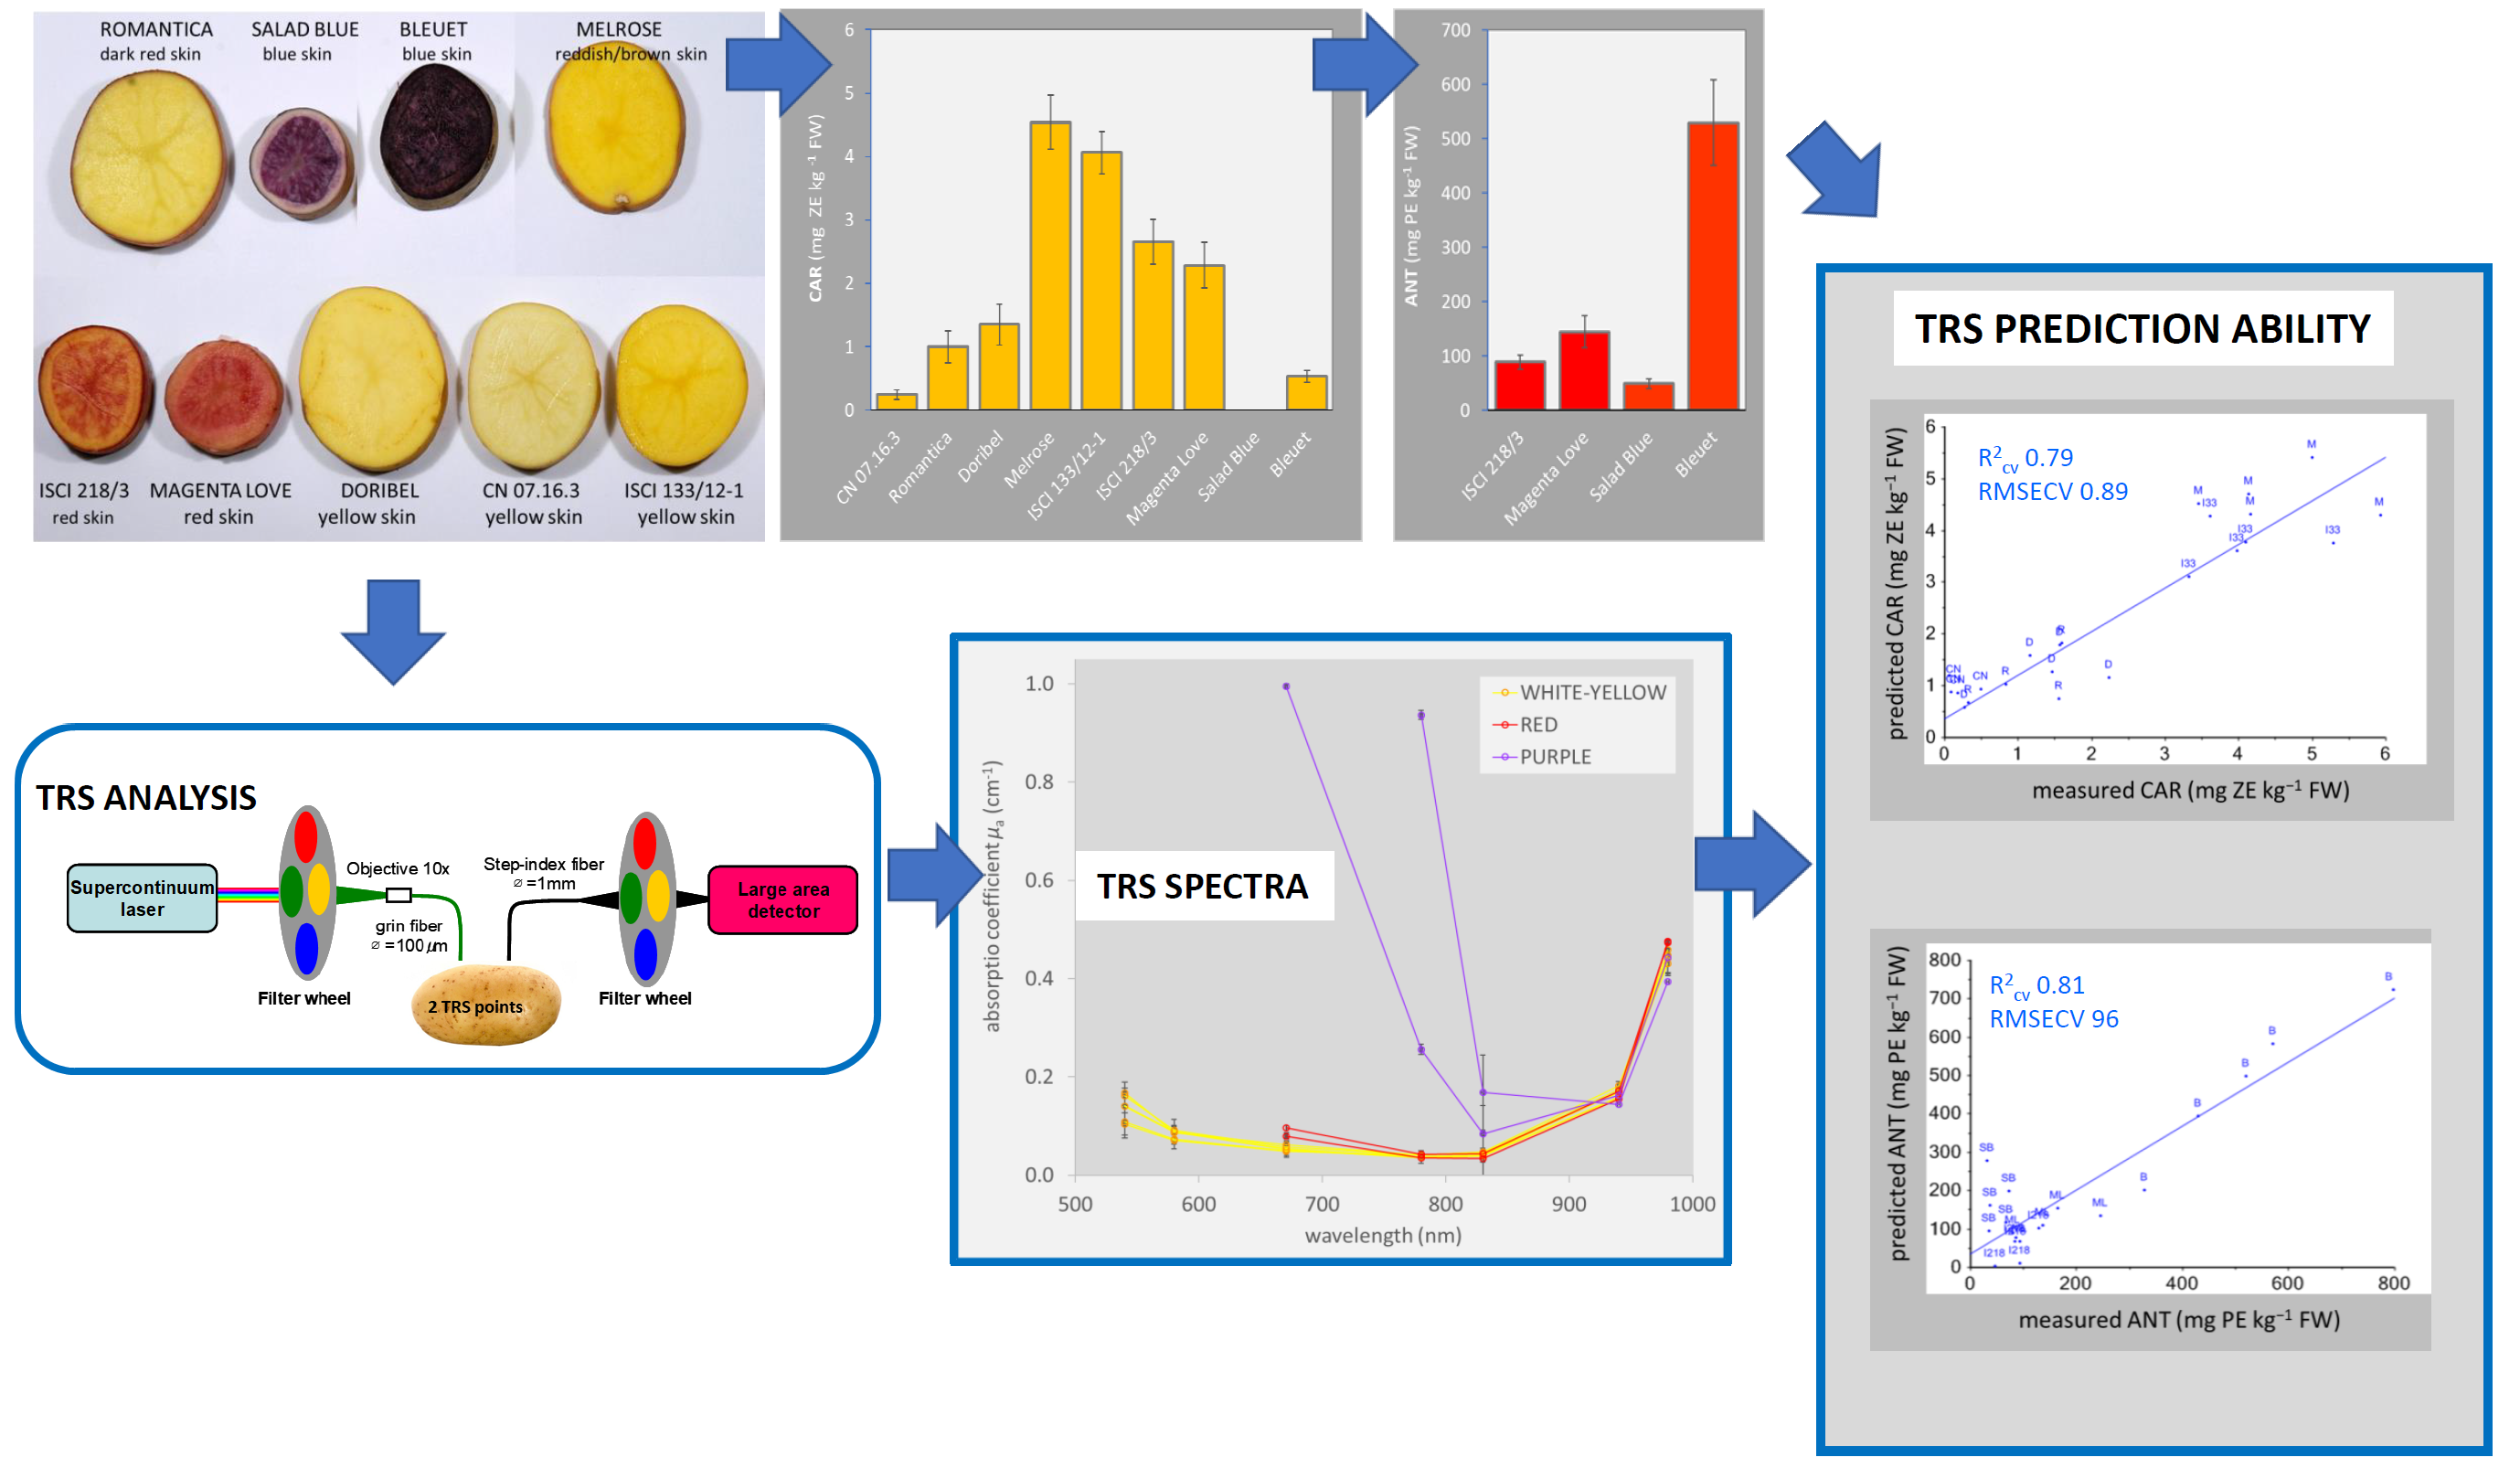
Anthocyanin and carotenoid contents assessed by time-resolved reflectance spectroscopy in potato tubers (Solanum tuberosum L.) with different flesh colors

Published 2020-06-18
Keywords
- absorption spectra,
- flesh color,
- partial least square regression,
- Solanum tuberosum L,
- TRS
How to Cite
Abstract
This work aimed at studying the relationships between the absorption spectra acquired by time-resolved reflectance spectroscopy (TRS) and the carotenoid (CAR) and/or the anthocyanin (ANT) contents in 9 potato genotypes with different flesh color (white, yellow, red, purple). Fifty whole and intact tubers/genotype were non-destructively measured by TRS in the 540-980 nm range; white- and yellow-fleshed were ranked according to increasing µa540, the red ones according to µa670 and the purple ones according to µa780. Then, 5 tubers/genotype, corresponding to the highest, the lowest and 3 intermediate values of each μa range, were analyzed for flesh color and CAR and ANT contents. In white- and yellow-fleshed genotypes, µa540 ranged from 0.078 to 0.207 cm-1, showing the highest value in ‘Melrose’ and in ‘ISCI 133/12-1’ and the lowest ones in ‘Romantica’ and in ‘CN 07.16.3’. In red-fleshed tubers, µa670 ranged from 0.049 to 0.146 with no significant differences between genotypes; in purple genotypes, µa780 ranged from 0.147 to 0.473, showing the highest values in ‘Bleuet’. CAR content ranged between 0.071 to 5.937 mg kg-1 FW, displaying the highest amounts in the deep yellow genotypes ‘Melrose’ and ‘ISCI 133/12-1’ and the lowest ones in the white ‘CN 07.16.3’ and in the dark purple ‘Bleuet’ tubers. ANT content ranged from 31.63 to 798.44 mg kg-1 FW in red-purple genotypes, having the highest values in ‘Bleuet’. By using TRS spectra and PLS analysis, it was possible to predict CAR (R2CV=0.79, RMSECV=0.89) and ANT (R2CV =0.81, RMSECV=95.53) contents and flesh color (h°) in yellow-fleshed genotypes (R2CV =0.93, RMSECV=0.67) and purple genotypes (R2CV =0.82, RMSECV=1.63).


